
|
|||||
|
 | |
| |
| |
| |
| |
| |
|
Gene: ADGRL2 |
Gene summary for ADGRL2 |
| Gene information | Species | Human | Gene symbol | ADGRL2 | Gene ID | 23266 |
| Gene name | adhesion G protein-coupled receptor L2 | |
| Gene Alias | CIRL2 | |
| Cytomap | 1p31.1 | |
| Gene Type | protein-coding | GO ID | GO:0007154 | UniProtAcc | O95490 |
Top |
Malignant transformation analysis |
| Identification of the aberrant gene expression in precancerous and cancerous lesions by comparing the gene expression of stem-like cells in diseased tissues with normal stem cells |
| Entrez ID | Symbol | Replicates | Species | Organ | Tissue | Adj P-value | Log2FC | Malignancy |
| 23266 | ADGRL2 | CCI_1 | Human | Cervix | CC | 9.96e-10 | 1.76e+00 | 0.528 |
| 23266 | ADGRL2 | CCI_2 | Human | Cervix | CC | 4.34e-02 | 6.38e-01 | 0.5249 |
| 23266 | ADGRL2 | CCI_3 | Human | Cervix | CC | 1.43e-09 | 7.74e-01 | 0.516 |
| 23266 | ADGRL2 | AEH-subject1 | Human | Endometrium | AEH | 3.79e-23 | 5.75e-01 | -0.3059 |
| 23266 | ADGRL2 | AEH-subject2 | Human | Endometrium | AEH | 4.46e-10 | 4.29e-01 | -0.2525 |
| 23266 | ADGRL2 | AEH-subject3 | Human | Endometrium | AEH | 2.43e-15 | 4.70e-01 | -0.2576 |
| 23266 | ADGRL2 | AEH-subject4 | Human | Endometrium | AEH | 1.74e-15 | 5.51e-01 | -0.2657 |
| 23266 | ADGRL2 | AEH-subject5 | Human | Endometrium | AEH | 2.97e-11 | 3.91e-01 | -0.2953 |
| 23266 | ADGRL2 | EEC-subject1 | Human | Endometrium | EEC | 5.17e-06 | 2.78e-01 | -0.2682 |
| 23266 | ADGRL2 | EEC-subject2 | Human | Endometrium | EEC | 3.17e-07 | 3.10e-01 | -0.2607 |
| 23266 | ADGRL2 | GSM6177620_NYU_UCEC1_lib3_lib3 | Human | Endometrium | EEC | 3.55e-03 | 1.98e-01 | -0.1883 |
| 23266 | ADGRL2 | GSM6177621_NYU_UCEC2_lib1_lib1 | Human | Endometrium | EEC | 1.27e-02 | -6.06e-02 | -0.1934 |
| 23266 | ADGRL2 | GSM6177622_NYU_UCEC3_lib1_lib1 | Human | Endometrium | EEC | 4.26e-03 | 4.94e-02 | -0.1917 |
| 23266 | ADGRL2 | GSM6177622_NYU_UCEC3_lib2_lib2 | Human | Endometrium | EEC | 6.75e-03 | 9.11e-02 | -0.1916 |
| 23266 | ADGRL2 | GSM6177623_NYU_UCEC3_Vis | Human | Endometrium | EEC | 7.50e-10 | 3.75e-01 | -0.1269 |
| 23266 | ADGRL2 | P2T-E | Human | Esophagus | ESCC | 3.86e-20 | 2.90e-01 | 0.1177 |
| 23266 | ADGRL2 | P5T-E | Human | Esophagus | ESCC | 1.10e-02 | 5.29e-02 | 0.1327 |
| 23266 | ADGRL2 | P8T-E | Human | Esophagus | ESCC | 3.52e-05 | 6.33e-02 | 0.0889 |
| 23266 | ADGRL2 | P10T-E | Human | Esophagus | ESCC | 4.01e-09 | 1.77e-01 | 0.116 |
| 23266 | ADGRL2 | P22T-E | Human | Esophagus | ESCC | 3.72e-02 | -8.69e-03 | 0.1236 |
| Page: 1 2 3 |
| Tissue | Expression Dynamics | Abbreviation |
| Cervix | 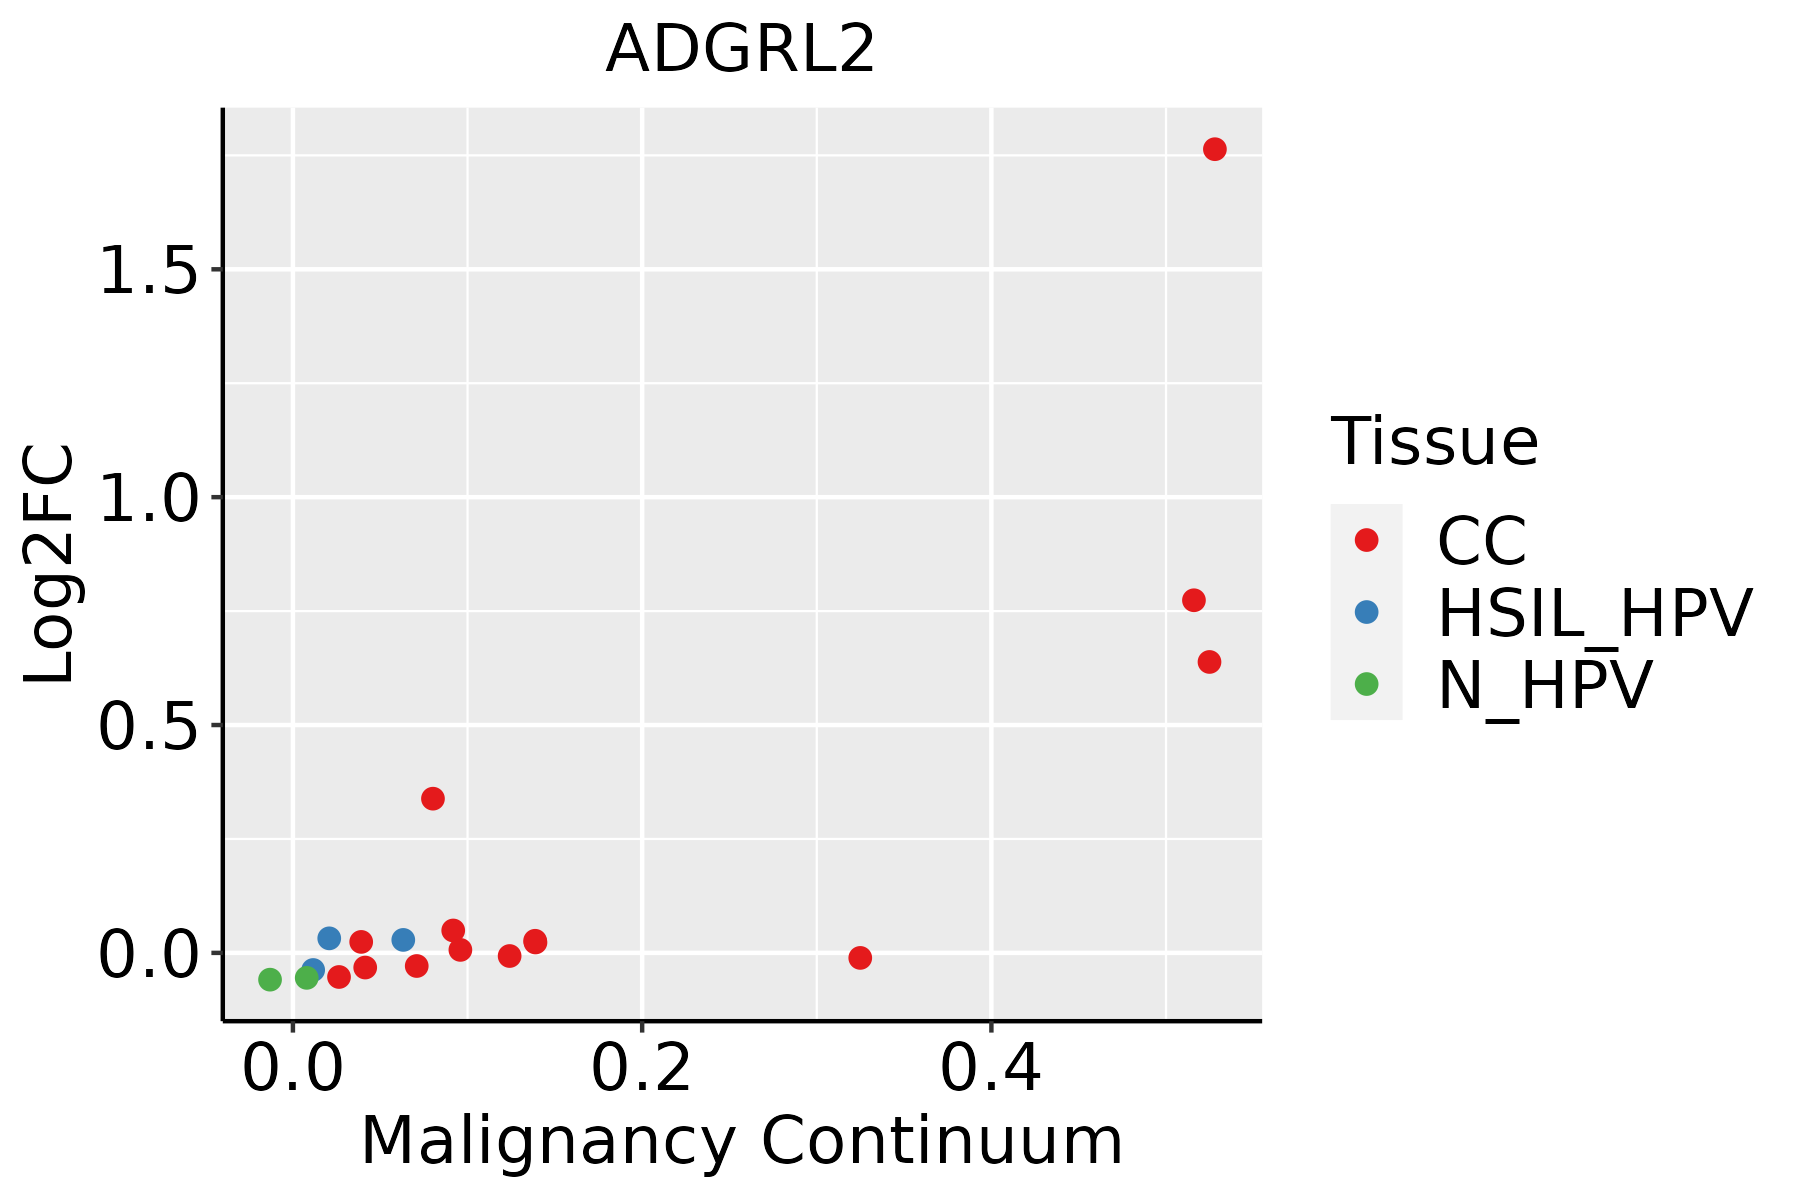 | CC: Cervix cancer |
| HSIL_HPV: HPV-infected high-grade squamous intraepithelial lesions | ||
| N_HPV: HPV-infected normal cervix | ||
| Endometrium | 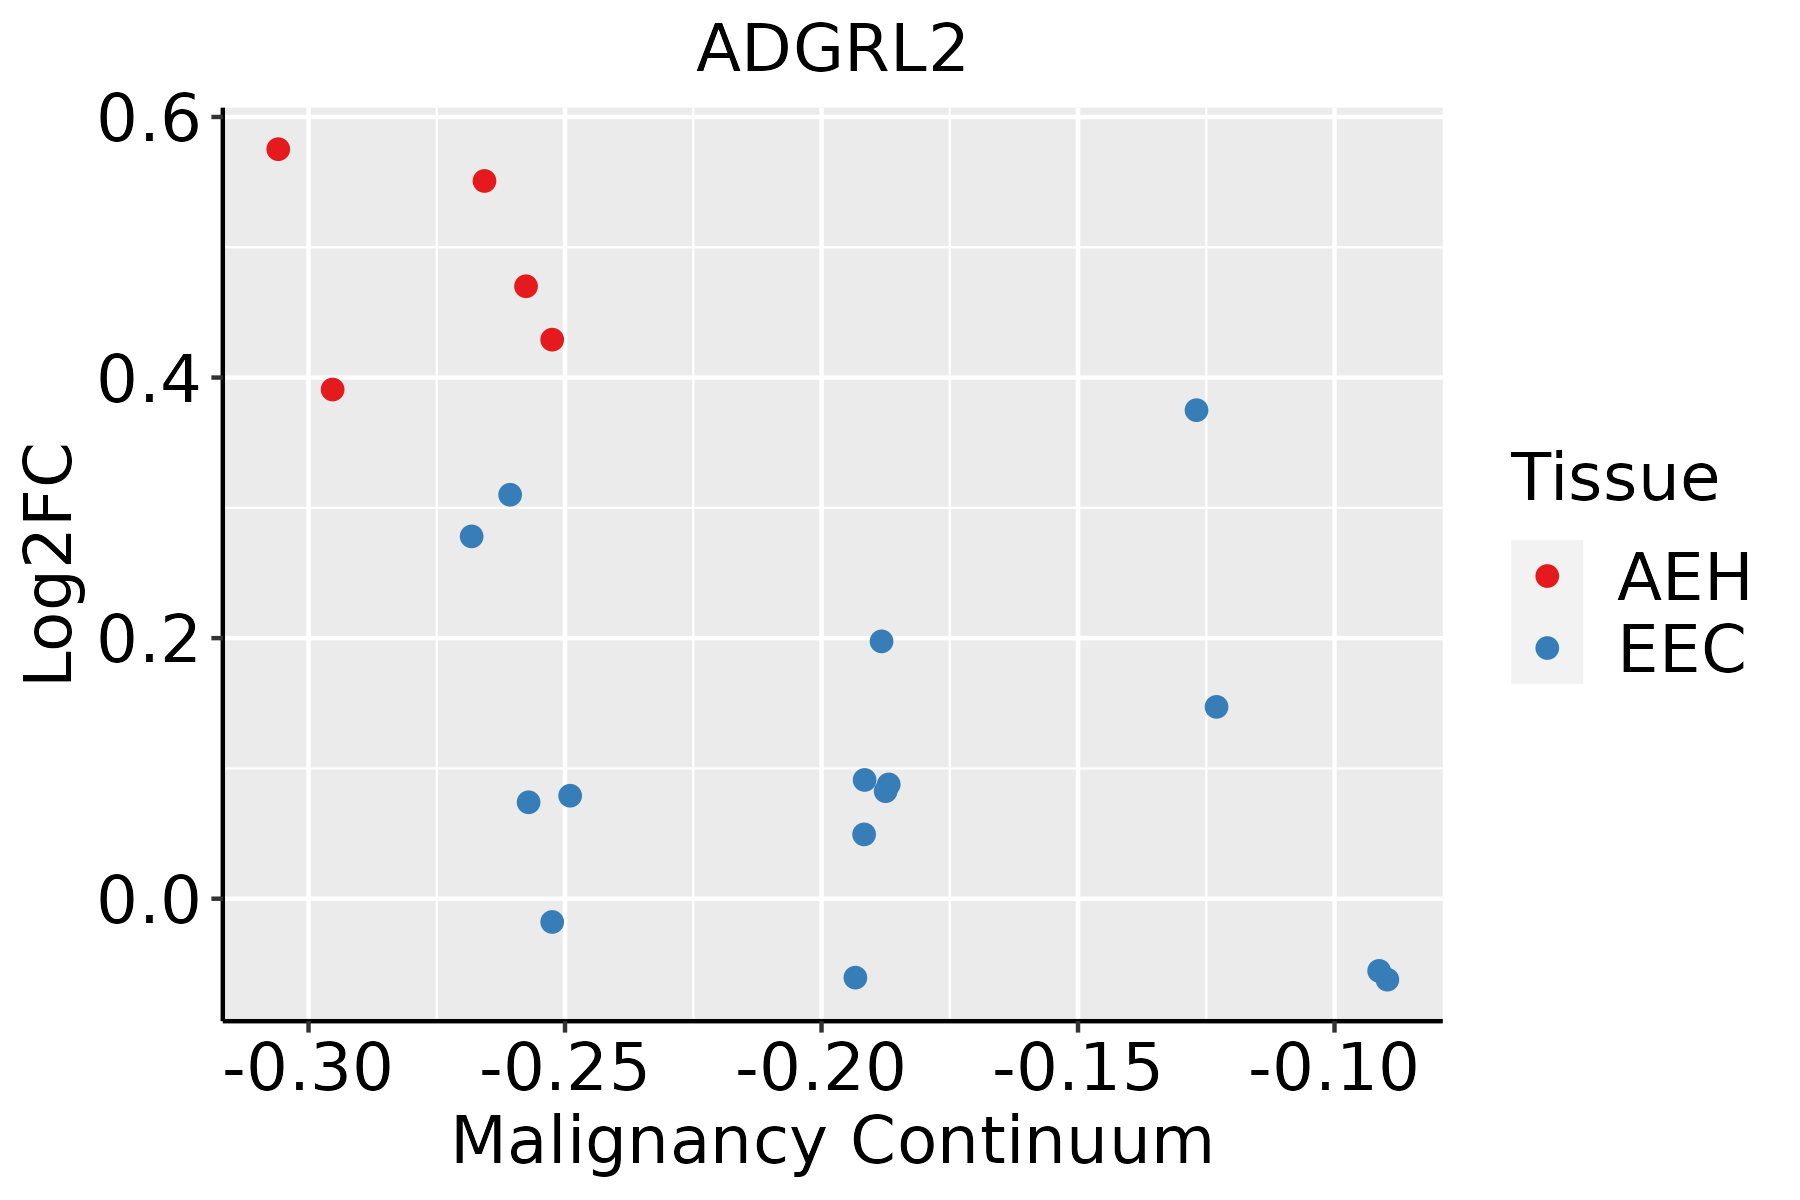 | AEH: Atypical endometrial hyperplasia |
| EEC: Endometrioid Cancer | ||
| Esophagus | 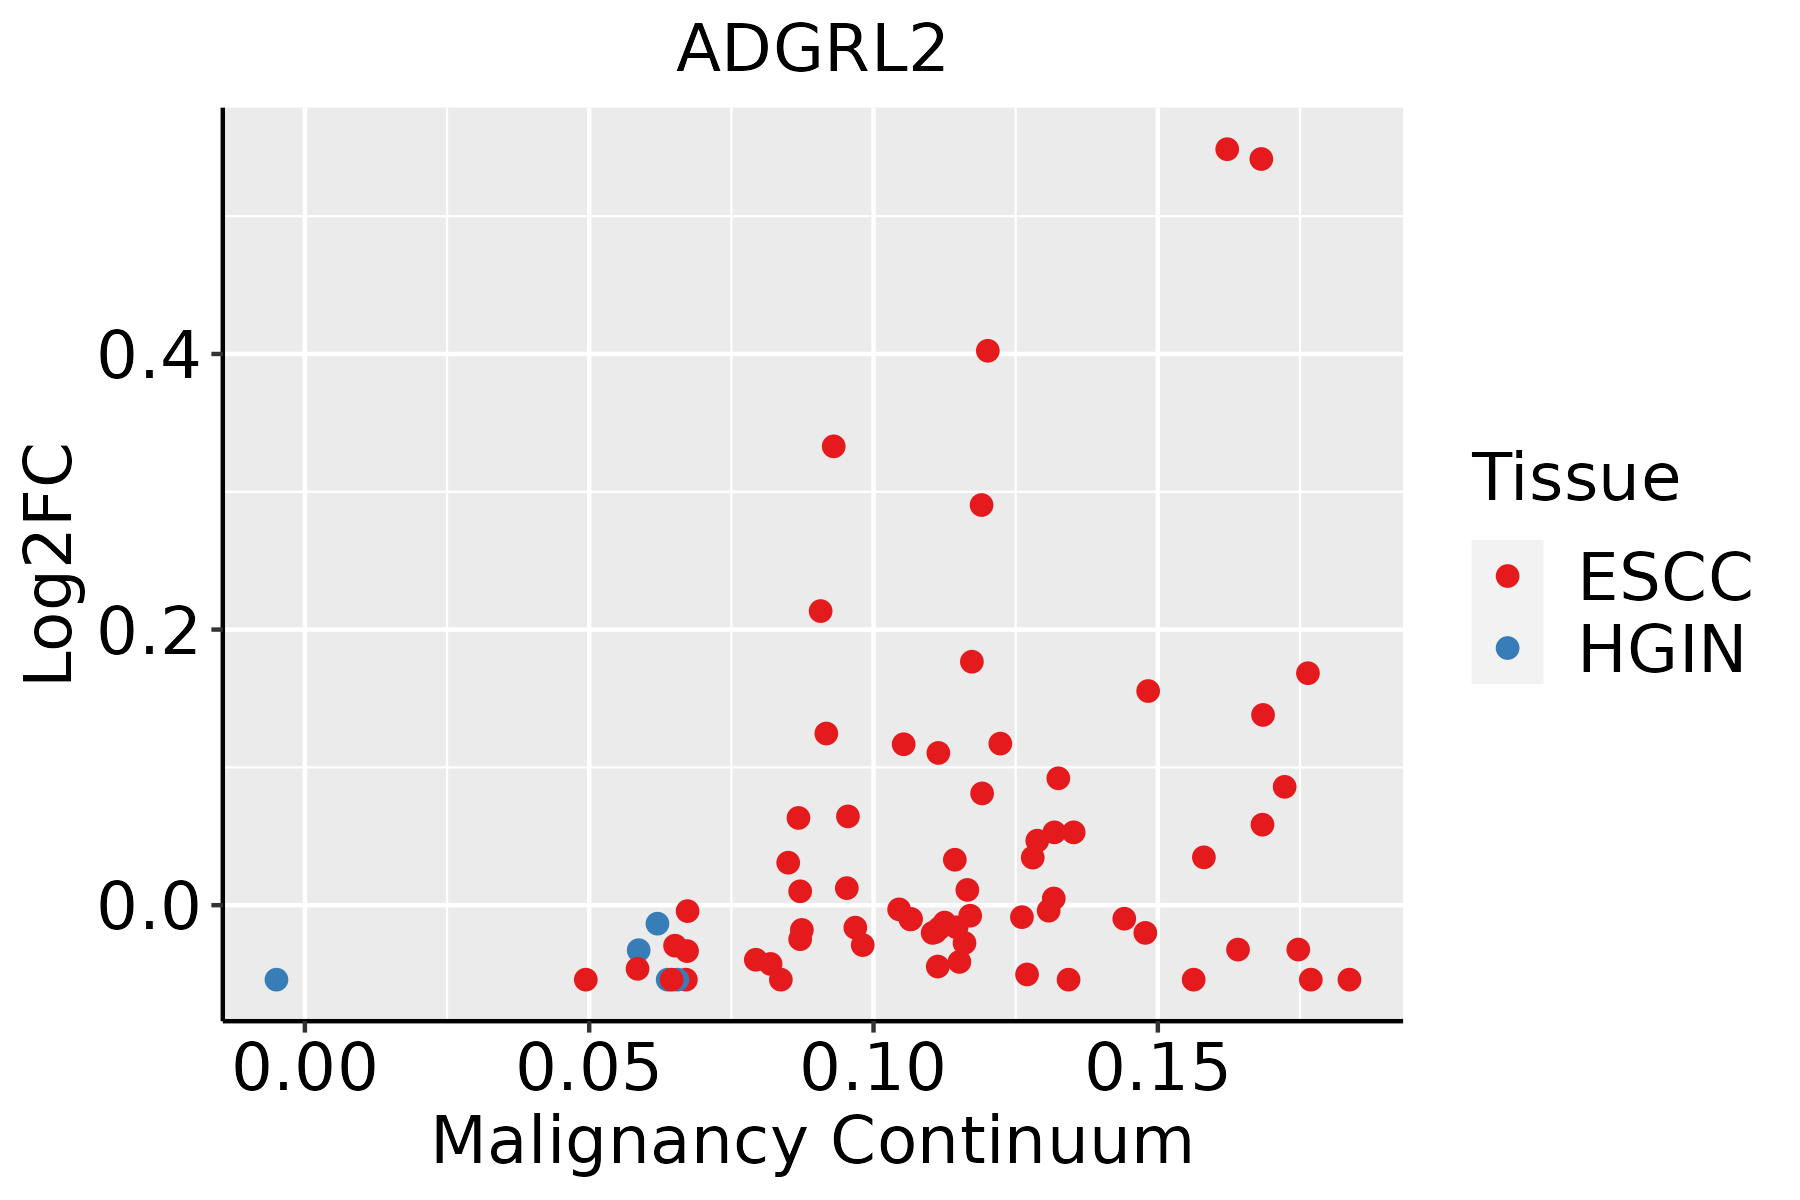 | ESCC: Esophageal squamous cell carcinoma |
| HGIN: High-grade intraepithelial neoplasias | ||
| LGIN: Low-grade intraepithelial neoplasias | ||
| Liver | 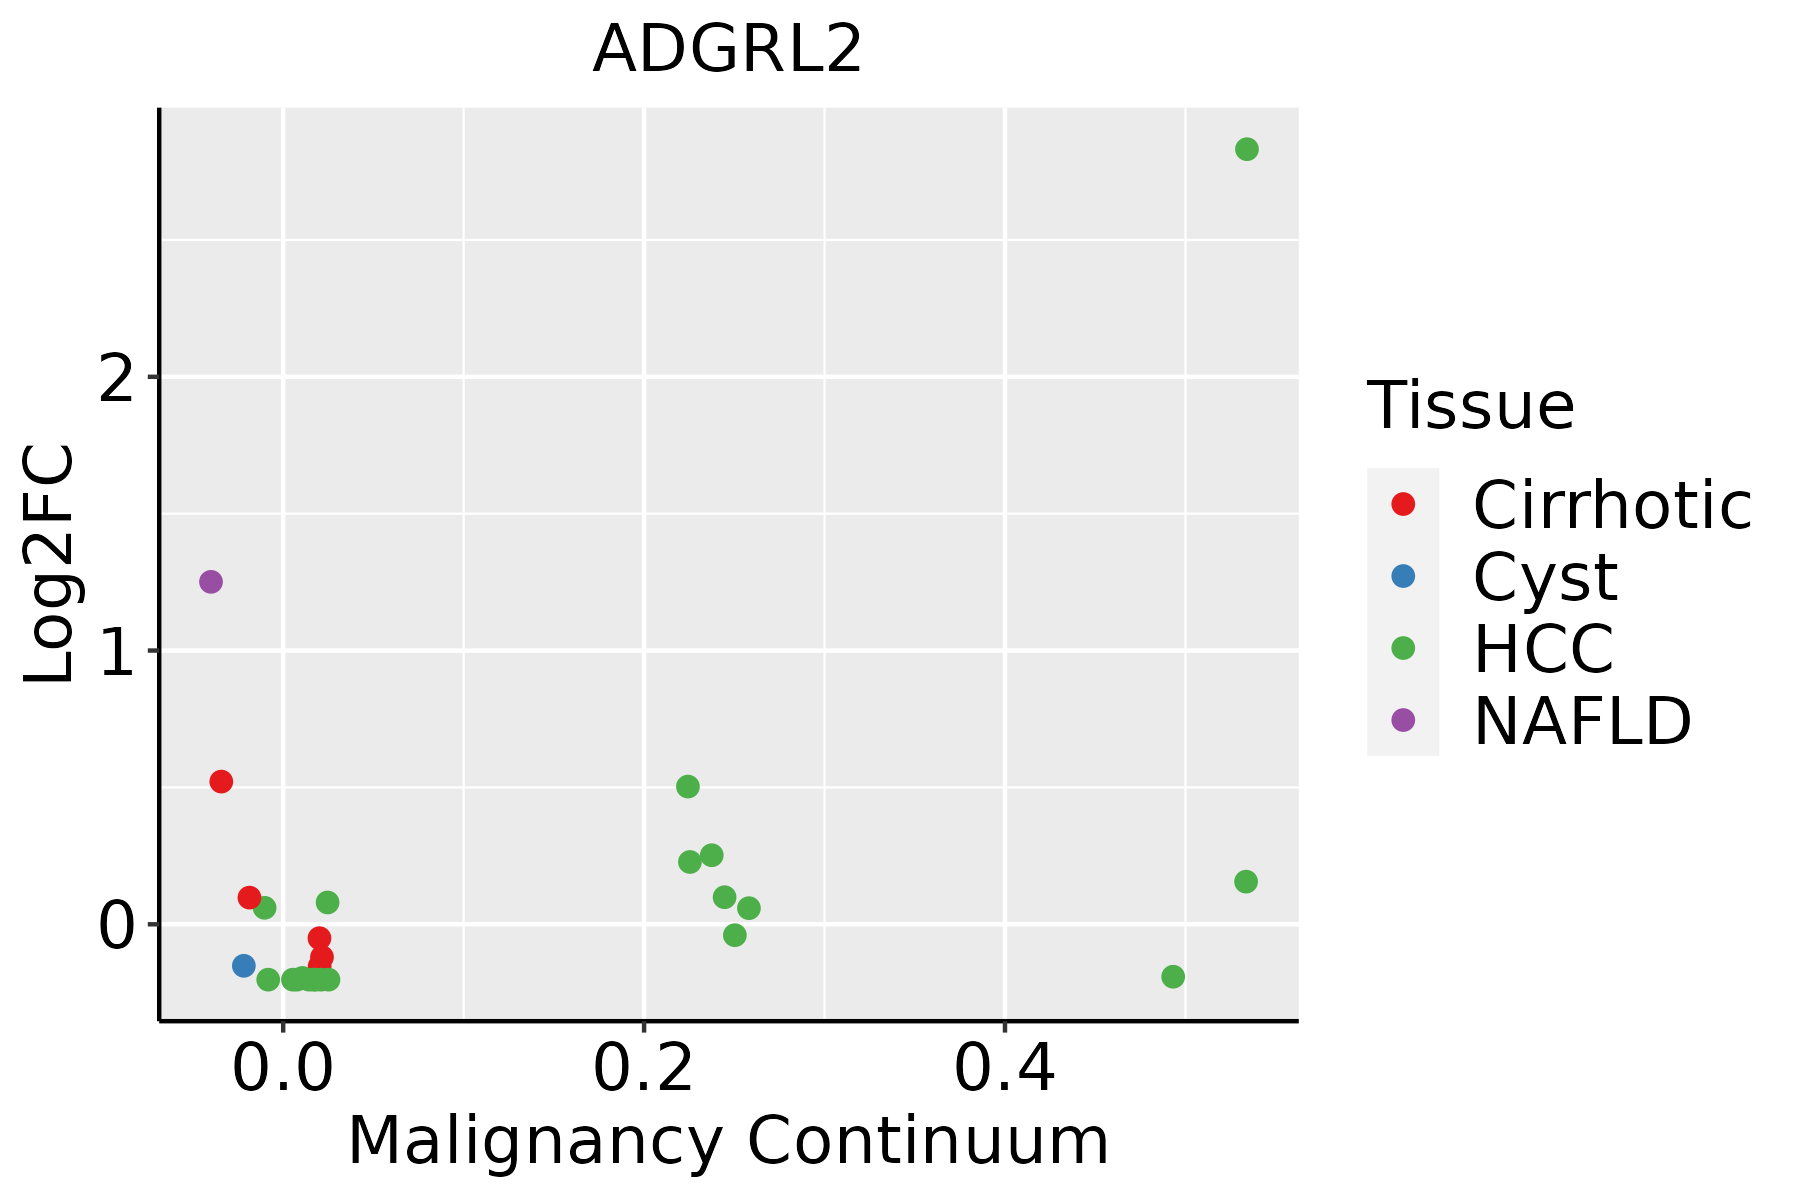 | HCC: Hepatocellular carcinoma |
| NAFLD: Non-alcoholic fatty liver disease |
| ∗log2FC in expression of this searched gene in stem-like cells from each diseased tissue sample relative to stem-like cells in normal samples in each tissue plotted against the malignancy continuum. Samples are colored based on if they are from different disease stage. |
Top |
Malignant transformation related pathway analysis |
| Find out the enriched GO biological processes and KEGG pathways involved in transition from healthy to precancer to cancer |
| Tissue | Disease Stage | Enriched GO biological Processes |
| Colorectum | AD |  |
| Colorectum | SER |  |
| Colorectum | MSS |  |
| Colorectum | MSI-H |  |
| Colorectum | FAP |  |
| ∗Top 15 enriched GO BP terms are showed in the bar plot of each disease state in each tissue. Each row represents a significant GO biological process which is colored according to the -log10(p.adjust). |
| Page: 1 2 3 4 5 6 7 8 9 |
| GO ID | Tissue | Disease Stage | Description | Gene Ratio | Bg Ratio | pvalue | p.adjust | Count |
| GO:00343298 | Cervix | CC | cell junction assembly | 88/2311 | 420/18723 | 3.42e-07 | 1.38e-05 | 88 |
| GO:19018886 | Cervix | CC | regulation of cell junction assembly | 42/2311 | 204/18723 | 5.50e-04 | 5.29e-03 | 42 |
| GO:00519603 | Cervix | CC | regulation of nervous system development | 77/2311 | 443/18723 | 1.13e-03 | 9.30e-03 | 77 |
| GO:00519622 | Cervix | CC | positive regulation of nervous system development | 48/2311 | 272/18723 | 6.60e-03 | 3.65e-02 | 48 |
| GO:00343299 | Endometrium | AEH | cell junction assembly | 78/2100 | 420/18723 | 4.80e-06 | 1.24e-04 | 78 |
| GO:19018887 | Endometrium | AEH | regulation of cell junction assembly | 39/2100 | 204/18723 | 5.94e-04 | 5.86e-03 | 39 |
| GO:00508086 | Endometrium | AEH | synapse organization | 67/2100 | 426/18723 | 2.67e-03 | 1.94e-02 | 67 |
| GO:003432914 | Endometrium | EEC | cell junction assembly | 79/2168 | 420/18723 | 8.37e-06 | 1.85e-04 | 79 |
| GO:190188812 | Endometrium | EEC | regulation of cell junction assembly | 37/2168 | 204/18723 | 3.70e-03 | 2.48e-02 | 37 |
| GO:005080812 | Endometrium | EEC | synapse organization | 68/2168 | 426/18723 | 3.73e-03 | 2.49e-02 | 68 |
| GO:003432918 | Esophagus | ESCC | cell junction assembly | 227/8552 | 420/18723 | 3.06e-04 | 1.83e-03 | 227 |
| GO:00519606 | Esophagus | ESCC | regulation of nervous system development | 237/8552 | 443/18723 | 5.02e-04 | 2.78e-03 | 237 |
| GO:00519625 | Esophagus | ESCC | positive regulation of nervous system development | 149/8552 | 272/18723 | 1.50e-03 | 7.06e-03 | 149 |
| GO:190188810 | Esophagus | ESCC | regulation of cell junction assembly | 109/8552 | 204/18723 | 1.53e-02 | 4.96e-02 | 109 |
| GO:00343296 | Liver | NAFLD | cell junction assembly | 66/1882 | 420/18723 | 1.64e-04 | 3.00e-03 | 66 |
| GO:19018884 | Liver | NAFLD | regulation of cell junction assembly | 36/1882 | 204/18723 | 5.82e-04 | 7.77e-03 | 36 |
| Page: 1 |
| Pathway ID | Tissue | Disease Stage | Description | Gene Ratio | Bg Ratio | pvalue | p.adjust | qvalue | Count |
| Page: 1 |
Top |
Cell-cell communication analysis |
| Identification of potential cell-cell interactions between two cell types and their ligand-receptor pairs for different disease states |
| Ligand | Receptor | LRpair | Pathway | Tissue | Disease Stage |
| Page: 1 |
Top |
Single-cell gene regulatory network inference analysis |
| Find out the significant the regulons (TFs) and the target genes of each regulon across cell types for different disease states |
| TF | Cell Type | Tissue | Disease Stage | Target Gene | RSS | Regulon Activity |
| ∗The dot plots of a searched regulon are shown for all cell subpopulations in each disease state of each tissue based on the regulon specific score inferred using pySCENIC and by calculating the average expression. |
| Page: 1 |
Top |
Somatic mutation of malignant transformation related genes |
| Annotation of somatic variants for genes involved in malignant transformation |
| Hugo Symbol | Variant Class | Variant Classification | dbSNP RS | HGVSc | HGVSp | HGVSp Short | SWISSPROT | BIOTYPE | SIFT | PolyPhen | Tumor Sample Barcode | Tissue | Histology | Sex | Age | Stage | Therapy Types | Drugs | Outcome |
| ADGRL2 | SNV | Missense_Mutation | c.4201N>A | p.Pro1401Thr | p.P1401T | O95490 | protein_coding | tolerated_low_confidence(0.06) | probably_damaging(0.999) | TCGA-A7-A0CD-01 | Breast | breast invasive carcinoma | Female | >=65 | I/II | Hormone Therapy | arimidex | SD | |
| ADGRL2 | SNV | Missense_Mutation | c.724N>A | p.Glu242Lys | p.E242K | O95490 | protein_coding | deleterious(0.01) | probably_damaging(0.993) | TCGA-A8-A09I-01 | Breast | breast invasive carcinoma | Female | >=65 | I/II | Hormone Therapy | anastrozole | SD | |
| ADGRL2 | SNV | Missense_Mutation | c.994N>A | p.Glu332Lys | p.E332K | O95490 | protein_coding | deleterious(0.01) | probably_damaging(0.992) | TCGA-AC-A2FG-01 | Breast | breast invasive carcinoma | Female | >=65 | I/II | Hormone Therapy | arimidex | CR | |
| ADGRL2 | SNV | Missense_Mutation | novel | c.793G>A | p.Asp265Asn | p.D265N | O95490 | protein_coding | deleterious(0) | probably_damaging(0.997) | TCGA-AN-A046-01 | Breast | breast invasive carcinoma | Female | >=65 | I/II | Unknown | Unknown | SD |
| ADGRL2 | SNV | Missense_Mutation | novel | c.949A>G | p.Ile317Val | p.I317V | O95490 | protein_coding | tolerated(0.65) | probably_damaging(0.924) | TCGA-AN-A046-01 | Breast | breast invasive carcinoma | Female | >=65 | I/II | Unknown | Unknown | SD |
| ADGRL2 | SNV | Missense_Mutation | novel | c.3964N>C | p.Ser1322Pro | p.S1322P | O95490 | protein_coding | tolerated_low_confidence(0.08) | probably_damaging(0.993) | TCGA-AN-A0XP-01 | Breast | breast invasive carcinoma | Female | >=65 | III/IV | Unknown | Unknown | SD |
| ADGRL2 | SNV | Missense_Mutation | c.544N>T | p.Thr182Ser | p.T182S | O95490 | protein_coding | tolerated(0.11) | probably_damaging(0.992) | TCGA-AR-A1AO-01 | Breast | breast invasive carcinoma | Female | <65 | I/II | Chemotherapy | doxorubicin | SD | |
| ADGRL2 | SNV | Missense_Mutation | novel | c.3520N>A | p.Asp1174Asn | p.D1174N | O95490 | protein_coding | deleterious(0.02) | probably_damaging(0.997) | TCGA-BH-A0B6-01 | Breast | breast invasive carcinoma | Female | <65 | I/II | Unknown | Unknown | SD |
| ADGRL2 | SNV | Missense_Mutation | rs778439430 | c.832G>A | p.Ala278Thr | p.A278T | O95490 | protein_coding | tolerated(0.05) | probably_damaging(0.997) | TCGA-D8-A146-01 | Breast | breast invasive carcinoma | Female | <65 | I/II | Unknown | Unknown | SD |
| ADGRL2 | SNV | Missense_Mutation | c.760N>C | p.Ser254Pro | p.S254P | O95490 | protein_coding | deleterious(0) | probably_damaging(0.993) | TCGA-E2-A14S-01 | Breast | breast invasive carcinoma | Female | >=65 | I/II | Chemotherapy | cytoxan | SD |
| Page: 1 2 3 4 5 6 7 8 9 10 11 12 13 14 15 16 17 18 19 20 21 22 23 24 25 26 |
Top |
Related drugs of malignant transformation related genes |
| Identification of chemicals and drugs interact with genes involved in malignant transfromation |
| (DGIdb 4.0) |
| Entrez ID | Symbol | Category | Interaction Types | Drug Claim Name | Drug Name | PMIDs |
| Page: 1 |

Copyright 2023-Present -The University of Texas Health Science Center at Houston |