
|
|||||
|
 | |
| |
| |
| |
| |
| |
|
Gene: ADGRG1 |
Gene summary for ADGRG1 |
| Gene information | Species | Human | Gene symbol | ADGRG1 | Gene ID | 9289 |
| Gene name | adhesion G protein-coupled receptor G1 | |
| Gene Alias | BFPP | |
| Cytomap | 16q21 | |
| Gene Type | protein-coding | GO ID | GO:0000003 | UniProtAcc | A0A0S2Z517 |
Top |
Malignant transformation analysis |
| Identification of the aberrant gene expression in precancerous and cancerous lesions by comparing the gene expression of stem-like cells in diseased tissues with normal stem cells |
| Entrez ID | Symbol | Replicates | Species | Organ | Tissue | Adj P-value | Log2FC | Malignancy |
| 9289 | ADGRG1 | HTA11_3410_2000001011 | Human | Colorectum | AD | 2.46e-10 | 3.28e-01 | 0.0155 |
| 9289 | ADGRG1 | HTA11_2951_2000001011 | Human | Colorectum | AD | 3.56e-02 | 5.00e-01 | 0.0216 |
| 9289 | ADGRG1 | HTA11_1938_2000001011 | Human | Colorectum | AD | 8.87e-10 | 6.03e-01 | -0.0811 |
| 9289 | ADGRG1 | HTA11_78_2000001011 | Human | Colorectum | AD | 1.15e-04 | 3.69e-01 | -0.1088 |
| 9289 | ADGRG1 | HTA11_347_2000001011 | Human | Colorectum | AD | 1.36e-06 | 3.74e-01 | -0.1954 |
| 9289 | ADGRG1 | HTA11_3361_2000001011 | Human | Colorectum | AD | 1.09e-03 | 4.45e-01 | -0.1207 |
| 9289 | ADGRG1 | HTA11_83_2000001011 | Human | Colorectum | SER | 2.77e-02 | 3.47e-01 | -0.1526 |
| 9289 | ADGRG1 | HTA11_696_2000001011 | Human | Colorectum | AD | 3.65e-15 | 5.98e-01 | -0.1464 |
| 9289 | ADGRG1 | HTA11_866_2000001011 | Human | Colorectum | AD | 1.41e-11 | 3.46e-01 | -0.1001 |
| 9289 | ADGRG1 | HTA11_1391_2000001011 | Human | Colorectum | AD | 2.54e-13 | 6.40e-01 | -0.059 |
| 9289 | ADGRG1 | HTA11_5212_2000001011 | Human | Colorectum | AD | 2.92e-04 | 4.50e-01 | -0.2061 |
| 9289 | ADGRG1 | HTA11_546_2000001011 | Human | Colorectum | AD | 5.71e-05 | 4.97e-01 | -0.0842 |
| 9289 | ADGRG1 | HTA11_866_3004761011 | Human | Colorectum | AD | 1.78e-17 | 6.46e-01 | 0.096 |
| 9289 | ADGRG1 | HTA11_8622_2000001021 | Human | Colorectum | SER | 1.80e-05 | 5.50e-01 | 0.0528 |
| 9289 | ADGRG1 | HTA11_7663_2000001011 | Human | Colorectum | SER | 1.95e-02 | 6.64e-01 | 0.0131 |
| 9289 | ADGRG1 | HTA11_10623_2000001011 | Human | Colorectum | AD | 8.78e-04 | 4.84e-01 | -0.0177 |
| 9289 | ADGRG1 | HTA11_6801_2000001011 | Human | Colorectum | SER | 1.17e-02 | 6.07e-01 | 0.0171 |
| 9289 | ADGRG1 | HTA11_10711_2000001011 | Human | Colorectum | AD | 2.43e-10 | 5.61e-01 | 0.0338 |
| 9289 | ADGRG1 | HTA11_7696_3000711011 | Human | Colorectum | AD | 3.52e-37 | 9.56e-01 | 0.0674 |
| 9289 | ADGRG1 | HTA11_6818_2000001011 | Human | Colorectum | AD | 1.37e-06 | 7.36e-01 | 0.0112 |
| Page: 1 2 3 4 5 6 7 |
| Tissue | Expression Dynamics | Abbreviation |
| Colorectum (GSE201348) |  | FAP: Familial adenomatous polyposis |
| CRC: Colorectal cancer | ||
| Colorectum (HTA11) |  | AD: Adenomas |
| SER: Sessile serrated lesions | ||
| MSI-H: Microsatellite-high colorectal cancer | ||
| MSS: Microsatellite stable colorectal cancer | ||
| Esophagus | 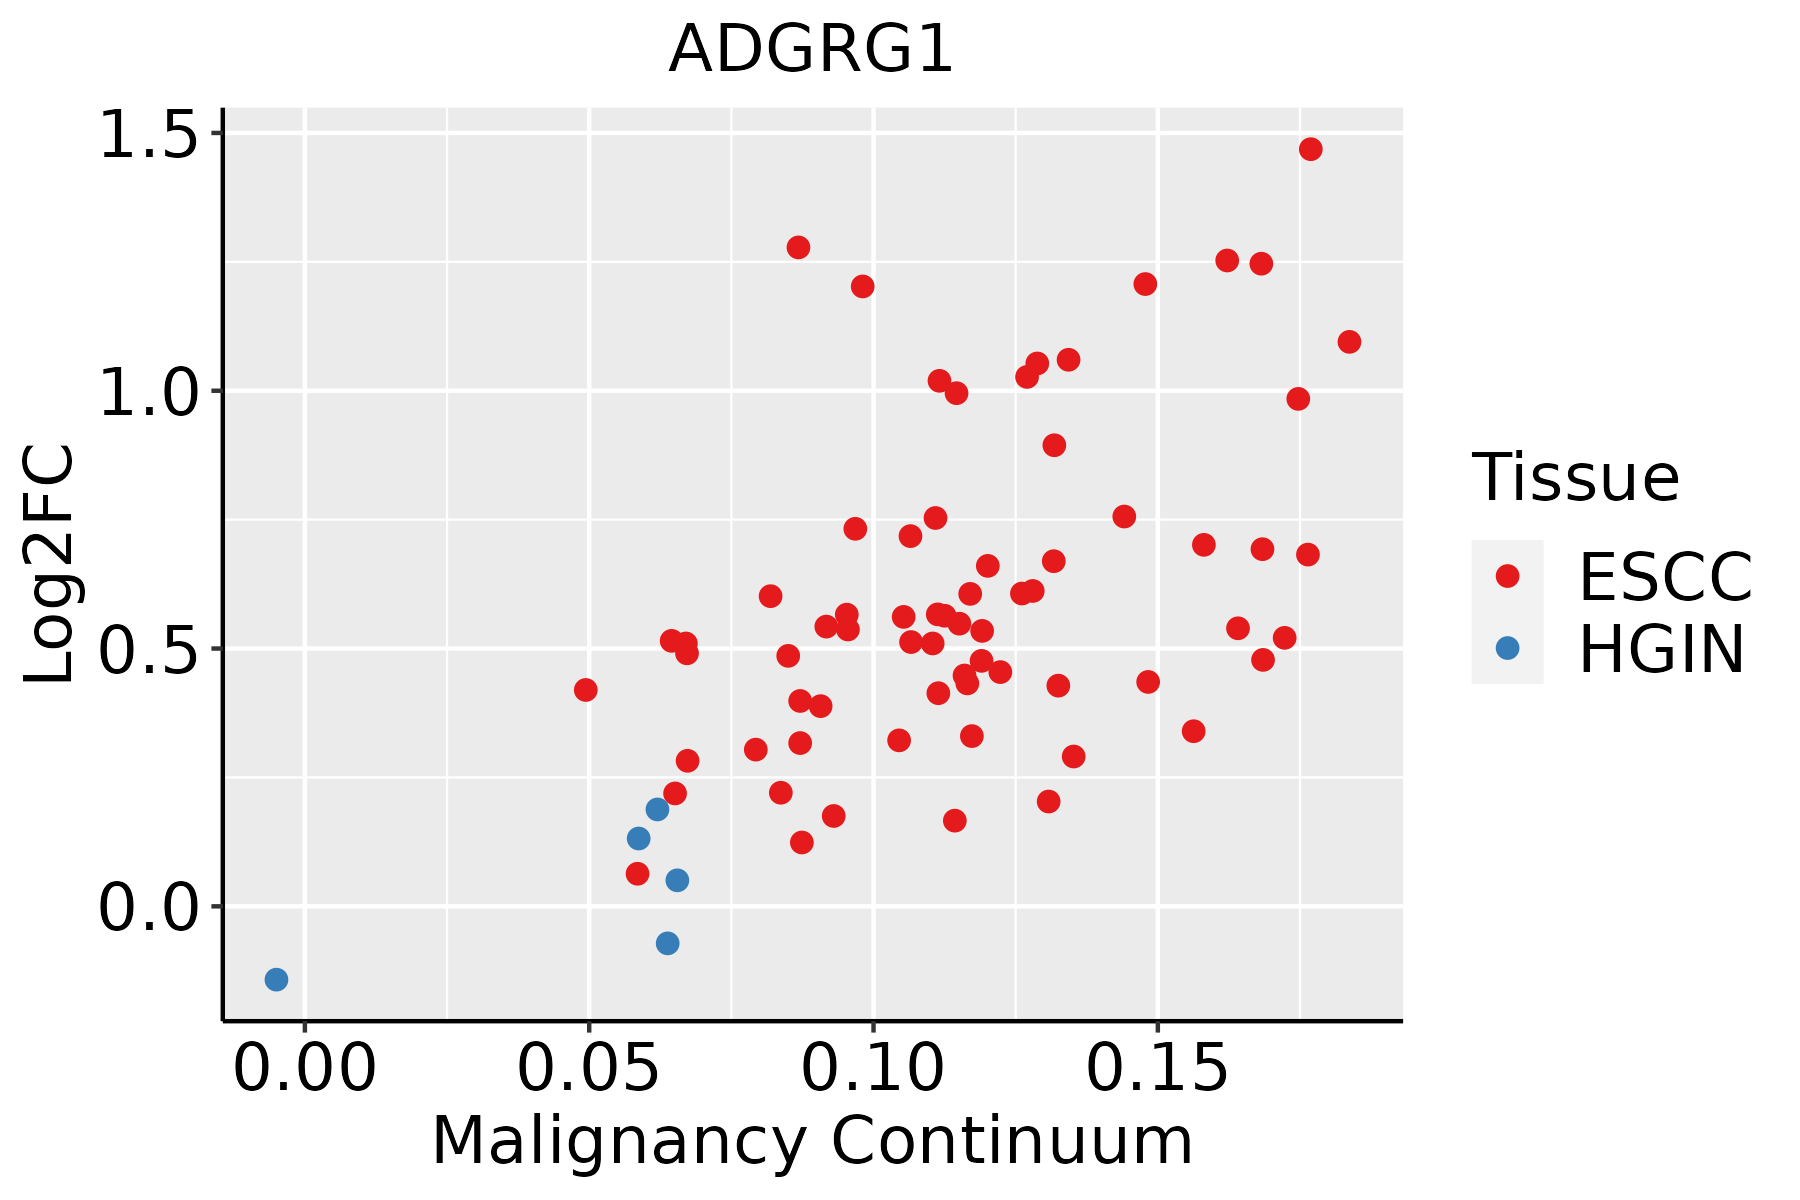 | ESCC: Esophageal squamous cell carcinoma |
| HGIN: High-grade intraepithelial neoplasias | ||
| LGIN: Low-grade intraepithelial neoplasias | ||
| Liver | 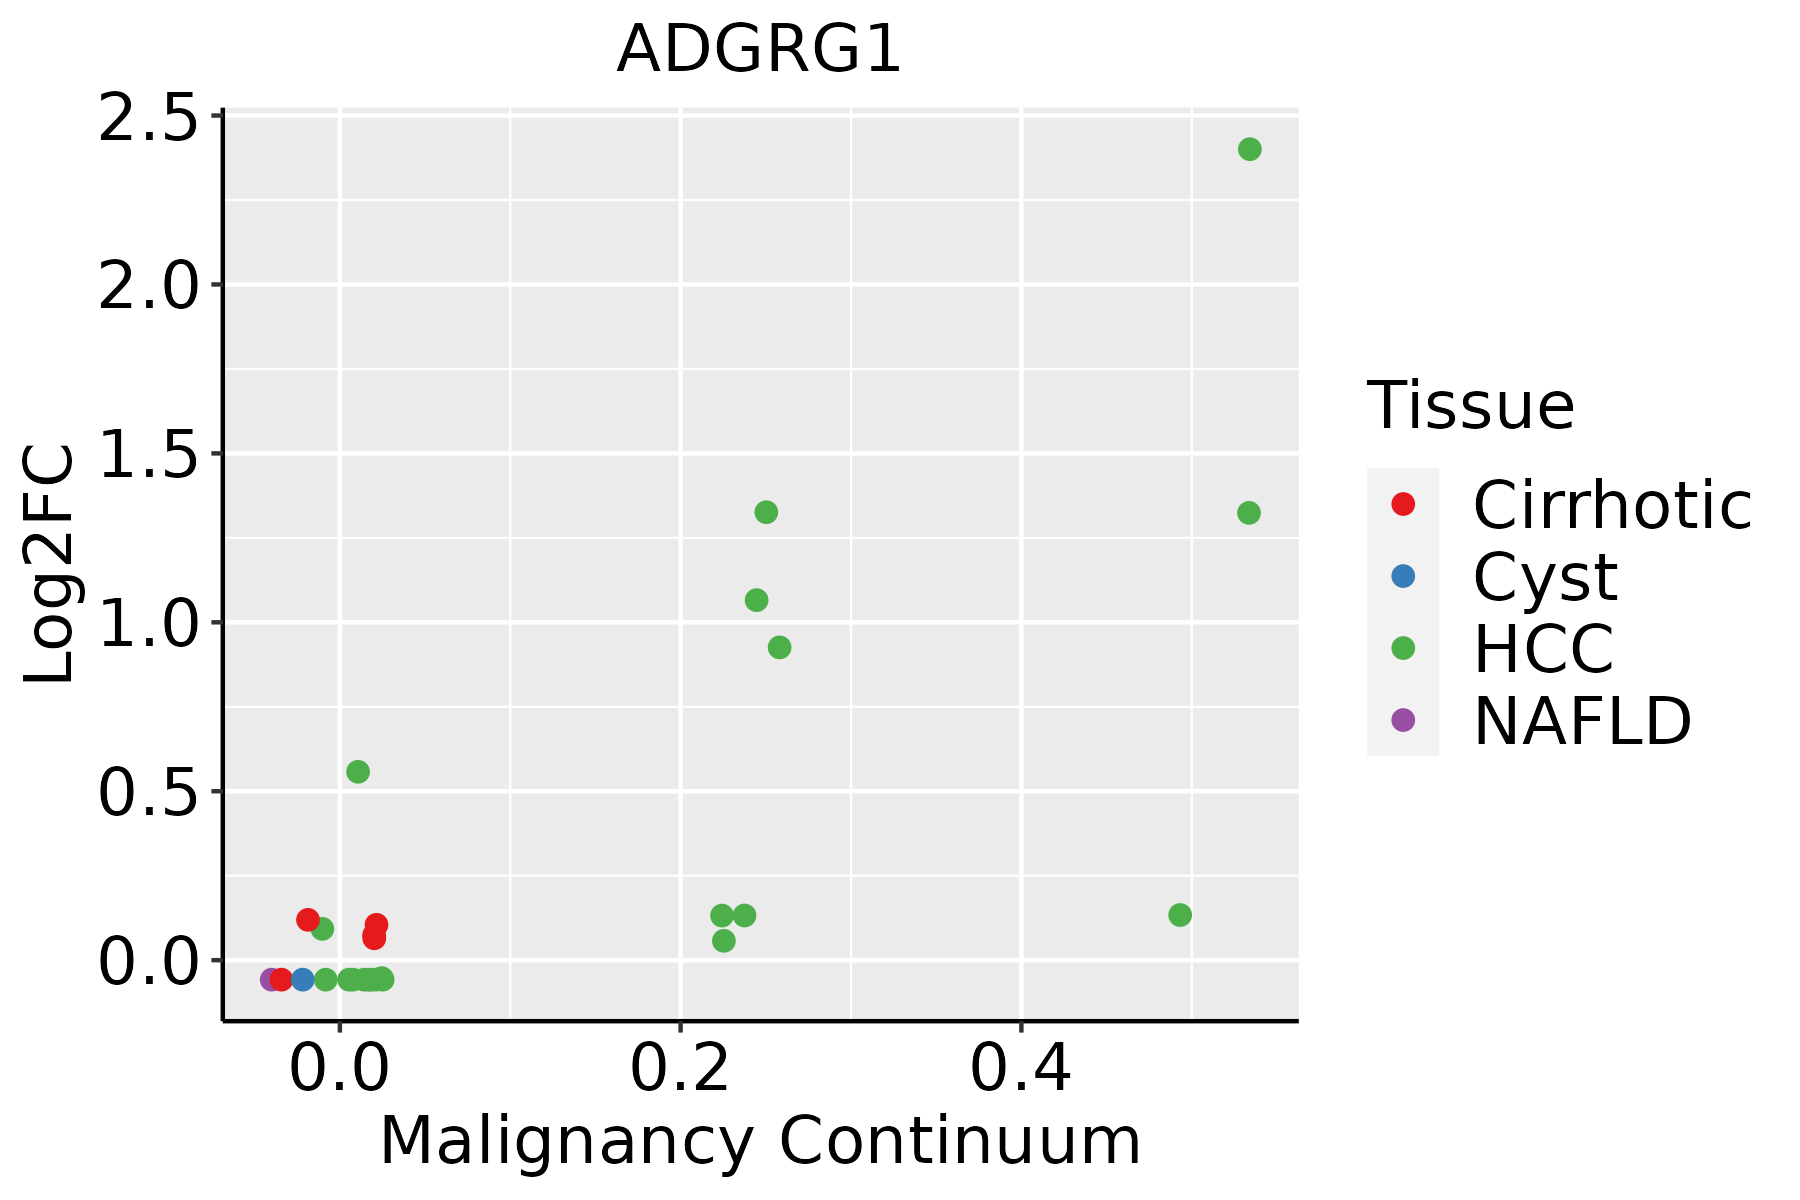 | HCC: Hepatocellular carcinoma |
| NAFLD: Non-alcoholic fatty liver disease | ||
| Oral Cavity | 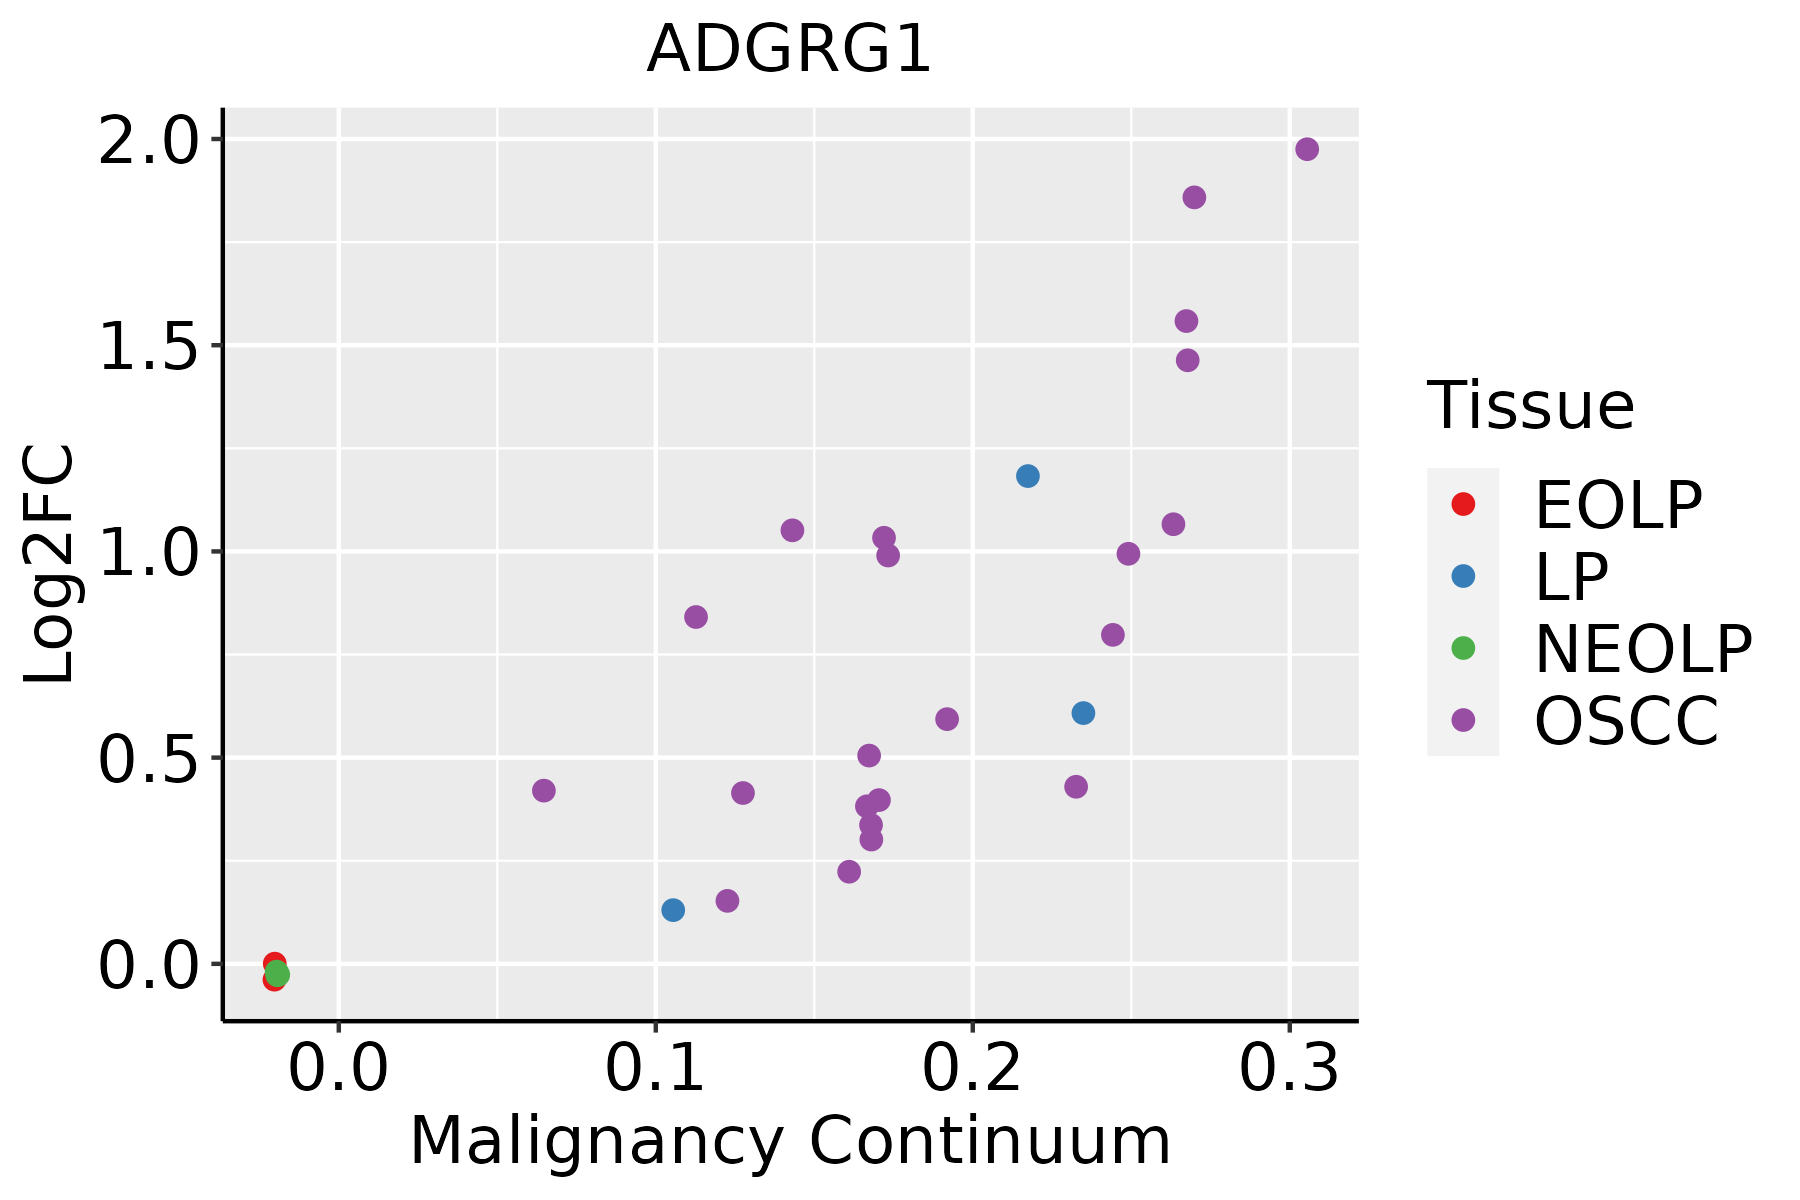 | EOLP: Erosive Oral lichen planus |
| LP: leukoplakia | ||
| NEOLP: Non-erosive oral lichen planus | ||
| OSCC: Oral squamous cell carcinoma | ||
| Thyroid | 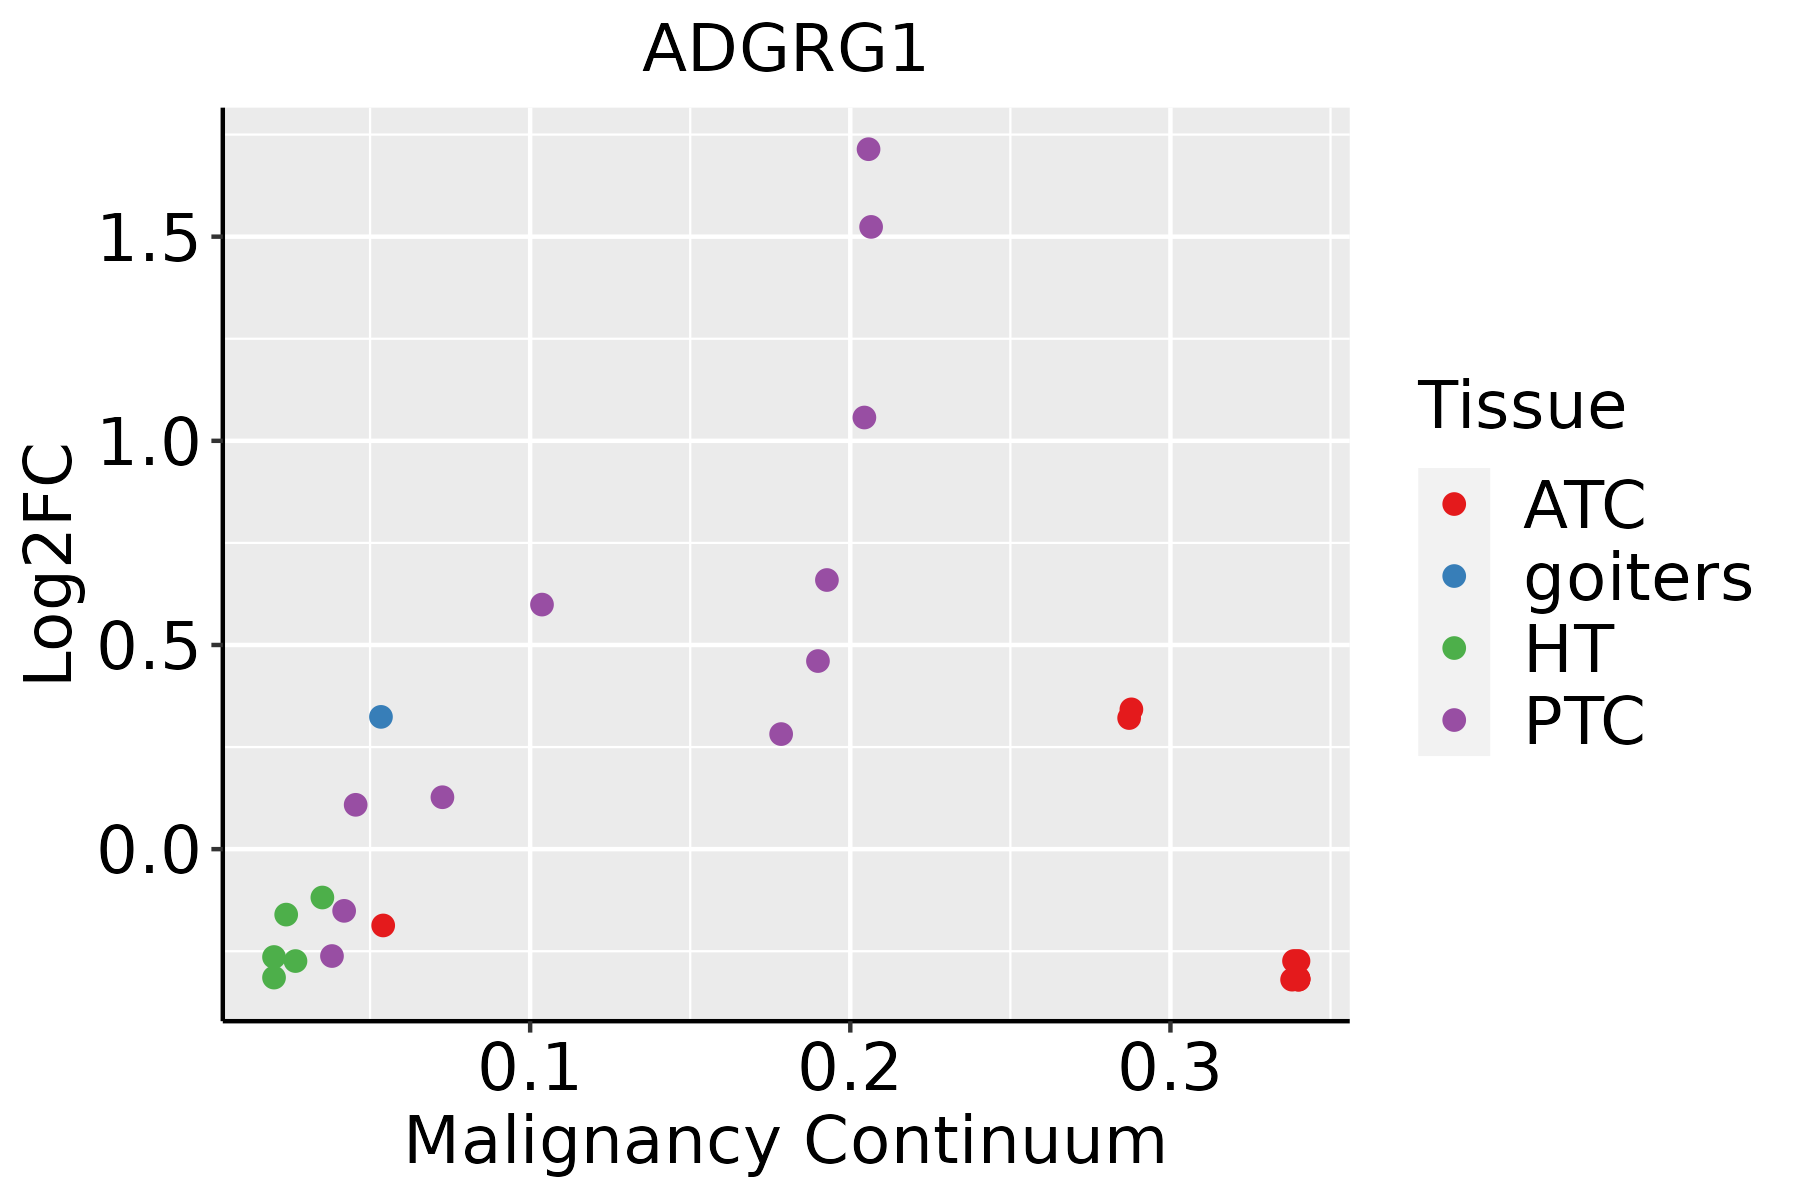 | ATC: Anaplastic thyroid cancer |
| HT: Hashimoto's thyroiditis | ||
| PTC: Papillary thyroid cancer |
| ∗log2FC in expression of this searched gene in stem-like cells from each diseased tissue sample relative to stem-like cells in normal samples in each tissue plotted against the malignancy continuum. Samples are colored based on if they are from different disease stage. |
Top |
Malignant transformation related pathway analysis |
| Find out the enriched GO biological processes and KEGG pathways involved in transition from healthy to precancer to cancer |
| Tissue | Disease Stage | Enriched GO biological Processes |
| Colorectum | AD |  |
| Colorectum | SER |  |
| Colorectum | MSS |  |
| Colorectum | MSI-H |  |
| Colorectum | FAP |  |
| ∗Top 15 enriched GO BP terms are showed in the bar plot of each disease state in each tissue. Each row represents a significant GO biological process which is colored according to the -log10(p.adjust). |
| Page: 1 2 3 4 5 6 7 8 9 |
| GO ID | Tissue | Disease Stage | Description | Gene Ratio | Bg Ratio | pvalue | p.adjust | Count |
| GO:0007265 | Colorectum | AD | Ras protein signal transduction | 104/3918 | 337/18723 | 1.01e-05 | 2.35e-04 | 104 |
| GO:0048872 | Colorectum | AD | homeostasis of number of cells | 87/3918 | 272/18723 | 1.16e-05 | 2.61e-04 | 87 |
| GO:0051056 | Colorectum | AD | regulation of small GTPase mediated signal transduction | 94/3918 | 302/18723 | 1.81e-05 | 3.76e-04 | 94 |
| GO:0045785 | Colorectum | AD | positive regulation of cell adhesion | 122/3918 | 437/18723 | 2.65e-04 | 3.28e-03 | 122 |
| GO:0061458 | Colorectum | AD | reproductive system development | 116/3918 | 427/18723 | 1.11e-03 | 1.01e-02 | 116 |
| GO:0048608 | Colorectum | AD | reproductive structure development | 114/3918 | 424/18723 | 1.78e-03 | 1.47e-02 | 114 |
| GO:0046578 | Colorectum | AD | regulation of Ras protein signal transduction | 56/3918 | 189/18723 | 2.85e-03 | 2.14e-02 | 56 |
| GO:0007266 | Colorectum | AD | Rho protein signal transduction | 42/3918 | 137/18723 | 4.64e-03 | 3.16e-02 | 42 |
| GO:00488721 | Colorectum | SER | homeostasis of number of cells | 65/2897 | 272/18723 | 1.70e-04 | 3.19e-03 | 65 |
| GO:00457851 | Colorectum | SER | positive regulation of cell adhesion | 93/2897 | 437/18723 | 6.78e-04 | 9.04e-03 | 93 |
| GO:00614581 | Colorectum | SER | reproductive system development | 87/2897 | 427/18723 | 3.69e-03 | 3.07e-02 | 87 |
| GO:00486081 | Colorectum | SER | reproductive structure development | 85/2897 | 424/18723 | 6.33e-03 | 4.56e-02 | 85 |
| GO:00488722 | Colorectum | MSS | homeostasis of number of cells | 82/3467 | 272/18723 | 2.02e-06 | 6.28e-05 | 82 |
| GO:00614582 | Colorectum | MSS | reproductive system development | 115/3467 | 427/18723 | 9.86e-06 | 2.39e-04 | 115 |
| GO:00486082 | Colorectum | MSS | reproductive structure development | 113/3467 | 424/18723 | 1.94e-05 | 4.18e-04 | 113 |
| GO:00072651 | Colorectum | MSS | Ras protein signal transduction | 91/3467 | 337/18723 | 7.20e-05 | 1.21e-03 | 91 |
| GO:00510561 | Colorectum | MSS | regulation of small GTPase mediated signal transduction | 82/3467 | 302/18723 | 1.31e-04 | 1.99e-03 | 82 |
| GO:00457852 | Colorectum | MSS | positive regulation of cell adhesion | 110/3467 | 437/18723 | 2.94e-04 | 3.87e-03 | 110 |
| GO:004887227 | Esophagus | HGIN | homeostasis of number of cells | 54/2587 | 272/18723 | 3.50e-03 | 3.23e-02 | 54 |
| GO:006145819 | Esophagus | HGIN | reproductive system development | 78/2587 | 427/18723 | 5.53e-03 | 4.52e-02 | 78 |
| Page: 1 2 3 4 5 6 7 |
| Pathway ID | Tissue | Disease Stage | Description | Gene Ratio | Bg Ratio | pvalue | p.adjust | qvalue | Count |
| Page: 1 |
Top |
Cell-cell communication analysis |
| Identification of potential cell-cell interactions between two cell types and their ligand-receptor pairs for different disease states |
| Ligand | Receptor | LRpair | Pathway | Tissue | Disease Stage |
| Page: 1 |
Top |
Single-cell gene regulatory network inference analysis |
| Find out the significant the regulons (TFs) and the target genes of each regulon across cell types for different disease states |
| TF | Cell Type | Tissue | Disease Stage | Target Gene | RSS | Regulon Activity |
| ∗The dot plots of a searched regulon are shown for all cell subpopulations in each disease state of each tissue based on the regulon specific score inferred using pySCENIC and by calculating the average expression. |
| Page: 1 |
Top |
Somatic mutation of malignant transformation related genes |
| Annotation of somatic variants for genes involved in malignant transformation |
| Hugo Symbol | Variant Class | Variant Classification | dbSNP RS | HGVSc | HGVSp | HGVSp Short | SWISSPROT | BIOTYPE | SIFT | PolyPhen | Tumor Sample Barcode | Tissue | Histology | Sex | Age | Stage | Therapy Types | Drugs | Outcome |
| ADGRG1 | SNV | Missense_Mutation | c.1197N>A | p.His399Gln | p.H399Q | Q9Y653 | protein_coding | deleterious(0) | possibly_damaging(0.905) | TCGA-A2-A0EX-01 | Breast | breast invasive carcinoma | Female | <65 | I/II | Hormone Therapy | tamoxiphen | SD | |
| ADGRG1 | insertion | Frame_Shift_Ins | novel | c.250_251insAGATCATGAAGACTGGGCTTTGCTCACAGGCACTGGGGAG | p.Pro84GlnfsTer39 | p.P84Qfs*39 | Q9Y653 | protein_coding | TCGA-A2-A04R-01 | Breast | breast invasive carcinoma | Female | <65 | I/II | Chemotherapy | taxol | SD | ||
| ADGRG1 | insertion | Nonsense_Mutation | novel | c.348_349insCCACAGGCATACACCGCCATGCCTGGCTAATTTTGTTTATTTATTG | p.Ser117ProfsTer10 | p.S117Pfs*10 | Q9Y653 | protein_coding | TCGA-B6-A0IM-01 | Breast | breast invasive carcinoma | Female | >=65 | I/II | Unknown | Unknown | SD | ||
| ADGRG1 | deletion | Frame_Shift_Del | c.1804delC | p.His602ThrfsTer9 | p.H602Tfs*9 | Q9Y653 | protein_coding | TCGA-EW-A2FV-01 | Breast | breast invasive carcinoma | Female | <65 | III/IV | Chemotherapy | docetaxel | SD | |||
| ADGRG1 | SNV | Missense_Mutation | novel | c.1355C>T | p.Ala452Val | p.A452V | Q9Y653 | protein_coding | deleterious(0) | possibly_damaging(0.784) | TCGA-2W-A8YY-01 | Cervix | cervical & endocervical cancer | Female | <65 | I/II | Chemotherapy | cisplatin | CR |
| ADGRG1 | SNV | Missense_Mutation | rs751829617 | c.1561G>A | p.Ala521Thr | p.A521T | Q9Y653 | protein_coding | deleterious(0.04) | benign(0.007) | TCGA-2W-A8YY-01 | Cervix | cervical & endocervical cancer | Female | <65 | I/II | Chemotherapy | cisplatin | CR |
| ADGRG1 | SNV | Missense_Mutation | novel | c.853N>A | p.Glu285Lys | p.E285K | Q9Y653 | protein_coding | tolerated(0.11) | benign(0.115) | TCGA-VS-A958-01 | Cervix | cervical & endocervical cancer | Female | <65 | I/II | Chemotherapy | cisplatin | CR |
| ADGRG1 | SNV | Missense_Mutation | novel | c.1660G>A | p.Glu554Lys | p.E554K | Q9Y653 | protein_coding | tolerated(0.35) | benign(0.074) | TCGA-VS-A9UZ-01 | Cervix | cervical & endocervical cancer | Female | <65 | I/II | Unknown | Unknown | SD |
| ADGRG1 | SNV | Missense_Mutation | rs770060105 | c.1175N>T | p.Ser392Leu | p.S392L | Q9Y653 | protein_coding | deleterious(0) | benign(0.349) | TCGA-AA-3864-01 | Colorectum | colon adenocarcinoma | Male | >=65 | I/II | Unknown | Unknown | SD |
| ADGRG1 | SNV | Missense_Mutation | c.1349N>C | p.Leu450Pro | p.L450P | Q9Y653 | protein_coding | deleterious(0) | probably_damaging(1) | TCGA-AY-6197-01 | Colorectum | colon adenocarcinoma | Male | <65 | I/II | Unknown | Unknown | SD |
| Page: 1 2 3 4 5 |
Top |
Related drugs of malignant transformation related genes |
| Identification of chemicals and drugs interact with genes involved in malignant transfromation |
| (DGIdb 4.0) |
| Entrez ID | Symbol | Category | Interaction Types | Drug Claim Name | Drug Name | PMIDs |
| Page: 1 |

Copyright 2023-Present -The University of Texas Health Science Center at Houston |