
|
|||||
|
 | |
| |
| |
| |
| |
| |
|
Gene: ADGRF5 |
Gene summary for ADGRF5 |
| Gene information | Species | Human | Gene symbol | ADGRF5 | Gene ID | 221395 |
| Gene name | adhesion G protein-coupled receptor F5 | |
| Gene Alias | GPR116 | |
| Cytomap | 6p12.3 | |
| Gene Type | protein-coding | GO ID | GO:0001568 | UniProtAcc | Q8IZF2 |
Top |
Malignant transformation analysis |
| Identification of the aberrant gene expression in precancerous and cancerous lesions by comparing the gene expression of stem-like cells in diseased tissues with normal stem cells |
| Entrez ID | Symbol | Replicates | Species | Organ | Tissue | Adj P-value | Log2FC | Malignancy |
| 221395 | ADGRF5 | TD9 | Human | Lung | IAC | 5.82e-06 | -9.40e-02 | 0.088 |
| 221395 | ADGRF5 | RNA-P17T-P17T-2 | Human | Lung | IAC | 1.53e-11 | -3.57e-01 | 0.3371 |
| 221395 | ADGRF5 | RNA-P17T-P17T-4 | Human | Lung | IAC | 1.03e-13 | -3.84e-01 | 0.343 |
| 221395 | ADGRF5 | RNA-P17T-P17T-6 | Human | Lung | IAC | 2.82e-07 | -4.46e-01 | 0.3385 |
| 221395 | ADGRF5 | RNA-P17T-P17T-8 | Human | Lung | IAC | 5.43e-06 | -5.07e-01 | 0.3329 |
| 221395 | ADGRF5 | RNA-P25T1-P25T1-1 | Human | Lung | AIS | 3.45e-13 | 3.14e-01 | -0.2116 |
| 221395 | ADGRF5 | RNA-P25T1-P25T1-2 | Human | Lung | AIS | 2.59e-02 | 2.04e-01 | -0.1941 |
| 221395 | ADGRF5 | RNA-P25T1-P25T1-3 | Human | Lung | AIS | 2.66e-05 | 1.74e-01 | -0.2107 |
| 221395 | ADGRF5 | RNA-P25T1-P25T1-4 | Human | Lung | AIS | 9.29e-16 | 3.14e-01 | -0.2119 |
| 221395 | ADGRF5 | RNA-P3T-P3T-1 | Human | Lung | IAC | 1.61e-04 | -1.01e+00 | 0.1829 |
| 221395 | ADGRF5 | RNA-P3T-P3T-2 | Human | Lung | IAC | 1.09e-04 | -9.86e-01 | 0.1835 |
| 221395 | ADGRF5 | RNA-P3T-P3T-4 | Human | Lung | IAC | 2.95e-05 | -9.51e-01 | 0.1859 |
| 221395 | ADGRF5 | RNA-P6T1-P6T1-1 | Human | Lung | MIAC | 1.72e-02 | -2.39e-02 | -0.0238 |
| 221395 | ADGRF5 | RNA-P6T1-P6T1-3 | Human | Lung | MIAC | 8.17e-04 | 3.49e-01 | -0.0296 |
| 221395 | ADGRF5 | RNA-P6T1-P6T1-4 | Human | Lung | MIAC | 6.66e-03 | 7.04e-02 | -0.0263 |
| 221395 | ADGRF5 | RNA-P6T2-P6T2-1 | Human | Lung | IAC | 2.14e-17 | 3.85e-01 | -0.0166 |
| 221395 | ADGRF5 | RNA-P6T2-P6T2-2 | Human | Lung | IAC | 1.36e-25 | 3.92e-01 | -0.0132 |
| 221395 | ADGRF5 | RNA-P6T2-P6T2-3 | Human | Lung | IAC | 2.96e-23 | 3.86e-01 | -0.013 |
| 221395 | ADGRF5 | RNA-P6T2-P6T2-4 | Human | Lung | IAC | 3.52e-19 | 3.31e-01 | -0.0121 |
| 221395 | ADGRF5 | RNA-P7T1-P7T1-1 | Human | Lung | AIS | 3.23e-05 | 3.29e-01 | -0.0961 |
| Page: 1 2 |
| Tissue | Expression Dynamics | Abbreviation |
| Lung | 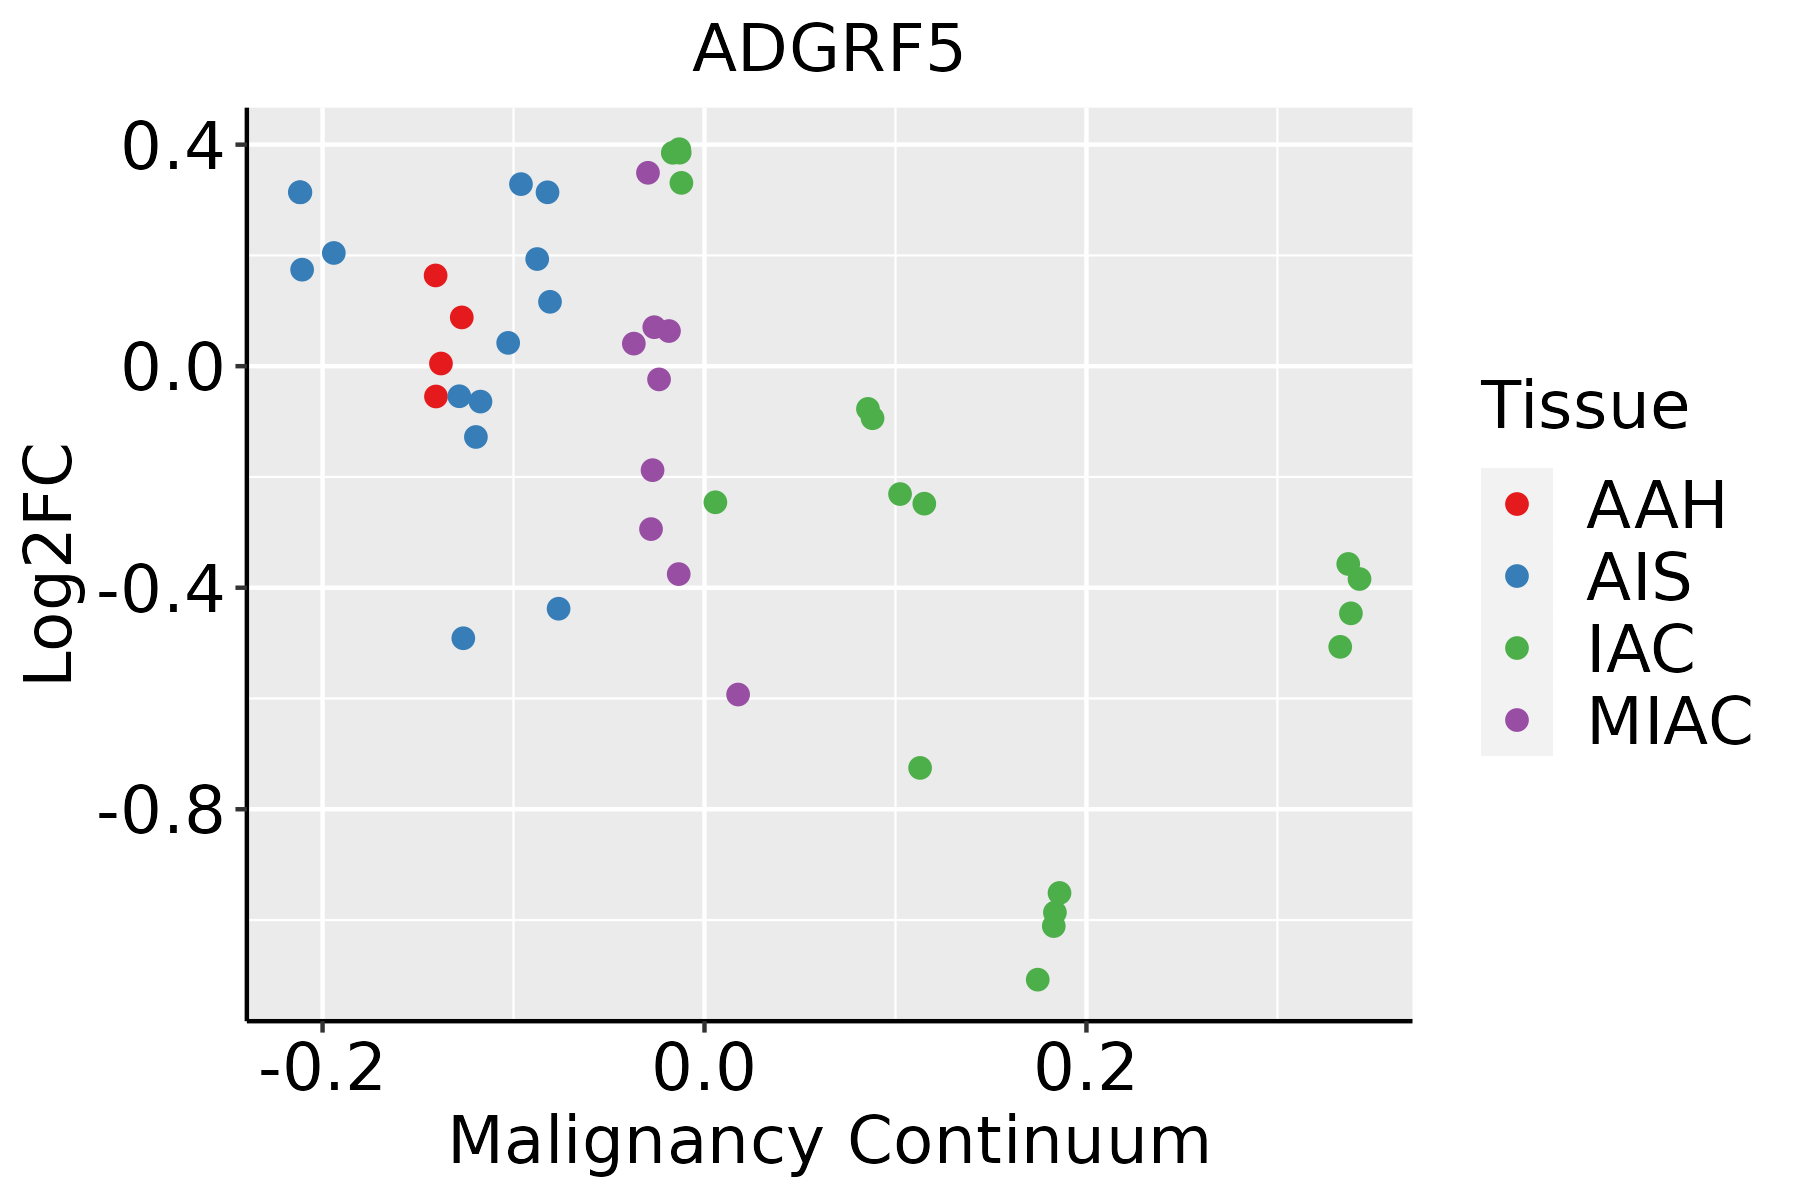 | AAH: Atypical adenomatous hyperplasia |
| AIS: Adenocarcinoma in situ | ||
| IAC: Invasive lung adenocarcinoma | ||
| MIA: Minimally invasive adenocarcinoma | ||
| Thyroid |  | ATC: Anaplastic thyroid cancer |
| HT: Hashimoto's thyroiditis | ||
| PTC: Papillary thyroid cancer |
| ∗log2FC in expression of this searched gene in stem-like cells from each diseased tissue sample relative to stem-like cells in normal samples in each tissue plotted against the malignancy continuum. Samples are colored based on if they are from different disease stage. |
Top |
Malignant transformation related pathway analysis |
| Find out the enriched GO biological processes and KEGG pathways involved in transition from healthy to precancer to cancer |
| Tissue | Disease Stage | Enriched GO biological Processes |
| Colorectum | AD |  |
| Colorectum | SER |  |
| Colorectum | MSS |  |
| Colorectum | MSI-H |  |
| Colorectum | FAP |  |
| ∗Top 15 enriched GO BP terms are showed in the bar plot of each disease state in each tissue. Each row represents a significant GO biological process which is colored according to the -log10(p.adjust). |
| Page: 1 2 3 4 5 6 7 8 9 |
| GO ID | Tissue | Disease Stage | Description | Gene Ratio | Bg Ratio | pvalue | p.adjust | Count |
| GO:0048875 | Lung | IAC | chemical homeostasis within a tissue | 11/2061 | 14/18723 | 7.44e-09 | 1.05e-06 | 11 |
| GO:0043129 | Lung | IAC | surfactant homeostasis | 10/2061 | 12/18723 | 1.37e-08 | 1.77e-06 | 10 |
| GO:00341018 | Lung | IAC | erythrocyte homeostasis | 34/2061 | 129/18723 | 8.85e-07 | 4.95e-05 | 34 |
| GO:00302188 | Lung | IAC | erythrocyte differentiation | 32/2061 | 120/18723 | 1.39e-06 | 7.05e-05 | 32 |
| GO:00022628 | Lung | IAC | myeloid cell homeostasis | 37/2061 | 157/18723 | 5.42e-06 | 2.09e-04 | 37 |
| GO:00300998 | Lung | IAC | myeloid cell differentiation | 70/2061 | 381/18723 | 1.12e-05 | 3.45e-04 | 70 |
| GO:00488728 | Lung | IAC | homeostasis of number of cells | 54/2061 | 272/18723 | 1.20e-05 | 3.64e-04 | 54 |
| GO:00454443 | Lung | IAC | fat cell differentiation | 42/2061 | 229/18723 | 6.19e-04 | 8.50e-03 | 42 |
| GO:00018947 | Lung | IAC | tissue homeostasis | 46/2061 | 268/18723 | 1.50e-03 | 1.60e-02 | 46 |
| GO:00602497 | Lung | IAC | anatomical structure homeostasis | 51/2061 | 314/18723 | 2.91e-03 | 2.61e-02 | 51 |
| GO:00488751 | Lung | AIS | chemical homeostasis within a tissue | 9/1849 | 14/18723 | 1.11e-06 | 7.51e-05 | 9 |
| GO:00431291 | Lung | AIS | surfactant homeostasis | 8/1849 | 12/18723 | 3.07e-06 | 1.64e-04 | 8 |
| GO:003410113 | Lung | AIS | erythrocyte homeostasis | 30/1849 | 129/18723 | 6.51e-06 | 2.92e-04 | 30 |
| GO:003021813 | Lung | AIS | erythrocyte differentiation | 28/1849 | 120/18723 | 1.22e-05 | 4.71e-04 | 28 |
| GO:003009913 | Lung | AIS | myeloid cell differentiation | 63/1849 | 381/18723 | 3.05e-05 | 9.70e-04 | 63 |
| GO:000226213 | Lung | AIS | myeloid cell homeostasis | 32/1849 | 157/18723 | 5.57e-05 | 1.57e-03 | 32 |
| GO:004887213 | Lung | AIS | homeostasis of number of cells | 47/1849 | 272/18723 | 1.03e-04 | 2.50e-03 | 47 |
| GO:004544411 | Lung | AIS | fat cell differentiation | 37/1849 | 229/18723 | 1.88e-03 | 2.08e-02 | 37 |
| GO:000189412 | Lung | AIS | tissue homeostasis | 41/1849 | 268/18723 | 3.13e-03 | 3.01e-02 | 41 |
| GO:00431293 | Lung | MIAC | surfactant homeostasis | 6/967 | 12/18723 | 1.32e-05 | 9.85e-04 | 6 |
| Page: 1 2 |
| Pathway ID | Tissue | Disease Stage | Description | Gene Ratio | Bg Ratio | pvalue | p.adjust | qvalue | Count |
| Page: 1 |
Top |
Cell-cell communication analysis |
| Identification of potential cell-cell interactions between two cell types and their ligand-receptor pairs for different disease states |
| Ligand | Receptor | LRpair | Pathway | Tissue | Disease Stage |
| Page: 1 |
Top |
Single-cell gene regulatory network inference analysis |
| Find out the significant the regulons (TFs) and the target genes of each regulon across cell types for different disease states |
| TF | Cell Type | Tissue | Disease Stage | Target Gene | RSS | Regulon Activity |
| ∗The dot plots of a searched regulon are shown for all cell subpopulations in each disease state of each tissue based on the regulon specific score inferred using pySCENIC and by calculating the average expression. |
| Page: 1 |
Top |
Somatic mutation of malignant transformation related genes |
| Annotation of somatic variants for genes involved in malignant transformation |
| Hugo Symbol | Variant Class | Variant Classification | dbSNP RS | HGVSc | HGVSp | HGVSp Short | SWISSPROT | BIOTYPE | SIFT | PolyPhen | Tumor Sample Barcode | Tissue | Histology | Sex | Age | Stage | Therapy Types | Drugs | Outcome |
| ADGRF5 | SNV | Missense_Mutation | rs369061339 | c.2216C>T | p.Pro739Leu | p.P739L | Q8IZF2 | protein_coding | deleterious(0.02) | probably_damaging(0.999) | TCGA-A8-A07L-01 | Breast | breast invasive carcinoma | Female | <65 | III/IV | Chemotherapy | CR | |
| ADGRF5 | SNV | Missense_Mutation | rs146250899 | c.1030G>A | p.Asp344Asn | p.D344N | Q8IZF2 | protein_coding | deleterious(0.04) | probably_damaging(0.964) | TCGA-AC-A23H-01 | Breast | breast invasive carcinoma | Female | >=65 | I/II | Unknown | Unknown | PD |
| ADGRF5 | SNV | Missense_Mutation | c.3129G>T | p.Lys1043Asn | p.K1043N | Q8IZF2 | protein_coding | tolerated(0.55) | possibly_damaging(0.52) | TCGA-AN-A046-01 | Breast | breast invasive carcinoma | Female | >=65 | I/II | Unknown | Unknown | SD | |
| ADGRF5 | SNV | Missense_Mutation | c.2836A>G | p.Ser946Gly | p.S946G | Q8IZF2 | protein_coding | deleterious(0.03) | benign(0.01) | TCGA-BH-A0C7-01 | Breast | breast invasive carcinoma | Female | <65 | I/II | Chemotherapy | adriamycin | CR | |
| ADGRF5 | SNV | Missense_Mutation | c.3148N>T | p.Arg1050Cys | p.R1050C | Q8IZF2 | protein_coding | deleterious(0) | probably_damaging(0.999) | TCGA-E9-A3QA-01 | Breast | breast invasive carcinoma | Female | <65 | I/II | Unknown | Unknown | SD | |
| ADGRF5 | SNV | Missense_Mutation | c.2227N>A | p.Glu743Lys | p.E743K | Q8IZF2 | protein_coding | tolerated(0.52) | benign(0) | TCGA-EW-A1J5-01 | Breast | breast invasive carcinoma | Female | <65 | I/II | Chemotherapy | adriamycin | SD | |
| ADGRF5 | SNV | Missense_Mutation | c.919G>C | p.Glu307Gln | p.E307Q | Q8IZF2 | protein_coding | tolerated(0.32) | benign(0.038) | TCGA-GM-A2D9-01 | Breast | breast invasive carcinoma | Female | >=65 | I/II | Hormone Therapy | arimidex | SD | |
| ADGRF5 | SNV | Missense_Mutation | c.1981N>G | p.Leu661Val | p.L661V | Q8IZF2 | protein_coding | tolerated(0.11) | benign(0.02) | TCGA-LD-A74U-01 | Breast | breast invasive carcinoma | Female | >=65 | III/IV | Chemotherapy | taxotere | SD | |
| ADGRF5 | SNV | Missense_Mutation | novel | c.2767N>C | p.Val923Leu | p.V923L | Q8IZF2 | protein_coding | tolerated(0.36) | benign(0.255) | TCGA-LL-A5YO-01 | Breast | breast invasive carcinoma | Female | <65 | I/II | Chemotherapy | taxotere | CR |
| ADGRF5 | insertion | Frame_Shift_Ins | novel | c.1876_1877insCTTTGTTCTTCTCCTCTTTCTTTATACCAAATATGGTTTCG | p.Phe626SerfsTer46 | p.F626Sfs*46 | Q8IZF2 | protein_coding | TCGA-A8-A07J-01 | Breast | breast invasive carcinoma | Female | <65 | I/II | Chemotherapy | 5-fluorouracil | CR |
| Page: 1 2 3 4 5 6 7 8 9 10 11 12 13 14 15 |
Top |
Related drugs of malignant transformation related genes |
| Identification of chemicals and drugs interact with genes involved in malignant transfromation |
| (DGIdb 4.0) |
| Entrez ID | Symbol | Category | Interaction Types | Drug Claim Name | Drug Name | PMIDs |
| Page: 1 |

Copyright 2023-Present -The University of Texas Health Science Center at Houston |