
|
|||||
|
 | |
| |
| |
| |
| |
| |
|
Gene: ADGRF4 |
Gene summary for ADGRF4 |
| Gene information | Species | Human | Gene symbol | ADGRF4 | Gene ID | 221393 |
| Gene name | adhesion G protein-coupled receptor F4 | |
| Gene Alias | GPR115 | |
| Cytomap | 6p12.3 | |
| Gene Type | protein-coding | GO ID | GO:0007154 | UniProtAcc | Q8IZF3 |
Top |
Malignant transformation analysis |
| Identification of the aberrant gene expression in precancerous and cancerous lesions by comparing the gene expression of stem-like cells in diseased tissues with normal stem cells |
| Entrez ID | Symbol | Replicates | Species | Organ | Tissue | Adj P-value | Log2FC | Malignancy |
| 221393 | ADGRF4 | P31T-E | Human | Esophagus | ESCC | 6.19e-03 | 1.47e-01 | 0.1251 |
| 221393 | ADGRF4 | P37T-E | Human | Esophagus | ESCC | 2.67e-02 | 6.23e-02 | 0.1371 |
| 221393 | ADGRF4 | P44T-E | Human | Esophagus | ESCC | 6.06e-03 | 1.59e-01 | 0.1096 |
| 221393 | ADGRF4 | P47T-E | Human | Esophagus | ESCC | 8.35e-04 | 9.76e-02 | 0.1067 |
| 221393 | ADGRF4 | P49T-E | Human | Esophagus | ESCC | 2.63e-03 | 5.04e-01 | 0.1768 |
| 221393 | ADGRF4 | P61T-E | Human | Esophagus | ESCC | 3.13e-02 | 1.86e-01 | 0.099 |
| 221393 | ADGRF4 | P62T-E | Human | Esophagus | ESCC | 2.51e-02 | 1.10e-01 | 0.1302 |
| 221393 | ADGRF4 | P65T-E | Human | Esophagus | ESCC | 1.48e-02 | 1.16e-01 | 0.0978 |
| 221393 | ADGRF4 | P75T-E | Human | Esophagus | ESCC | 2.55e-04 | 1.43e-01 | 0.1125 |
| 221393 | ADGRF4 | P80T-E | Human | Esophagus | ESCC | 5.61e-27 | 1.00e+00 | 0.155 |
| 221393 | ADGRF4 | P130T-E | Human | Esophagus | ESCC | 8.86e-18 | 4.12e-01 | 0.1676 |
| Page: 1 |
| Tissue | Expression Dynamics | Abbreviation |
| Esophagus | 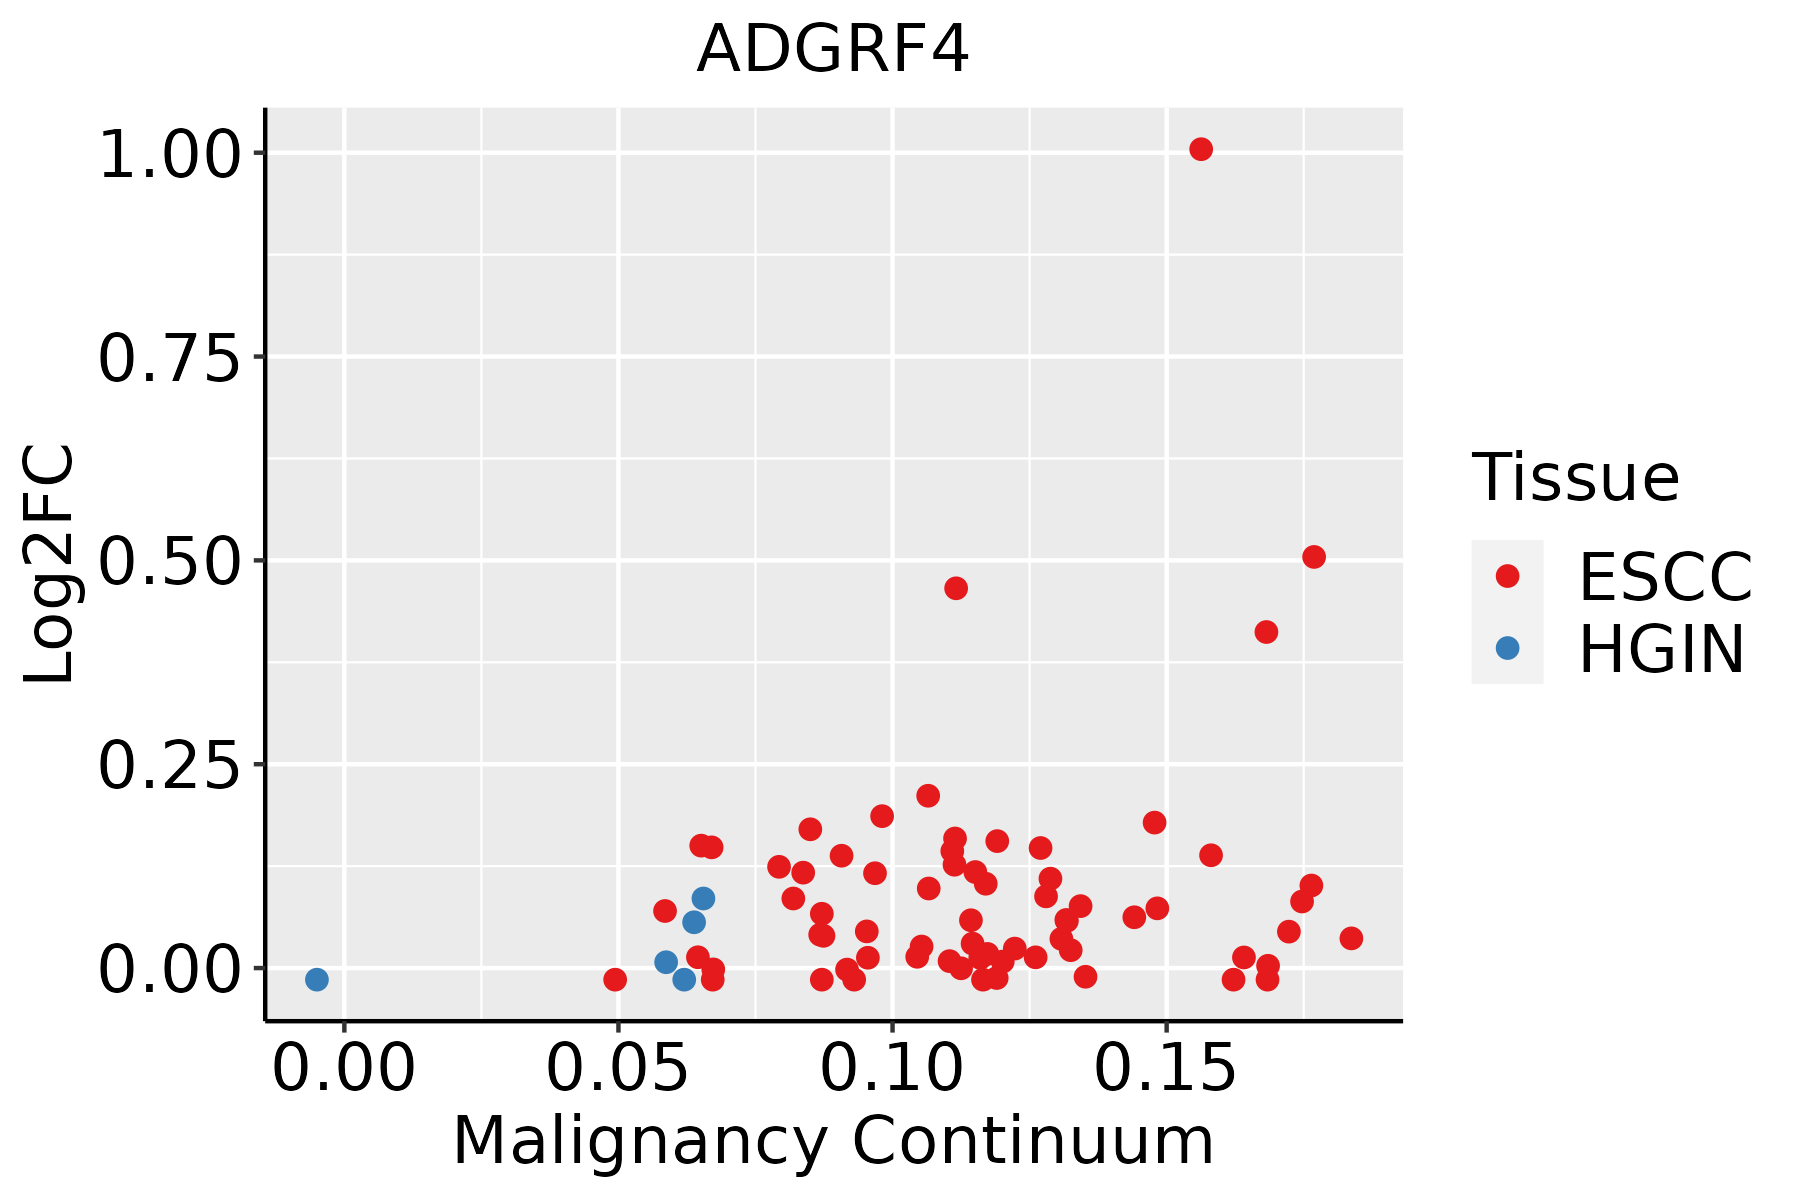 | ESCC: Esophageal squamous cell carcinoma |
| HGIN: High-grade intraepithelial neoplasias | ||
| LGIN: Low-grade intraepithelial neoplasias |
| ∗log2FC in expression of this searched gene in stem-like cells from each diseased tissue sample relative to stem-like cells in normal samples in each tissue plotted against the malignancy continuum. Samples are colored based on if they are from different disease stage. |
Top |
Malignant transformation related pathway analysis |
| Find out the enriched GO biological processes and KEGG pathways involved in transition from healthy to precancer to cancer |
| Tissue | Disease Stage | Enriched GO biological Processes |
| Colorectum | AD |  |
| Colorectum | SER |  |
| Colorectum | MSS |  |
| Colorectum | MSI-H |  |
| Colorectum | FAP |  |
| ∗Top 15 enriched GO BP terms are showed in the bar plot of each disease state in each tissue. Each row represents a significant GO biological process which is colored according to the -log10(p.adjust). |
| Page: 1 2 3 4 5 6 7 8 9 |
| GO ID | Tissue | Disease Stage | Description | Gene Ratio | Bg Ratio | pvalue | p.adjust | Count |
| Page: 1 |
| Pathway ID | Tissue | Disease Stage | Description | Gene Ratio | Bg Ratio | pvalue | p.adjust | qvalue | Count |
| Page: 1 |
Top |
Cell-cell communication analysis |
| Identification of potential cell-cell interactions between two cell types and their ligand-receptor pairs for different disease states |
| Ligand | Receptor | LRpair | Pathway | Tissue | Disease Stage |
| Page: 1 |
Top |
Single-cell gene regulatory network inference analysis |
| Find out the significant the regulons (TFs) and the target genes of each regulon across cell types for different disease states |
| TF | Cell Type | Tissue | Disease Stage | Target Gene | RSS | Regulon Activity |
| ∗The dot plots of a searched regulon are shown for all cell subpopulations in each disease state of each tissue based on the regulon specific score inferred using pySCENIC and by calculating the average expression. |
| Page: 1 |
Top |
Somatic mutation of malignant transformation related genes |
| Annotation of somatic variants for genes involved in malignant transformation |
| Hugo Symbol | Variant Class | Variant Classification | dbSNP RS | HGVSc | HGVSp | HGVSp Short | SWISSPROT | BIOTYPE | SIFT | PolyPhen | Tumor Sample Barcode | Tissue | Histology | Sex | Age | Stage | Therapy Types | Drugs | Outcome |
| ADGRF4 | SNV | Missense_Mutation | c.2072T>C | p.Met691Thr | p.M691T | Q8IZF3 | protein_coding | deleterious_low_confidence(0) | benign(0.08) | TCGA-D8-A1JK-01 | Breast | breast invasive carcinoma | Female | >=65 | I/II | Unknown | Unknown | SD | |
| ADGRF4 | insertion | Frame_Shift_Ins | novel | c.1772_1773insTGACATTTTTCAGCCACTTT | p.Ser592AspfsTer15 | p.S592Dfs*15 | Q8IZF3 | protein_coding | TCGA-A2-A0CM-01 | Breast | breast invasive carcinoma | Female | <65 | I/II | Chemotherapy | adriamycin | PD | ||
| ADGRF4 | deletion | Frame_Shift_Del | novel | c.1621delN | p.Gly542AlafsTer3 | p.G542Afs*3 | Q8IZF3 | protein_coding | TCGA-D8-A27V-01 | Breast | breast invasive carcinoma | Female | <65 | I/II | Hormone Therapy | tamoxiphen | SD | ||
| ADGRF4 | SNV | Missense_Mutation | novel | c.692C>T | p.Ser231Phe | p.S231F | Q8IZF3 | protein_coding | tolerated(0.06) | possibly_damaging(0.472) | TCGA-C5-A7X8-01 | Cervix | cervical & endocervical cancer | Female | <65 | I/II | Chemotherapy | cisplatin | SD |
| ADGRF4 | SNV | Missense_Mutation | novel | c.1510G>A | p.Val504Ile | p.V504I | Q8IZF3 | protein_coding | tolerated(0.96) | benign(0.026) | TCGA-EA-A410-01 | Cervix | cervical & endocervical cancer | Female | <65 | I/II | Unknown | Unknown | SD |
| ADGRF4 | SNV | Missense_Mutation | c.361N>T | p.Asp121Tyr | p.D121Y | Q8IZF3 | protein_coding | deleterious(0.04) | benign(0.127) | TCGA-EK-A2R8-01 | Cervix | cervical & endocervical cancer | Female | <65 | I/II | Unknown | Unknown | SD | |
| ADGRF4 | SNV | Missense_Mutation | c.736N>T | p.His246Tyr | p.H246Y | Q8IZF3 | protein_coding | tolerated(1) | benign(0.035) | TCGA-EK-A3GJ-01 | Cervix | cervical & endocervical cancer | Female | <65 | I/II | Unknown | Unknown | SD | |
| ADGRF4 | SNV | Missense_Mutation | c.112N>C | p.Ser38Arg | p.S38R | Q8IZF3 | protein_coding | tolerated(0.49) | benign(0) | TCGA-A6-5661-01 | Colorectum | colon adenocarcinoma | Female | >=65 | I/II | Unknown | Unknown | SD | |
| ADGRF4 | SNV | Missense_Mutation | c.822N>T | p.Gln274His | p.Q274H | Q8IZF3 | protein_coding | tolerated(0.52) | benign(0.169) | TCGA-AA-3510-01 | Colorectum | colon adenocarcinoma | Male | >=65 | I/II | Unknown | Unknown | SD | |
| ADGRF4 | SNV | Missense_Mutation | c.1324N>C | p.Cys442Arg | p.C442R | Q8IZF3 | protein_coding | deleterious(0) | probably_damaging(0.998) | TCGA-AA-3715-01 | Colorectum | colon adenocarcinoma | Male | >=65 | I/II | Unknown | Unknown | PD |
| Page: 1 2 3 4 5 6 7 8 9 10 |
Top |
Related drugs of malignant transformation related genes |
| Identification of chemicals and drugs interact with genes involved in malignant transfromation |
| (DGIdb 4.0) |
| Entrez ID | Symbol | Category | Interaction Types | Drug Claim Name | Drug Name | PMIDs |
| Page: 1 |

Copyright 2023-Present -The University of Texas Health Science Center at Houston |