| Tissue | Expression Dynamics | Abbreviation |
| Cervix | 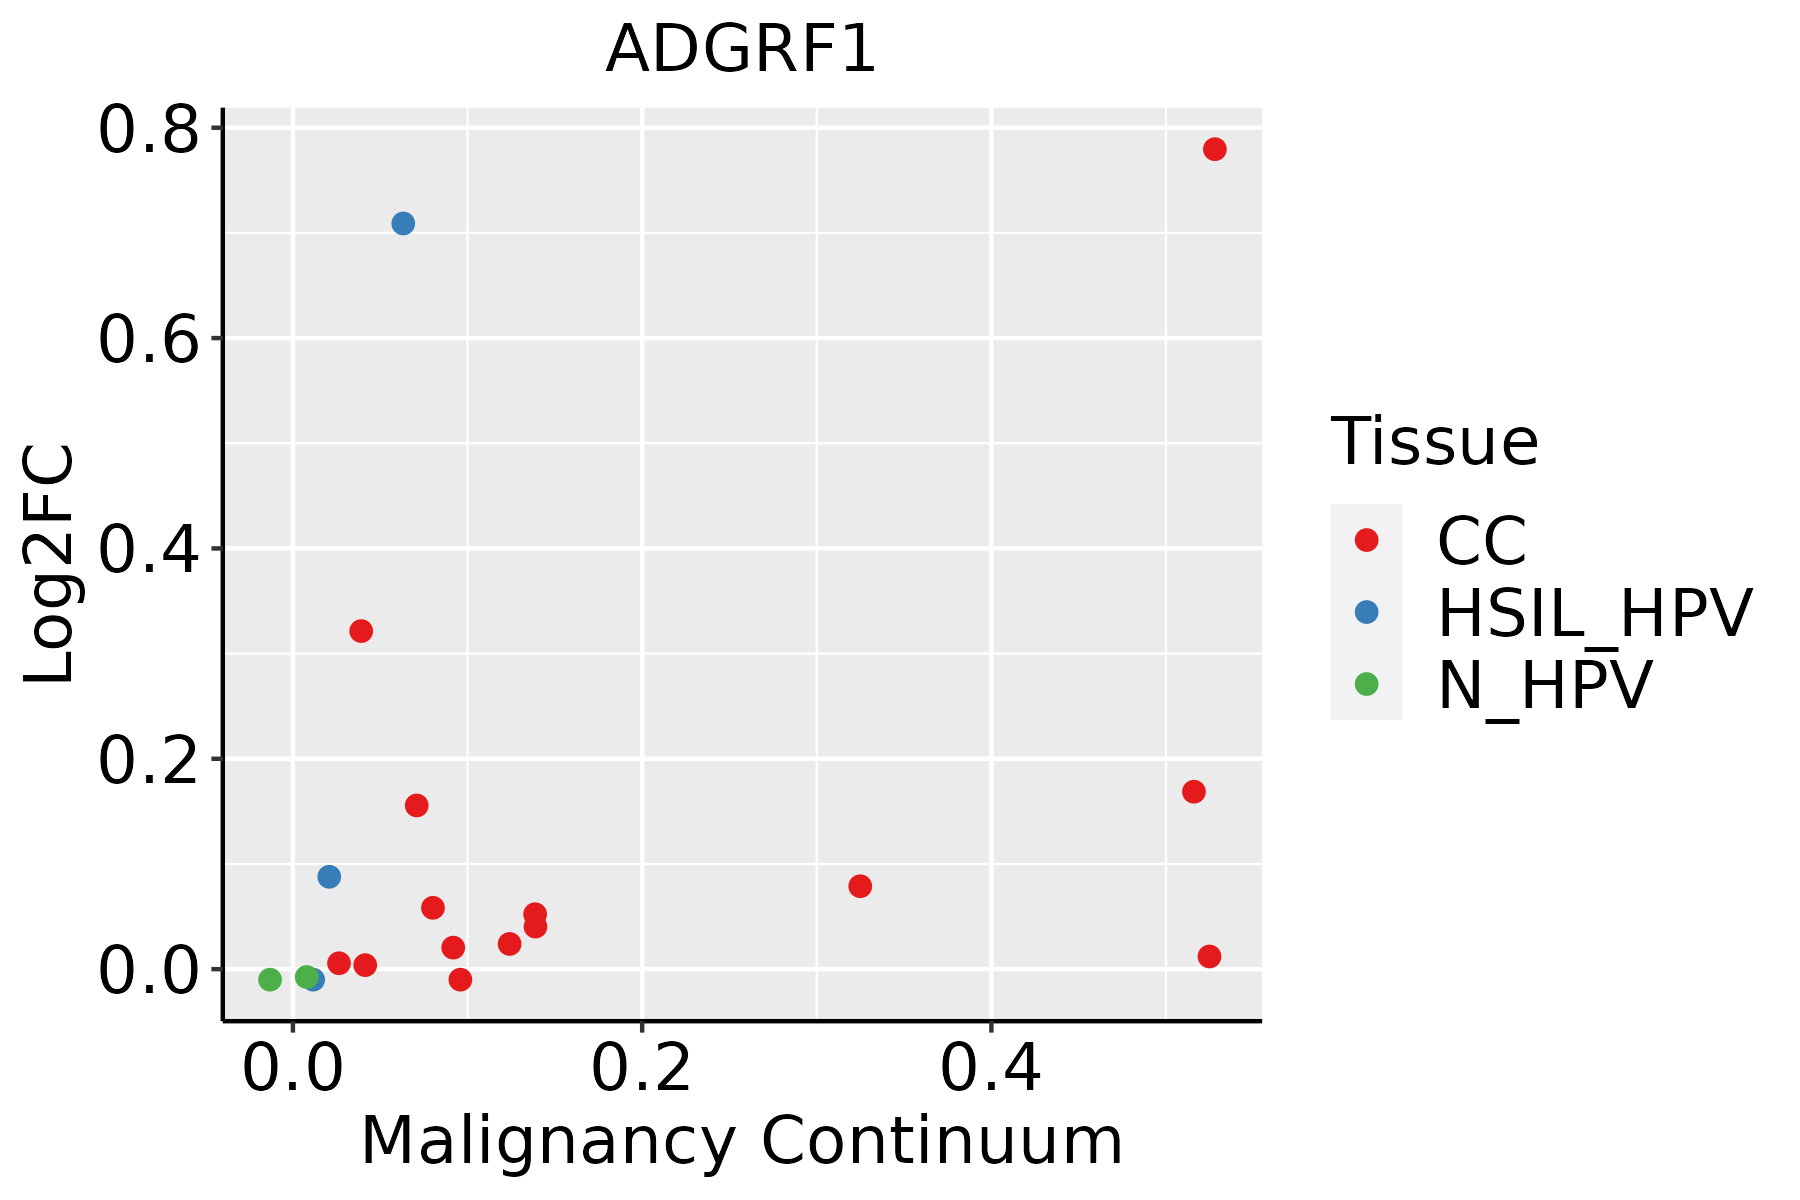 | CC: Cervix cancer |
| HSIL_HPV: HPV-infected high-grade squamous intraepithelial lesions |
| N_HPV: HPV-infected normal cervix |
| Esophagus |  | ESCC: Esophageal squamous cell carcinoma |
| HGIN: High-grade intraepithelial neoplasias |
| LGIN: Low-grade intraepithelial neoplasias |
| Lung | 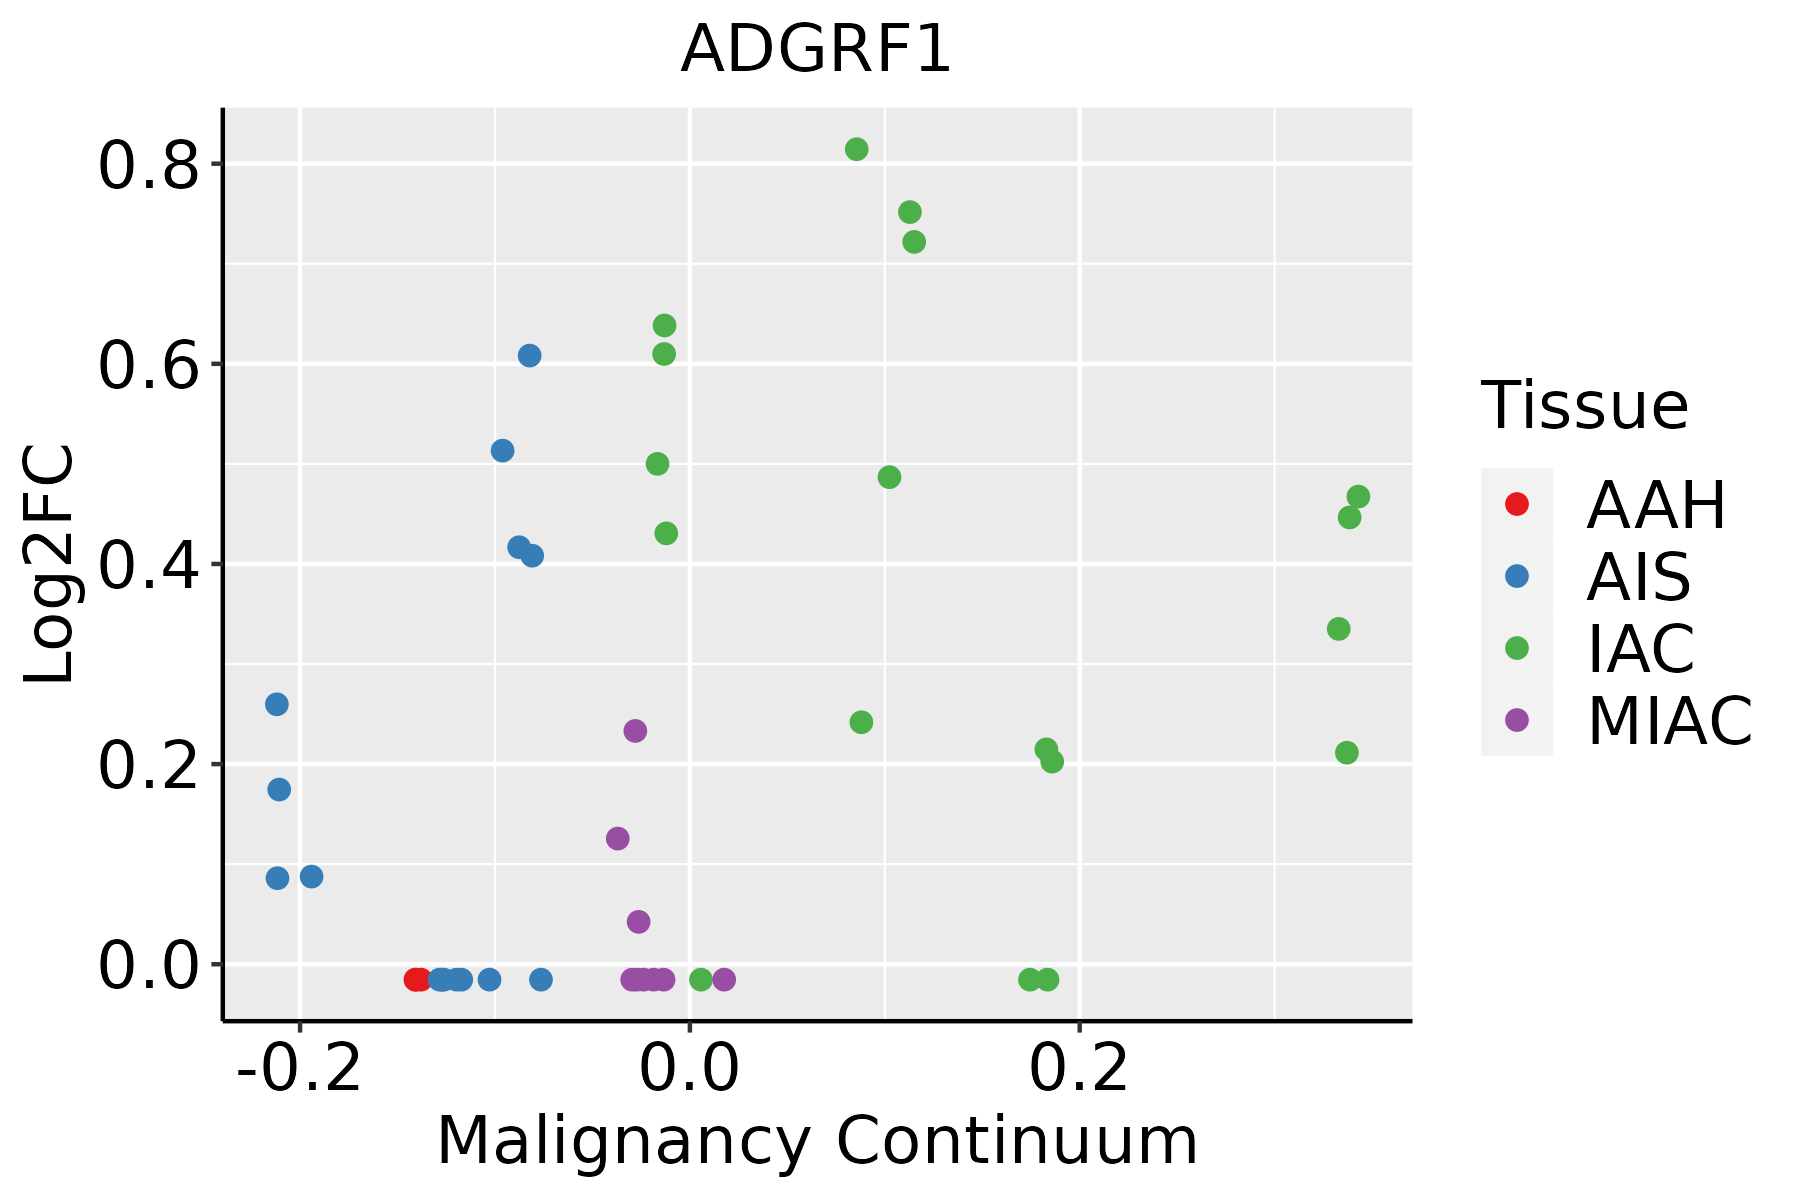 | AAH: Atypical adenomatous hyperplasia |
| AIS: Adenocarcinoma in situ |
| IAC: Invasive lung adenocarcinoma |
| MIA: Minimally invasive adenocarcinoma |
| Oral Cavity |  | EOLP: Erosive Oral lichen planus |
| LP: leukoplakia |
| NEOLP: Non-erosive oral lichen planus |
| OSCC: Oral squamous cell carcinoma |
| Prostate |  | BPH: Benign Prostatic Hyperplasia |
| Thyroid | 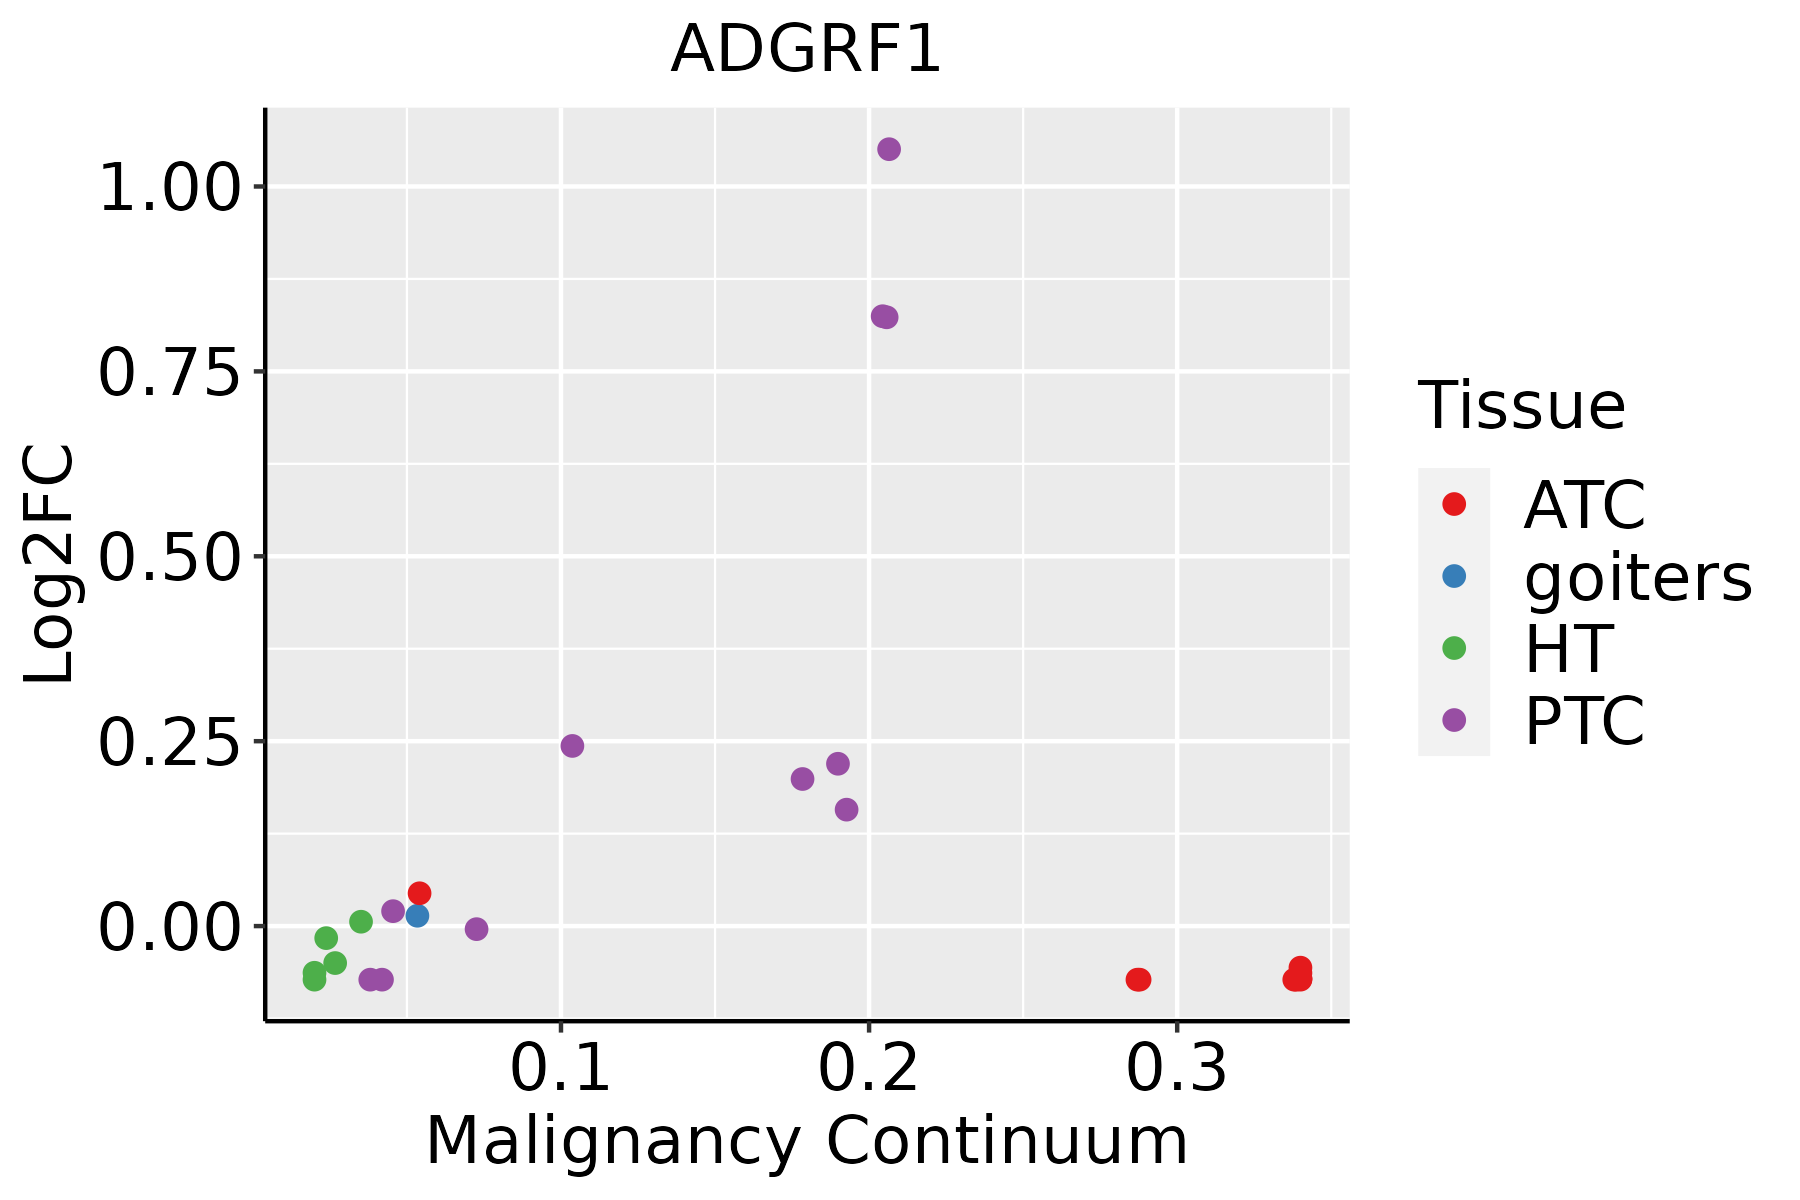 | ATC: Anaplastic thyroid cancer |
| HT: Hashimoto's thyroiditis |
| PTC: Papillary thyroid cancer |
| GO ID | Tissue | Disease Stage | Description | Gene Ratio | Bg Ratio | pvalue | p.adjust | Count |
| GO:00343298 | Cervix | CC | cell junction assembly | 88/2311 | 420/18723 | 3.42e-07 | 1.38e-05 | 88 |
| GO:00510904 | Cervix | CC | regulation of DNA-binding transcription factor activity | 87/2311 | 440/18723 | 4.85e-06 | 1.22e-04 | 87 |
| GO:00510915 | Cervix | CC | positive regulation of DNA-binding transcription factor activity | 51/2311 | 260/18723 | 5.05e-04 | 4.92e-03 | 51 |
| GO:005109012 | Cervix | HSIL_HPV | regulation of DNA-binding transcription factor activity | 35/737 | 440/18723 | 6.77e-05 | 1.58e-03 | 35 |
| GO:005109112 | Cervix | HSIL_HPV | positive regulation of DNA-binding transcription factor activity | 24/737 | 260/18723 | 1.01e-04 | 2.16e-03 | 24 |
| GO:003432913 | Cervix | HSIL_HPV | cell junction assembly | 28/737 | 420/18723 | 4.82e-03 | 3.98e-02 | 28 |
| GO:00510908 | Esophagus | ESCC | regulation of DNA-binding transcription factor activity | 252/8552 | 440/18723 | 5.22e-07 | 6.97e-06 | 252 |
| GO:00510918 | Esophagus | ESCC | positive regulation of DNA-binding transcription factor activity | 155/8552 | 260/18723 | 3.83e-06 | 4.14e-05 | 155 |
| GO:003432918 | Esophagus | ESCC | cell junction assembly | 227/8552 | 420/18723 | 3.06e-04 | 1.83e-03 | 227 |
| GO:00343297 | Lung | IAC | cell junction assembly | 86/2061 | 420/18723 | 7.98e-09 | 1.10e-06 | 86 |
| GO:00510903 | Lung | IAC | regulation of DNA-binding transcription factor activity | 76/2061 | 440/18723 | 4.44e-05 | 1.05e-03 | 76 |
| GO:00510914 | Lung | IAC | positive regulation of DNA-binding transcription factor activity | 50/2061 | 260/18723 | 5.87e-05 | 1.29e-03 | 50 |
| GO:00508085 | Lung | IAC | synapse organization | 65/2061 | 426/18723 | 4.05e-03 | 3.31e-02 | 65 |
| GO:003432912 | Lung | AIS | cell junction assembly | 84/1849 | 420/18723 | 2.16e-10 | 5.71e-08 | 84 |
| GO:005080811 | Lung | AIS | synapse organization | 63/1849 | 426/18723 | 7.39e-04 | 1.07e-02 | 63 |
| GO:005109011 | Lung | AIS | regulation of DNA-binding transcription factor activity | 64/1849 | 440/18723 | 1.04e-03 | 1.36e-02 | 64 |
| GO:005109111 | Lung | AIS | positive regulation of DNA-binding transcription factor activity | 41/1849 | 260/18723 | 1.77e-03 | 2.01e-02 | 41 |
| GO:00510907 | Oral cavity | OSCC | regulation of DNA-binding transcription factor activity | 221/7305 | 440/18723 | 9.06e-07 | 1.23e-05 | 221 |
| GO:00510917 | Oral cavity | OSCC | positive regulation of DNA-binding transcription factor activity | 134/7305 | 260/18723 | 2.52e-05 | 2.35e-04 | 134 |
| GO:003432916 | Oral cavity | OSCC | cell junction assembly | 190/7305 | 420/18723 | 4.99e-03 | 1.96e-02 | 190 |
| Hugo Symbol | Variant Class | Variant Classification | dbSNP RS | HGVSc | HGVSp | HGVSp Short | SWISSPROT | BIOTYPE | SIFT | PolyPhen | Tumor Sample Barcode | Tissue | Histology | Sex | Age | Stage | Therapy Types | Drugs | Outcome |
| ADGRF1 | SNV | Missense_Mutation | | c.2435T>G | p.Val812Gly | p.V812G | Q5T601 | protein_coding | deleterious(0) | possibly_damaging(0.688) | TCGA-A2-A259-01 | Breast | breast invasive carcinoma | Female | >=65 | I/II | Hormone Therapy | arimidex | SD |
| ADGRF1 | SNV | Missense_Mutation | | c.2191N>T | p.Asp731Tyr | p.D731Y | Q5T601 | protein_coding | deleterious(0) | possibly_damaging(0.905) | TCGA-AR-A0TY-01 | Breast | breast invasive carcinoma | Female | <65 | I/II | Unspecific | Paclitaxel | PD |
| ADGRF1 | SNV | Missense_Mutation | | c.1643N>T | p.Gly548Val | p.G548V | Q5T601 | protein_coding | deleterious(0) | probably_damaging(0.997) | TCGA-BH-A0B5-01 | Breast | breast invasive carcinoma | Female | <65 | III/IV | Chemotherapy | adriamycin | CR |
| ADGRF1 | SNV | Missense_Mutation | | c.2684N>A | p.Gly895Glu | p.G895E | Q5T601 | protein_coding | deleterious(0.03) | possibly_damaging(0.652) | TCGA-BH-A0HF-01 | Breast | breast invasive carcinoma | Female | >=65 | I/II | Hormone Therapy | arimidex | SD |
| ADGRF1 | SNV | Missense_Mutation | novel | c.2236N>A | p.Ala746Thr | p.A746T | Q5T601 | protein_coding | deleterious(0) | probably_damaging(0.994) | TCGA-EW-A6SA-01 | Breast | breast invasive carcinoma | Male | <65 | I/II | Unknown | Unknown | SD |
| ADGRF1 | insertion | Frame_Shift_Ins | novel | c.2422_2423insACGTTGTCGGAAAAAAGGGGAATTCTTTTTACCTT | p.Ile808AsnfsTer13 | p.I808Nfs*13 | Q5T601 | protein_coding | | | TCGA-A8-A0A4-01 | Breast | breast invasive carcinoma | Female | >=65 | I/II | Hormone Therapy | tamoxiphen | CR |
| ADGRF1 | SNV | Missense_Mutation | novel | c.2278G>A | p.Val760Ile | p.V760I | Q5T601 | protein_coding | tolerated(0.84) | benign(0.001) | TCGA-2W-A8YY-01 | Cervix | cervical & endocervical cancer | Female | <65 | I/II | Chemotherapy | cisplatin | CR |
| ADGRF1 | SNV | Missense_Mutation | rs112946460 | c.1636G>A | p.Asp546Asn | p.D546N | Q5T601 | protein_coding | tolerated(0.74) | benign(0) | TCGA-2W-A8YY-01 | Cervix | cervical & endocervical cancer | Female | <65 | I/II | Chemotherapy | cisplatin | CR |
| ADGRF1 | SNV | Missense_Mutation | | c.1743N>G | p.Ile581Met | p.I581M | Q5T601 | protein_coding | deleterious(0.03) | benign(0.073) | TCGA-HM-A4S6-01 | Cervix | cervical & endocervical cancer | Female | <65 | III/IV | Chemotherapy | cisplatin | CR |
| ADGRF1 | SNV | Missense_Mutation | | c.572G>C | p.Arg191Thr | p.R191T | Q5T601 | protein_coding | tolerated(0.65) | benign(0.134) | TCGA-Q1-A73O-01 | Cervix | cervical & endocervical cancer | Female | <65 | I/II | Chemotherapy | cisplatin | CR |


