
|
|||||
|
 | |
| |
| |
| |
| |
| |
|
Gene: ADGRE5 |
Gene summary for ADGRE5 |
| Gene information | Species | Human | Gene symbol | ADGRE5 | Gene ID | 976 |
| Gene name | adhesion G protein-coupled receptor E5 | |
| Gene Alias | CD97 | |
| Cytomap | 19p13.12 | |
| Gene Type | protein-coding | GO ID | GO:0002376 | UniProtAcc | P48960 |
Top |
Malignant transformation analysis |
| Identification of the aberrant gene expression in precancerous and cancerous lesions by comparing the gene expression of stem-like cells in diseased tissues with normal stem cells |
| Entrez ID | Symbol | Replicates | Species | Organ | Tissue | Adj P-value | Log2FC | Malignancy |
| 976 | ADGRE5 | LZE24T | Human | Esophagus | ESCC | 8.00e-08 | 2.43e-01 | 0.0596 |
| 976 | ADGRE5 | LZE6T | Human | Esophagus | ESCC | 1.30e-12 | 6.10e-01 | 0.0845 |
| 976 | ADGRE5 | P2T-E | Human | Esophagus | ESCC | 9.86e-06 | 2.24e-02 | 0.1177 |
| 976 | ADGRE5 | P5T-E | Human | Esophagus | ESCC | 6.31e-08 | 1.60e-01 | 0.1327 |
| 976 | ADGRE5 | P8T-E | Human | Esophagus | ESCC | 2.92e-13 | 2.33e-01 | 0.0889 |
| 976 | ADGRE5 | P10T-E | Human | Esophagus | ESCC | 3.99e-02 | -2.23e-02 | 0.116 |
| 976 | ADGRE5 | P11T-E | Human | Esophagus | ESCC | 8.86e-10 | 4.87e-01 | 0.1426 |
| 976 | ADGRE5 | P16T-E | Human | Esophagus | ESCC | 1.26e-04 | -4.98e-03 | 0.1153 |
| 976 | ADGRE5 | P19T-E | Human | Esophagus | ESCC | 5.03e-07 | 3.88e-01 | 0.1662 |
| 976 | ADGRE5 | P21T-E | Human | Esophagus | ESCC | 2.24e-16 | 3.67e-01 | 0.1617 |
| 976 | ADGRE5 | P22T-E | Human | Esophagus | ESCC | 2.17e-03 | -1.15e-02 | 0.1236 |
| 976 | ADGRE5 | P23T-E | Human | Esophagus | ESCC | 9.64e-06 | 1.88e-01 | 0.108 |
| 976 | ADGRE5 | P24T-E | Human | Esophagus | ESCC | 1.25e-07 | 1.68e-01 | 0.1287 |
| 976 | ADGRE5 | P26T-E | Human | Esophagus | ESCC | 1.05e-12 | 1.83e-01 | 0.1276 |
| 976 | ADGRE5 | P27T-E | Human | Esophagus | ESCC | 4.47e-02 | -1.45e-02 | 0.1055 |
| 976 | ADGRE5 | P28T-E | Human | Esophagus | ESCC | 8.22e-15 | 2.80e-01 | 0.1149 |
| 976 | ADGRE5 | P31T-E | Human | Esophagus | ESCC | 1.00e-05 | 1.90e-01 | 0.1251 |
| 976 | ADGRE5 | P32T-E | Human | Esophagus | ESCC | 1.06e-15 | 1.87e-01 | 0.1666 |
| 976 | ADGRE5 | P37T-E | Human | Esophagus | ESCC | 1.96e-08 | 2.19e-01 | 0.1371 |
| 976 | ADGRE5 | P39T-E | Human | Esophagus | ESCC | 1.94e-02 | -2.50e-02 | 0.0894 |
| Page: 1 2 3 4 |
| Tissue | Expression Dynamics | Abbreviation |
| Esophagus | 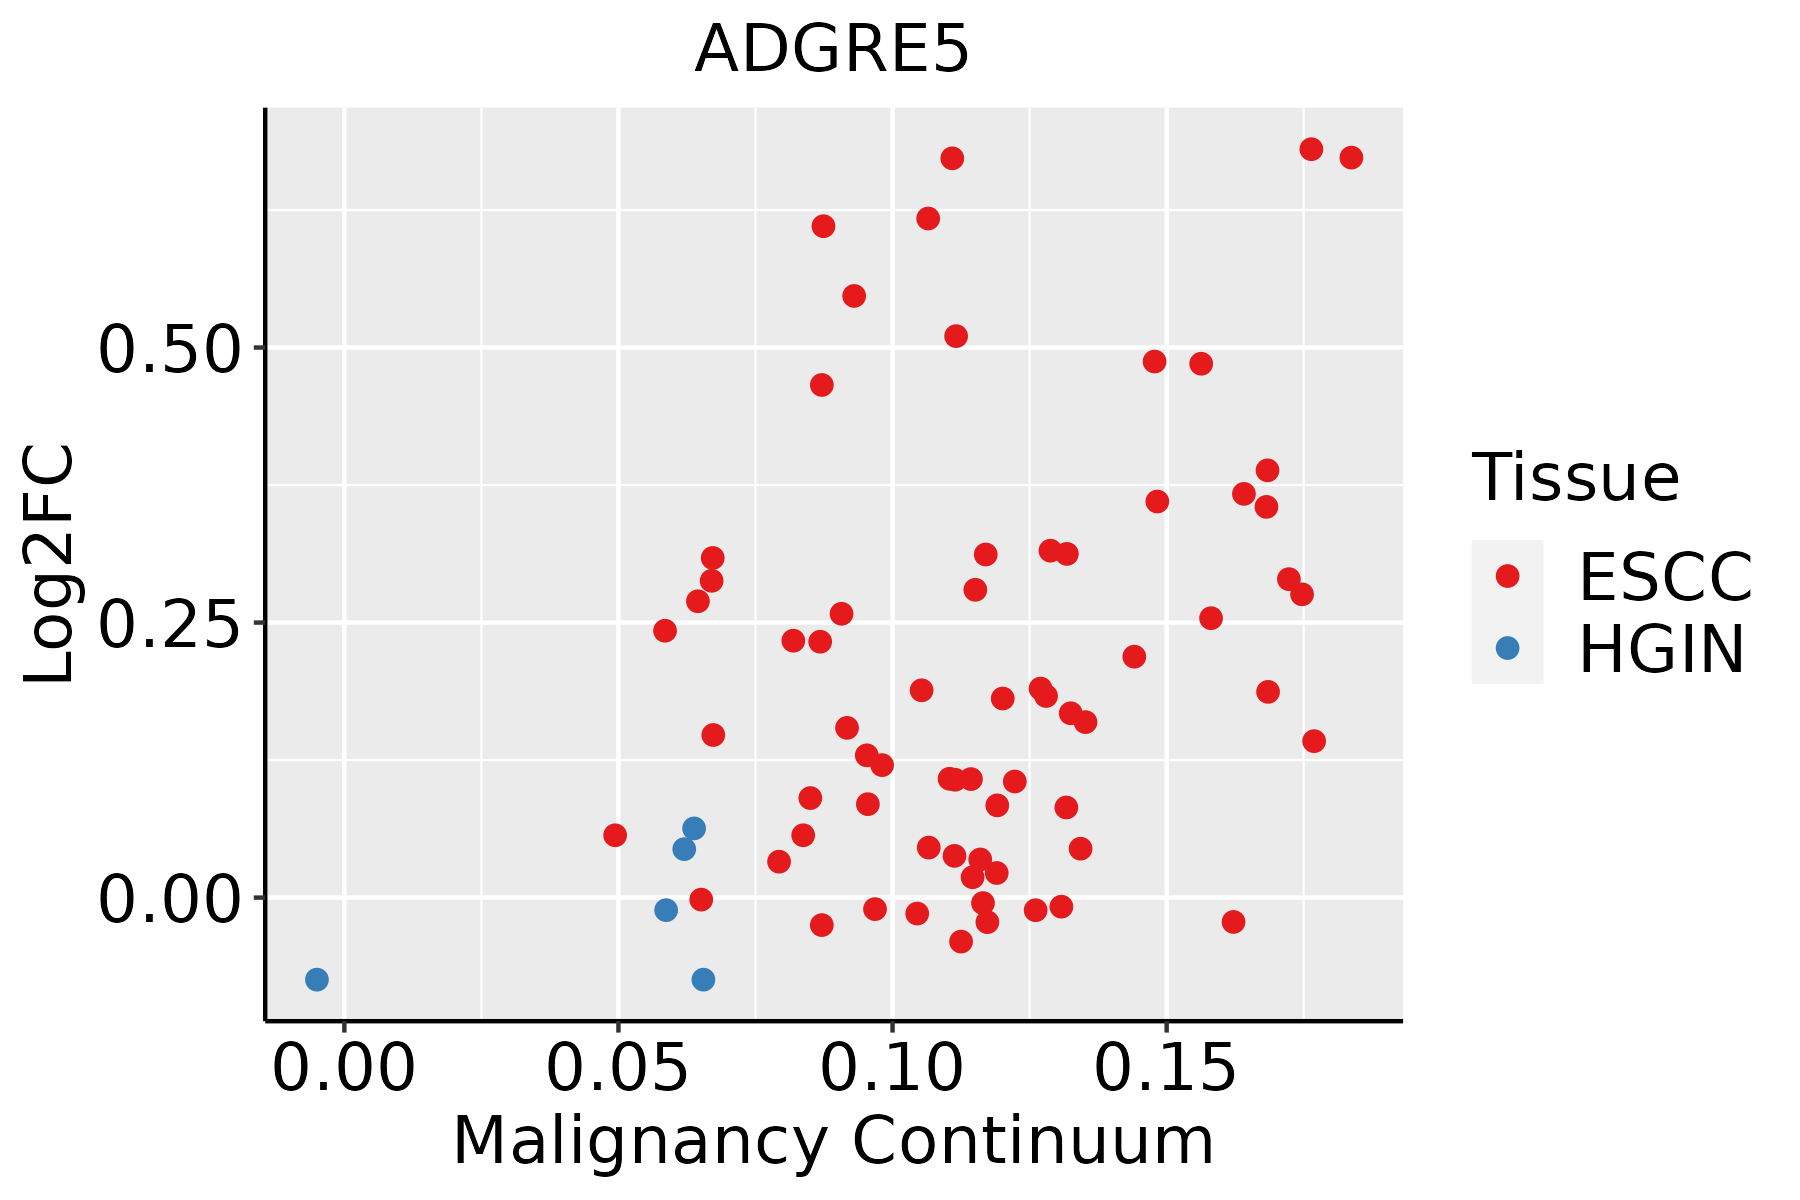 | ESCC: Esophageal squamous cell carcinoma |
| HGIN: High-grade intraepithelial neoplasias | ||
| LGIN: Low-grade intraepithelial neoplasias | ||
| Liver | 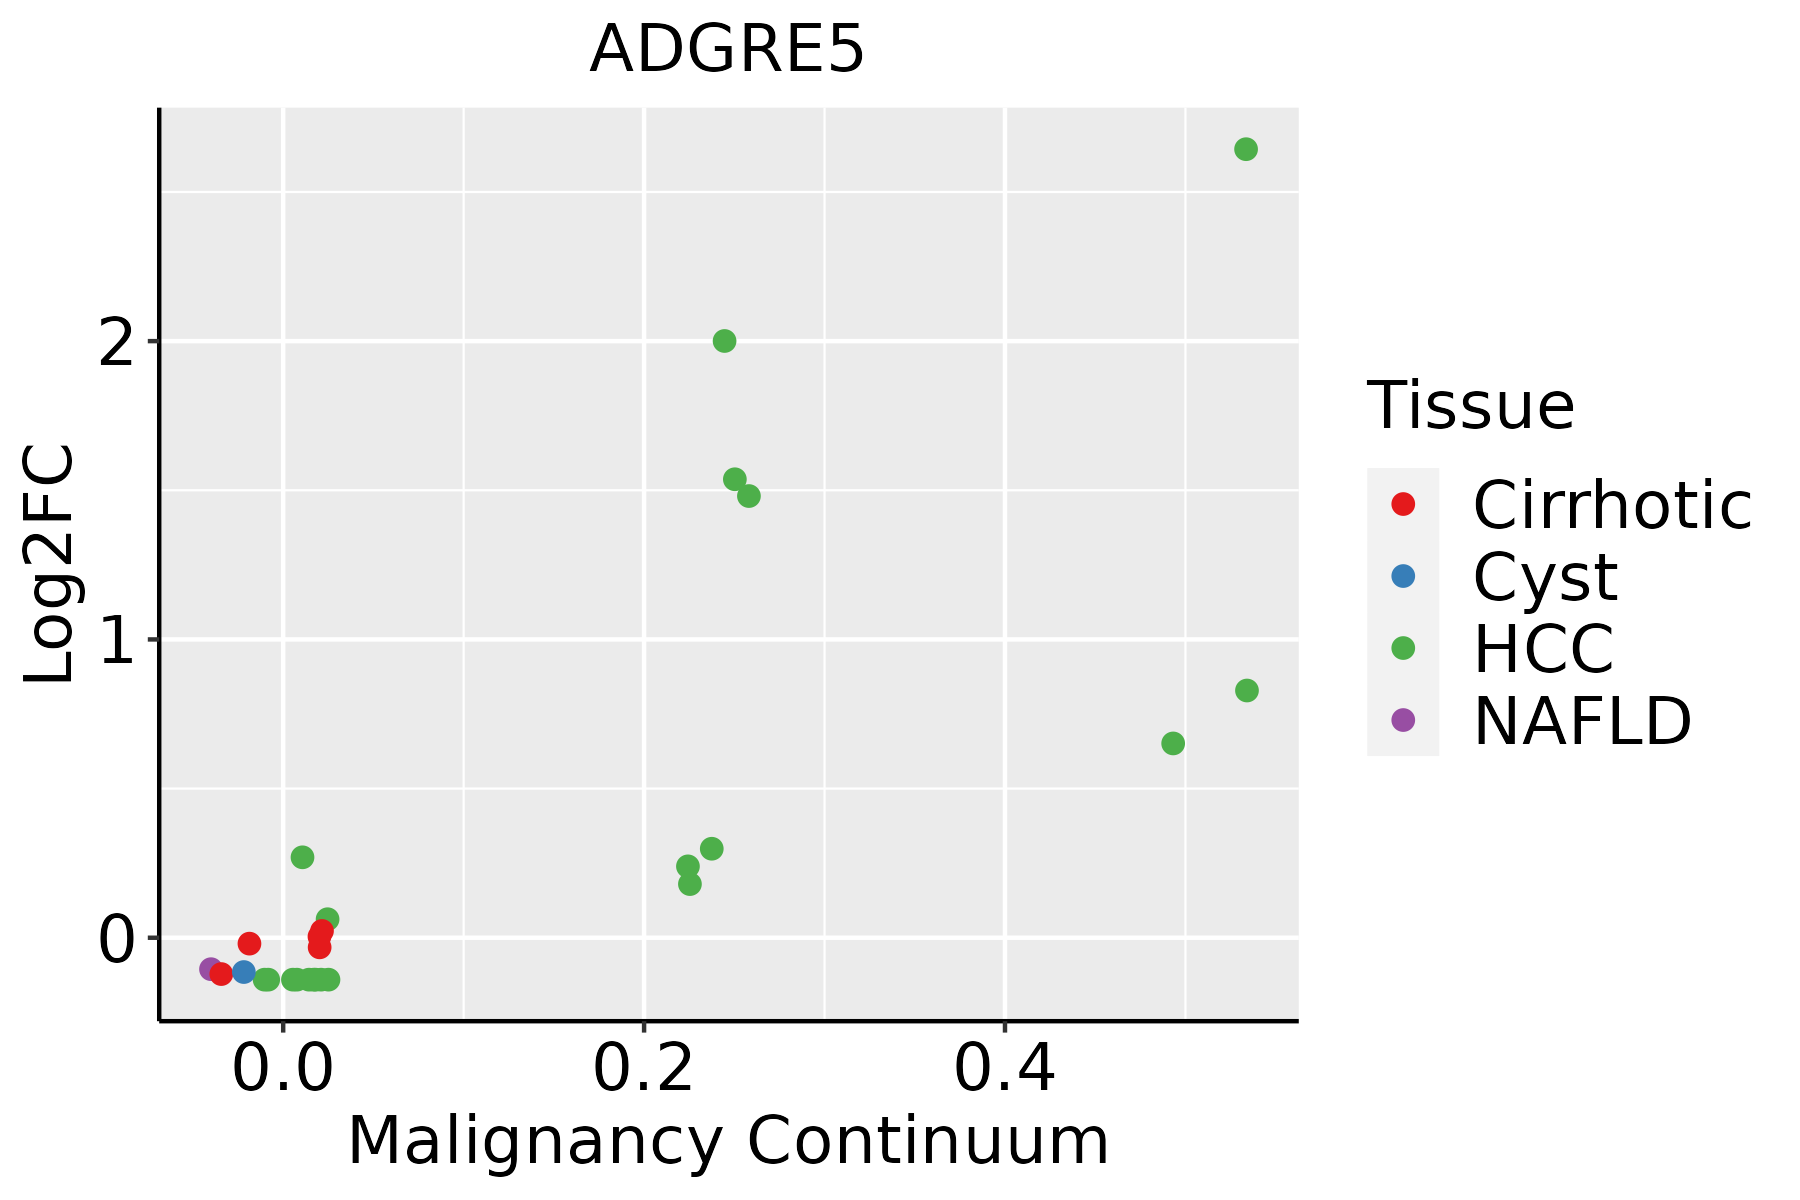 | HCC: Hepatocellular carcinoma |
| NAFLD: Non-alcoholic fatty liver disease | ||
| Oral Cavity |  | EOLP: Erosive Oral lichen planus |
| LP: leukoplakia | ||
| NEOLP: Non-erosive oral lichen planus | ||
| OSCC: Oral squamous cell carcinoma | ||
| Thyroid | 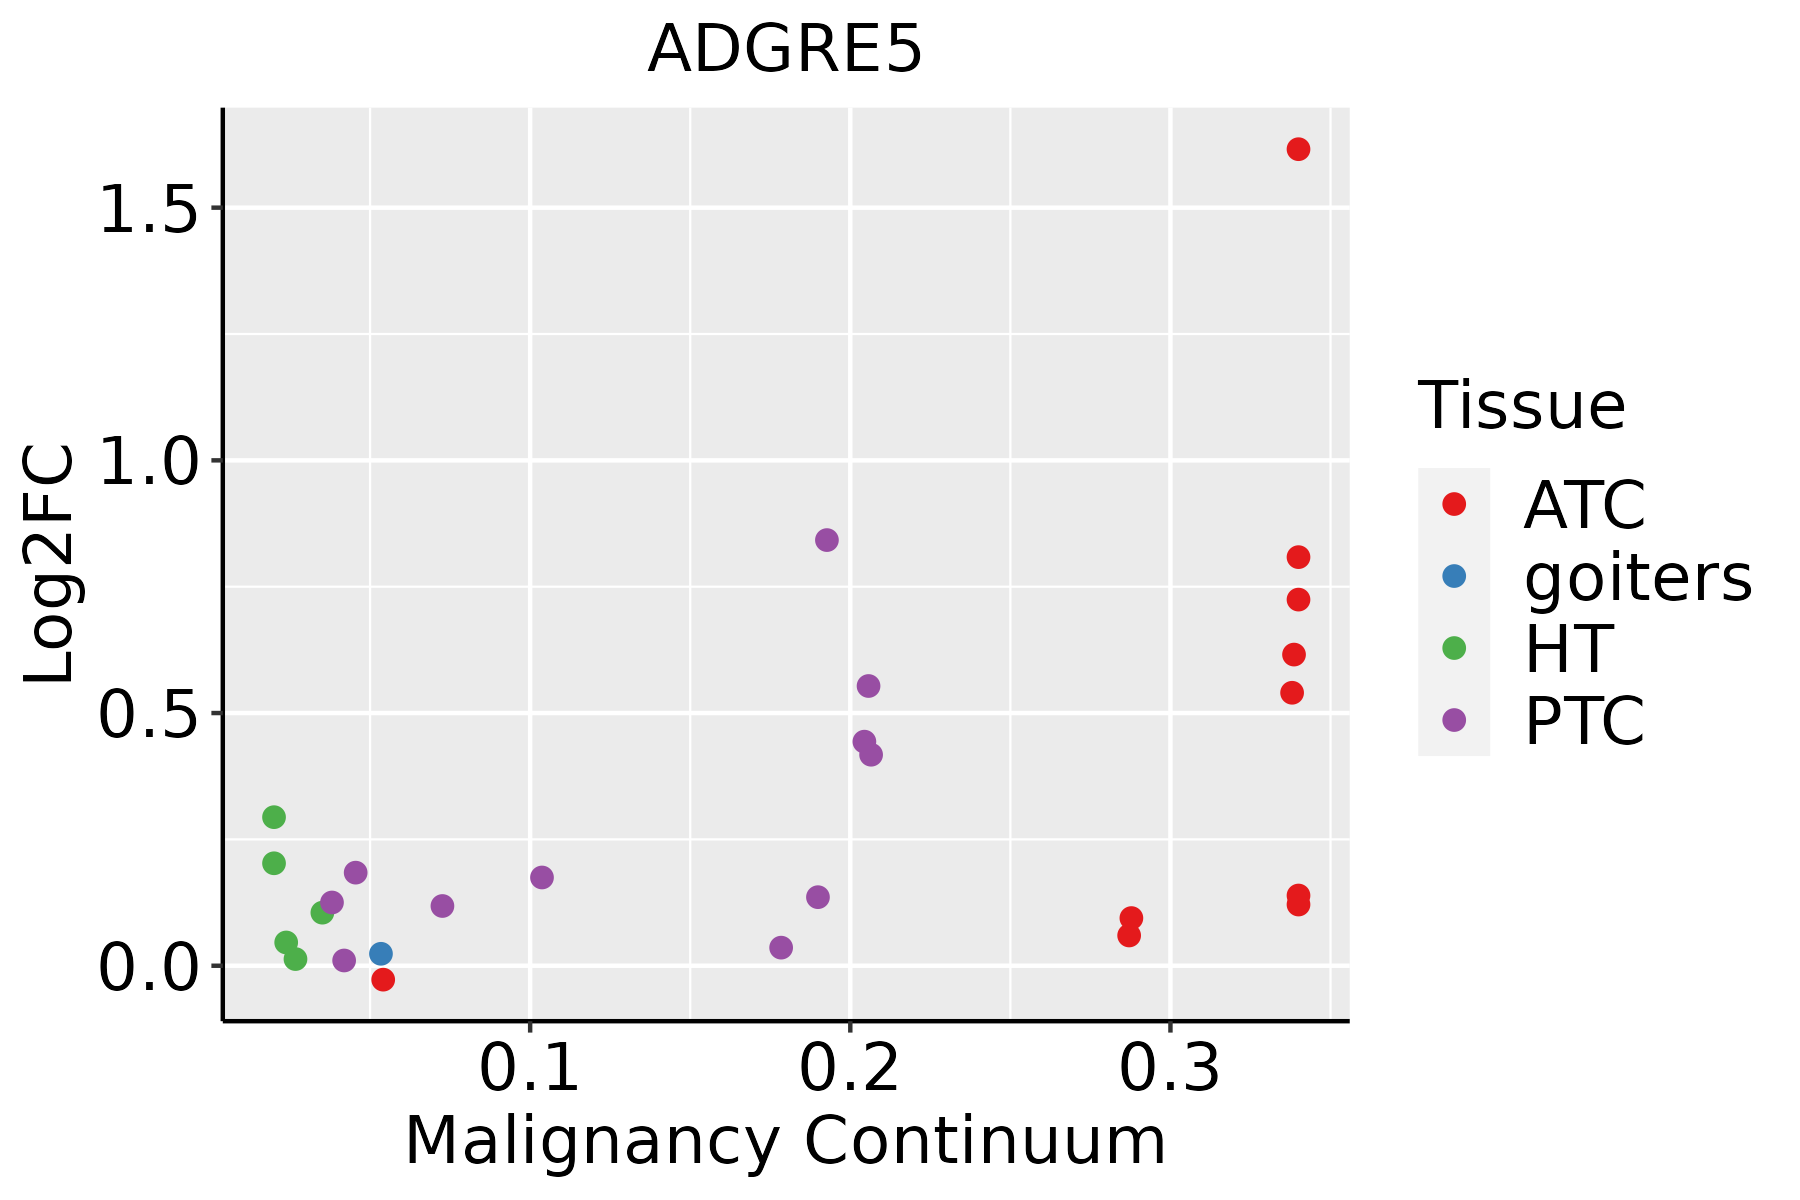 | ATC: Anaplastic thyroid cancer |
| HT: Hashimoto's thyroiditis | ||
| PTC: Papillary thyroid cancer |
| ∗log2FC in expression of this searched gene in stem-like cells from each diseased tissue sample relative to stem-like cells in normal samples in each tissue plotted against the malignancy continuum. Samples are colored based on if they are from different disease stage. |
Top |
Malignant transformation related pathway analysis |
| Find out the enriched GO biological processes and KEGG pathways involved in transition from healthy to precancer to cancer |
| Tissue | Disease Stage | Enriched GO biological Processes |
| Colorectum | AD |  |
| Colorectum | SER |  |
| Colorectum | MSS |  |
| Colorectum | MSI-H |  |
| Colorectum | FAP |  |
| ∗Top 15 enriched GO BP terms are showed in the bar plot of each disease state in each tissue. Each row represents a significant GO biological process which is colored according to the -log10(p.adjust). |
| Page: 1 2 3 4 5 6 7 8 9 |
| GO ID | Tissue | Disease Stage | Description | Gene Ratio | Bg Ratio | pvalue | p.adjust | Count |
| Page: 1 |
| Pathway ID | Tissue | Disease Stage | Description | Gene Ratio | Bg Ratio | pvalue | p.adjust | qvalue | Count |
| Page: 1 |
Top |
Cell-cell communication analysis |
| Identification of potential cell-cell interactions between two cell types and their ligand-receptor pairs for different disease states |
| Ligand | Receptor | LRpair | Pathway | Tissue | Disease Stage |
| ADGRE5 | CD55 | ADGRE5_CD55 | ADGRE5 | Breast | ADJ |
| ADGRE5 | CD55 | ADGRE5_CD55 | ADGRE5 | Breast | DCIS |
| ADGRE5 | CD55 | ADGRE5_CD55 | ADGRE5 | Breast | Healthy |
| ADGRE5 | CD55 | ADGRE5_CD55 | ADGRE5 | Breast | IDC |
| ADGRE5 | CD55 | ADGRE5_CD55 | ADGRE5 | Cervix | ADJ |
| ADGRE5 | CD55 | ADGRE5_CD55 | ADGRE5 | Cervix | CC |
| ADGRE5 | CD55 | ADGRE5_CD55 | ADGRE5 | Cervix | Healthy |
| ADGRE5 | CD55 | ADGRE5_CD55 | ADGRE5 | CRC | Healthy |
| ADGRE5 | CD55 | ADGRE5_CD55 | ADGRE5 | CRC | MSI-H |
| ADGRE5 | CD55 | ADGRE5_CD55 | ADGRE5 | CRC | MSS |
| ADGRE5 | CD55 | ADGRE5_CD55 | ADGRE5 | Endometrium | ADJ |
| ADGRE5 | CD55 | ADGRE5_CD55 | ADGRE5 | Endometrium | AEH |
| ADGRE5 | CD55 | ADGRE5_CD55 | ADGRE5 | Endometrium | EEC |
| ADGRE5 | CD55 | ADGRE5_CD55 | ADGRE5 | Endometrium | Healthy |
| ADGRE5 | CD55 | ADGRE5_CD55 | ADGRE5 | Esophagus | ESCC |
| ADGRE5 | CD55 | ADGRE5_CD55 | ADGRE5 | GC | ADJ |
| ADGRE5 | CD55 | ADGRE5_CD55 | ADGRE5 | GC | GC |
| ADGRE5 | CD55 | ADGRE5_CD55 | ADGRE5 | GC | Precancer |
| ADGRE5 | CD55 | ADGRE5_CD55 | ADGRE5 | HNSCC | ADJ |
| ADGRE5 | CD55 | ADGRE5_CD55 | ADGRE5 | HNSCC | Healthy |
| Page: 1 2 3 |
Top |
Single-cell gene regulatory network inference analysis |
| Find out the significant the regulons (TFs) and the target genes of each regulon across cell types for different disease states |
| TF | Cell Type | Tissue | Disease Stage | Target Gene | RSS | Regulon Activity |
| ∗The dot plots of a searched regulon are shown for all cell subpopulations in each disease state of each tissue based on the regulon specific score inferred using pySCENIC and by calculating the average expression. |
| Page: 1 |
Top |
Somatic mutation of malignant transformation related genes |
| Annotation of somatic variants for genes involved in malignant transformation |
| Hugo Symbol | Variant Class | Variant Classification | dbSNP RS | HGVSc | HGVSp | HGVSp Short | SWISSPROT | BIOTYPE | SIFT | PolyPhen | Tumor Sample Barcode | Tissue | Histology | Sex | Age | Stage | Therapy Types | Drugs | Outcome |
| ADGRE5 | SNV | Missense_Mutation | rs200963785 | c.2294N>G | p.Leu765Trp | p.L765W | P48960 | protein_coding | tolerated(0.23) | benign(0.04) | TCGA-A8-A09E-01 | Breast | breast invasive carcinoma | Female | >=65 | III/IV | Hormone Therapy | anastrozole | SD |
| ADGRE5 | SNV | Missense_Mutation | c.1187N>G | p.Pro396Arg | p.P396R | P48960 | protein_coding | deleterious(0.04) | benign(0.058) | TCGA-A8-A09M-01 | Breast | breast invasive carcinoma | Female | >=65 | III/IV | Chemotherapy | paclitaxel | CR | |
| ADGRE5 | SNV | Missense_Mutation | novel | c.1215N>C | p.Gln405His | p.Q405H | P48960 | protein_coding | deleterious(0.02) | benign(0) | TCGA-BH-A0B6-01 | Breast | breast invasive carcinoma | Female | <65 | I/II | Unknown | Unknown | SD |
| ADGRE5 | SNV | Missense_Mutation | rs145308566 | c.2143N>A | p.Val715Ile | p.V715I | P48960 | protein_coding | tolerated(0.18) | possibly_damaging(0.72) | TCGA-BH-A0DL-01 | Breast | breast invasive carcinoma | Female | <65 | I/II | Chemotherapy | cytoxan | CR |
| ADGRE5 | SNV | Missense_Mutation | c.431N>A | p.Cys144Tyr | p.C144Y | P48960 | protein_coding | deleterious(0) | possibly_damaging(0.853) | TCGA-BH-A0HF-01 | Breast | breast invasive carcinoma | Female | >=65 | I/II | Hormone Therapy | arimidex | SD | |
| ADGRE5 | SNV | Missense_Mutation | c.1328C>T | p.Ser443Phe | p.S443F | P48960 | protein_coding | deleterious(0) | possibly_damaging(0.461) | TCGA-BH-A0W7-01 | Breast | breast invasive carcinoma | Female | <65 | I/II | Chemotherapy | taxotere | CR | |
| ADGRE5 | insertion | Frame_Shift_Ins | novel | c.1721_1722insT | p.Ile575HisfsTer115 | p.I575Hfs*115 | P48960 | protein_coding | TCGA-AN-A0FV-01 | Breast | breast invasive carcinoma | Female | <65 | I/II | Unknown | Unknown | SD | ||
| ADGRE5 | insertion | In_Frame_Ins | novel | c.1722_1723insTTCCTTTGGCCTCTTCTCTACAACCCAGCAACT | p.Pro574_Ile575insPheLeuTrpProLeuLeuTyrAsnProAlaThr | p.P574_I575insFLWPLLYNPAT | P48960 | protein_coding | TCGA-AN-A0FV-01 | Breast | breast invasive carcinoma | Female | <65 | I/II | Unknown | Unknown | SD | ||
| ADGRE5 | insertion | Frame_Shift_Ins | novel | c.2264_2265insCCGCC | p.Gly756ArgfsTer14 | p.G756Rfs*14 | P48960 | protein_coding | TCGA-E9-A1NC-01 | Breast | breast invasive carcinoma | Female | <65 | I/II | Chemotherapy | doxorubicin | CR | ||
| ADGRE5 | insertion | Nonsense_Mutation | novel | c.2265_2266insTCTGCTGGATGAGCCTCGAA | p.Gly756SerfsTer4 | p.G756Sfs*4 | P48960 | protein_coding | TCGA-E9-A1NC-01 | Breast | breast invasive carcinoma | Female | <65 | I/II | Chemotherapy | doxorubicin | CR |
| Page: 1 2 3 4 5 6 7 8 9 |
Top |
Related drugs of malignant transformation related genes |
| Identification of chemicals and drugs interact with genes involved in malignant transfromation |
| (DGIdb 4.0) |
| Entrez ID | Symbol | Category | Interaction Types | Drug Claim Name | Drug Name | PMIDs |
| Page: 1 |

Copyright 2023-Present -The University of Texas Health Science Center at Houston |