
|
|||||
|
 | |
| |
| |
| |
| |
| |
|
Gene: ADGRE1 |
Gene summary for ADGRE1 |
| Gene information | Species | Human | Gene symbol | ADGRE1 | Gene ID | 2015 |
| Gene name | adhesion G protein-coupled receptor E1 | |
| Gene Alias | EMR1 | |
| Cytomap | 19p13.3-p13.2 | |
| Gene Type | protein-coding | GO ID | GO:0002250 | UniProtAcc | Q14246 |
Top |
Malignant transformation analysis |
| Identification of the aberrant gene expression in precancerous and cancerous lesions by comparing the gene expression of stem-like cells in diseased tissues with normal stem cells |
| Entrez ID | Symbol | Replicates | Species | Organ | Tissue | Adj P-value | Log2FC | Malignancy |
| 2015 | ADGRE1 | P11T-E | Human | Esophagus | ESCC | 3.75e-08 | 3.89e-01 | 0.1426 |
| 2015 | ADGRE1 | P26T-E | Human | Esophagus | ESCC | 3.97e-04 | 1.65e-01 | 0.1276 |
| 2015 | ADGRE1 | P32T-E | Human | Esophagus | ESCC | 9.20e-06 | 1.58e-01 | 0.1666 |
| 2015 | ADGRE1 | P36T-E | Human | Esophagus | ESCC | 9.55e-10 | 3.38e-01 | 0.1187 |
| 2015 | ADGRE1 | P74T-E | Human | Esophagus | ESCC | 1.26e-08 | 2.57e-01 | 0.1479 |
| 2015 | ADGRE1 | P80T-E | Human | Esophagus | ESCC | 3.61e-26 | 7.12e-01 | 0.155 |
| 2015 | ADGRE1 | P83T-E | Human | Esophagus | ESCC | 8.77e-03 | 2.05e-01 | 0.1738 |
| 2015 | ADGRE1 | P91T-E | Human | Esophagus | ESCC | 6.28e-18 | 1.34e+00 | 0.1828 |
| 2015 | ADGRE1 | P130T-E | Human | Esophagus | ESCC | 1.66e-02 | 9.25e-02 | 0.1676 |
| 2015 | ADGRE1 | C04 | Human | Oral cavity | OSCC | 5.89e-24 | 8.36e-01 | 0.2633 |
| 2015 | ADGRE1 | C38 | Human | Oral cavity | OSCC | 4.07e-13 | 7.27e-01 | 0.172 |
| 2015 | ADGRE1 | C06 | Human | Oral cavity | OSCC | 1.28e-06 | 7.88e-01 | 0.2699 |
| 2015 | ADGRE1 | C08 | Human | Oral cavity | OSCC | 3.95e-11 | 3.03e-01 | 0.1919 |
| 2015 | ADGRE1 | LN38 | Human | Oral cavity | OSCC | 4.47e-05 | 6.17e-01 | 0.168 |
| 2015 | ADGRE1 | ATC2 | Human | Thyroid | ATC | 9.94e-09 | 1.13e+00 | 0.34 |
| Page: 1 |
| Tissue | Expression Dynamics | Abbreviation |
| Esophagus | 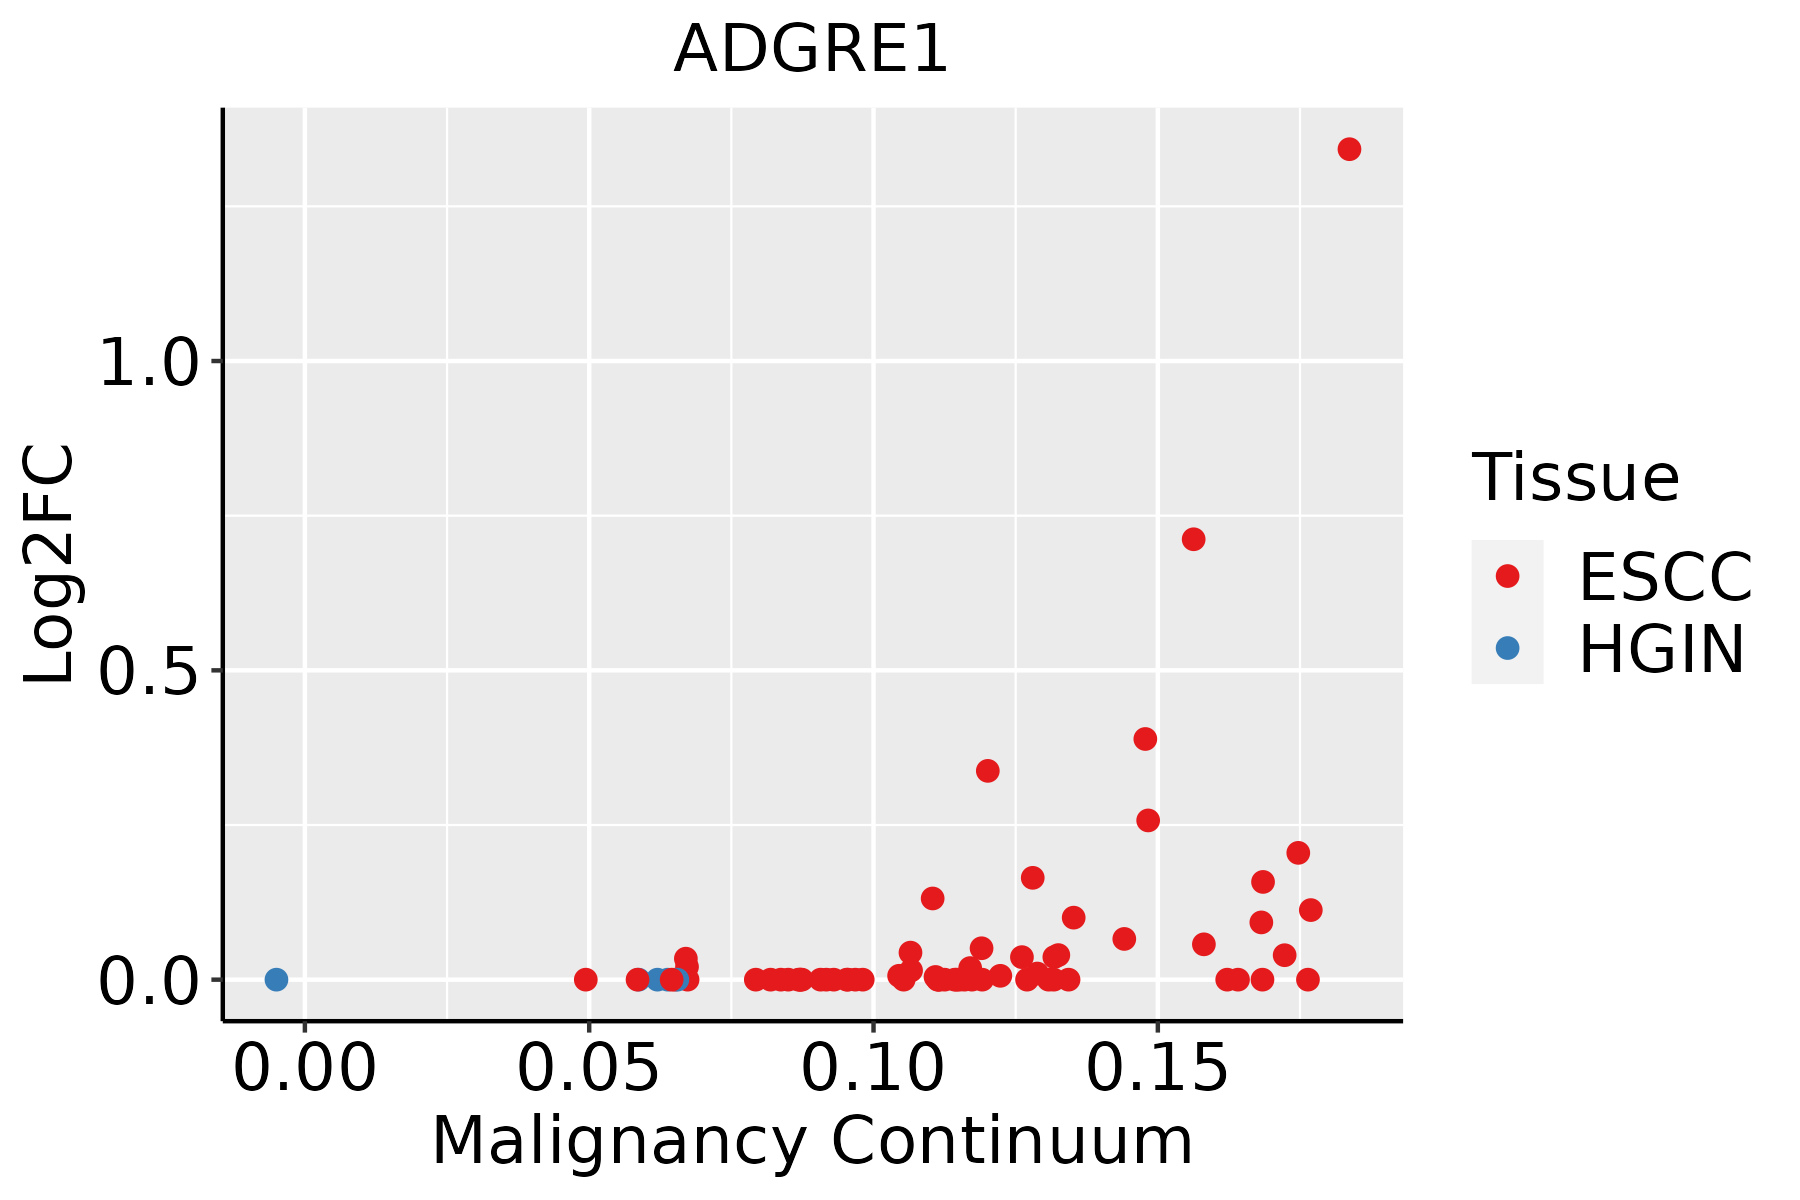 | ESCC: Esophageal squamous cell carcinoma |
| HGIN: High-grade intraepithelial neoplasias | ||
| LGIN: Low-grade intraepithelial neoplasias | ||
| Oral Cavity | 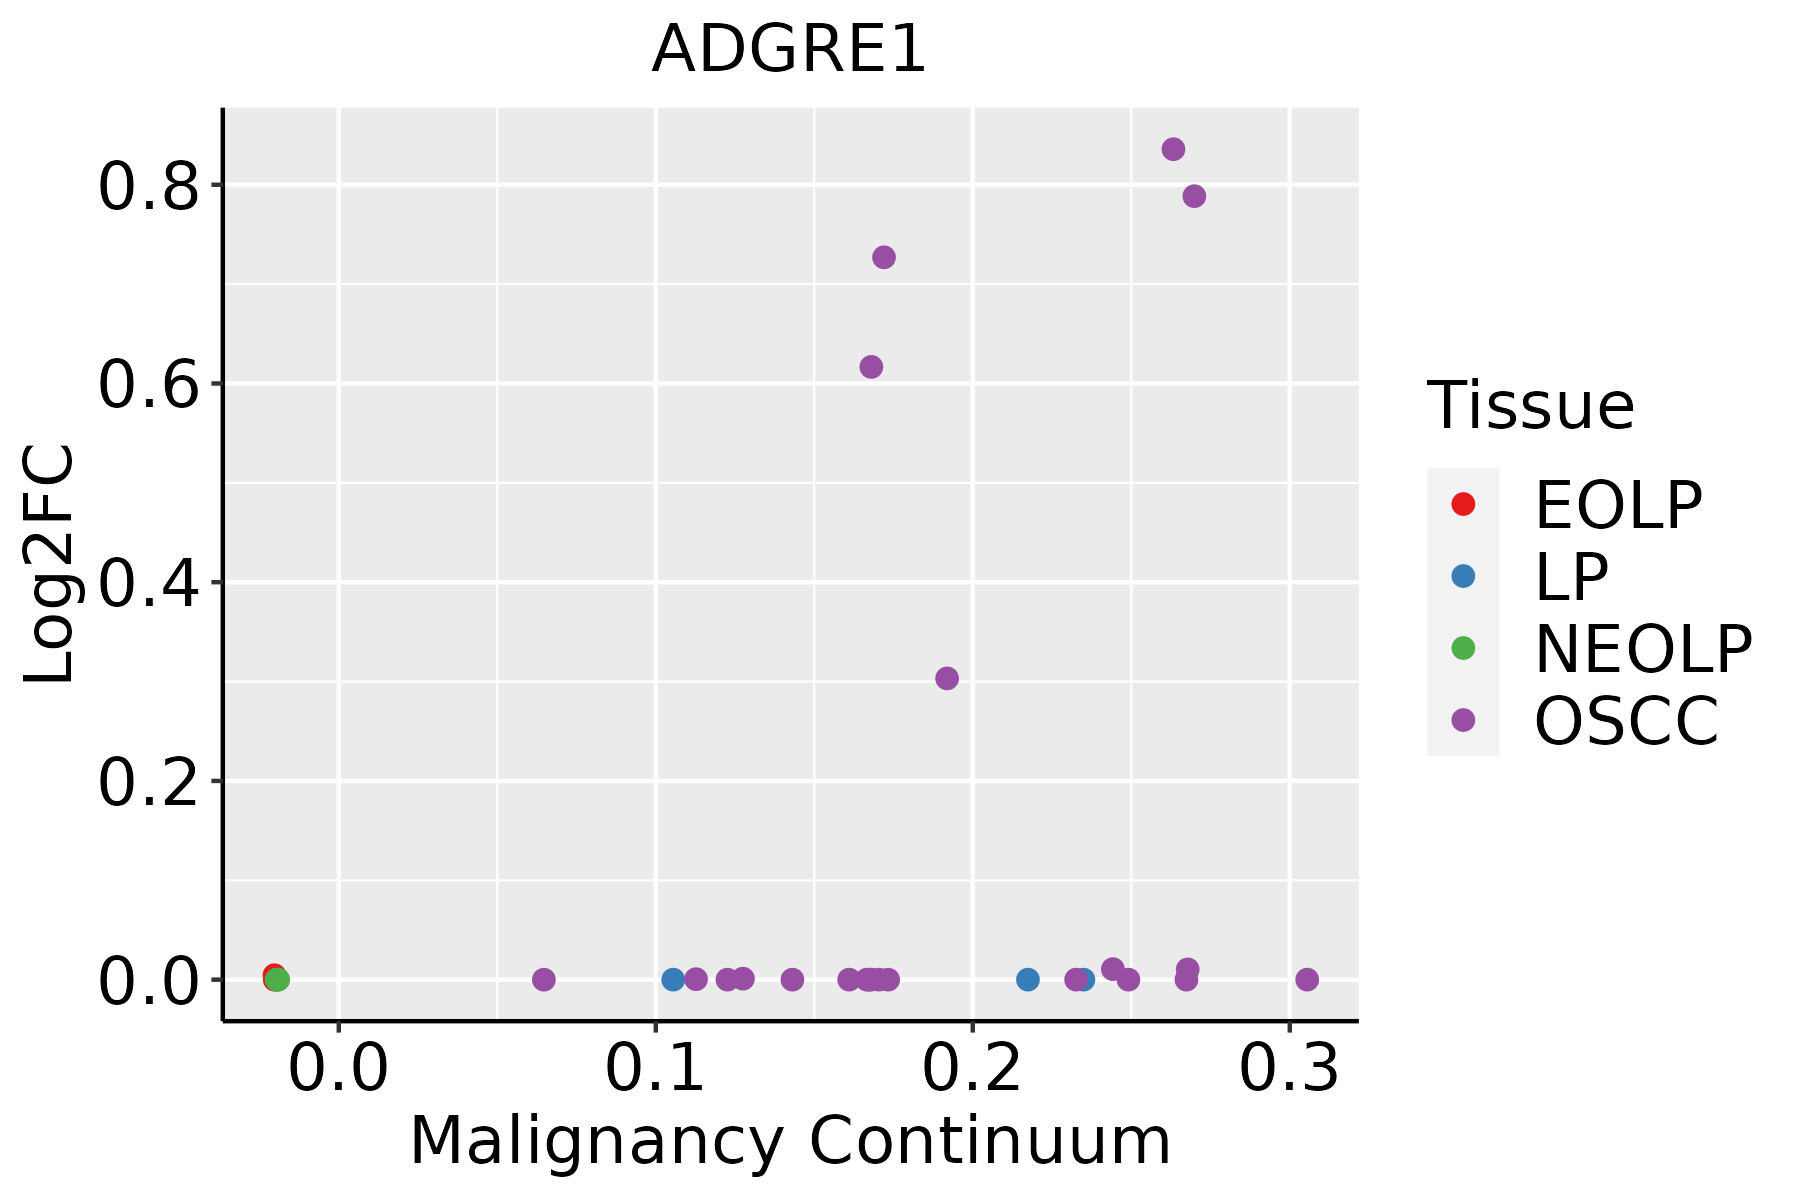 | EOLP: Erosive Oral lichen planus |
| LP: leukoplakia | ||
| NEOLP: Non-erosive oral lichen planus | ||
| OSCC: Oral squamous cell carcinoma | ||
| Thyroid | 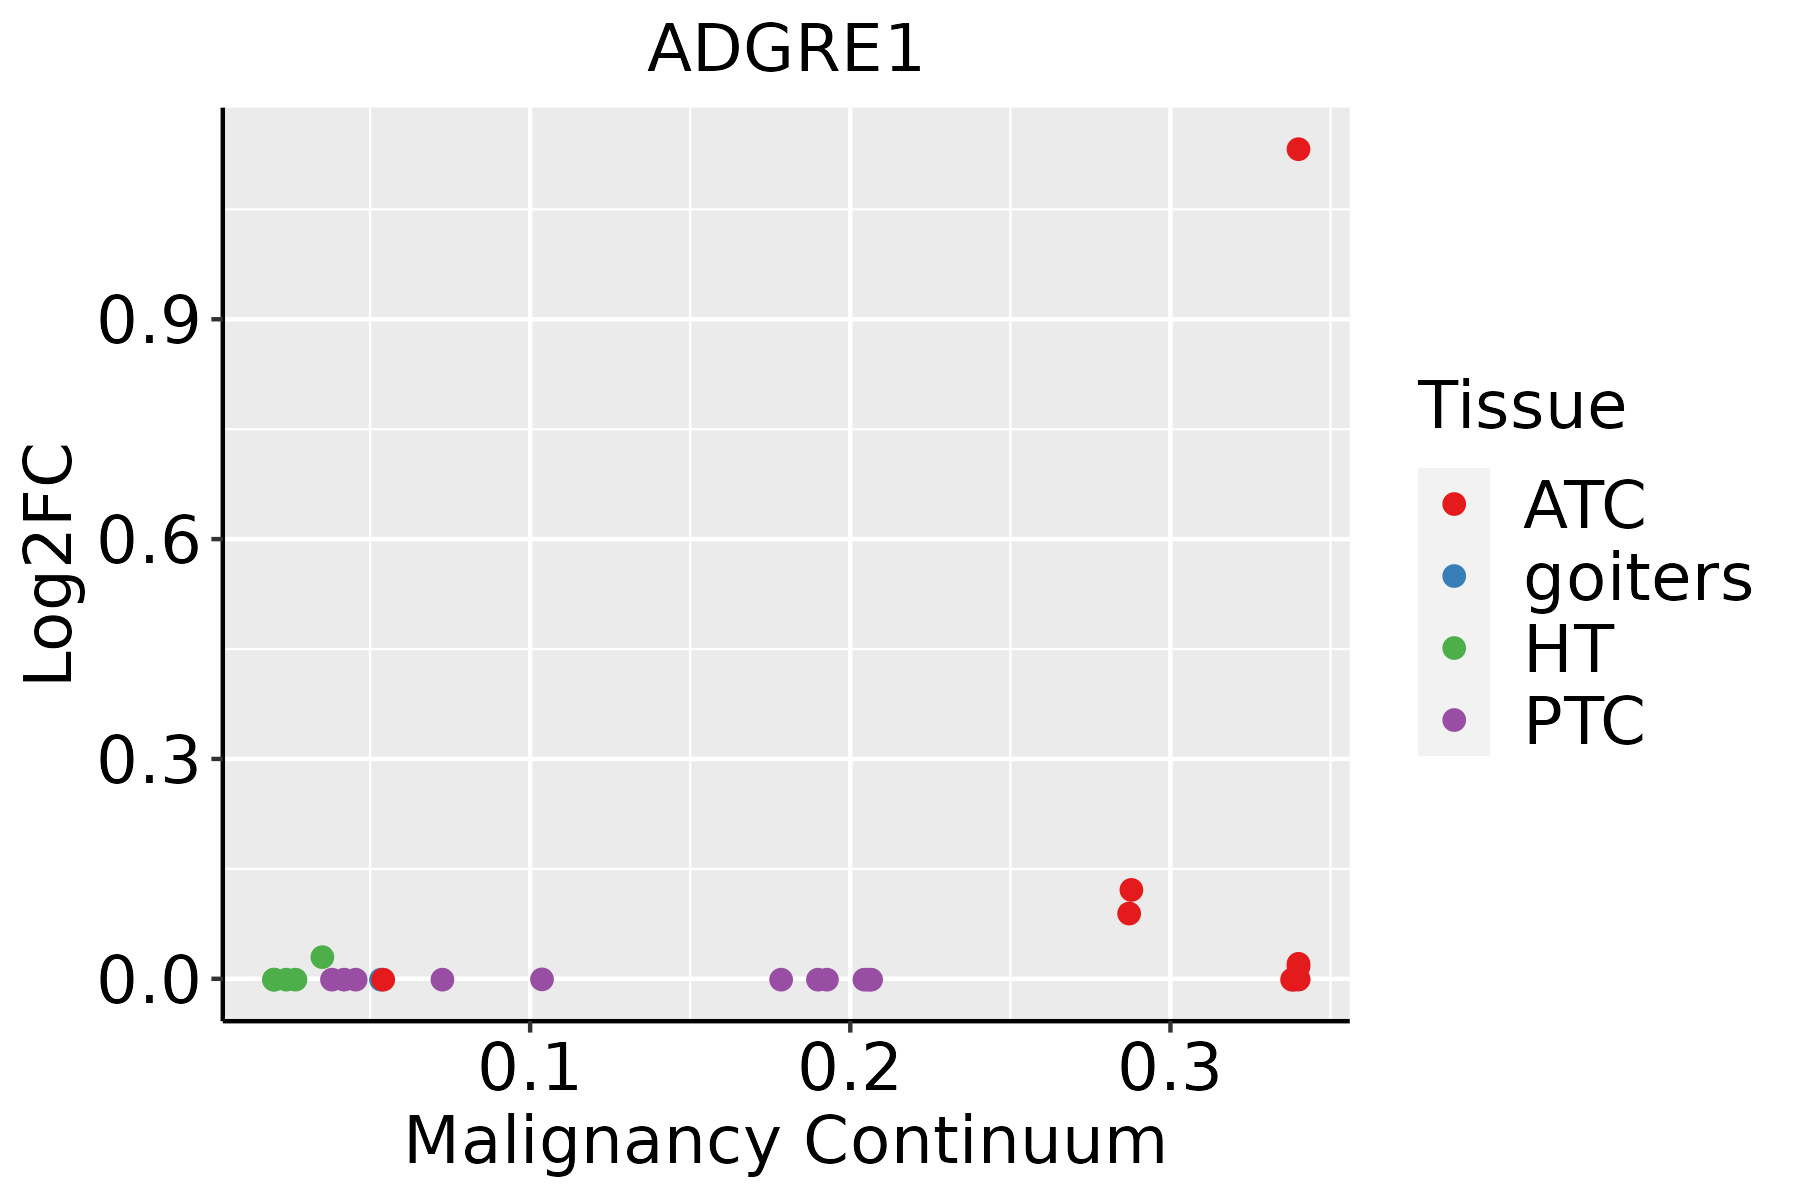 | ATC: Anaplastic thyroid cancer |
| HT: Hashimoto's thyroiditis | ||
| PTC: Papillary thyroid cancer |
| ∗log2FC in expression of this searched gene in stem-like cells from each diseased tissue sample relative to stem-like cells in normal samples in each tissue plotted against the malignancy continuum. Samples are colored based on if they are from different disease stage. |
Top |
Malignant transformation related pathway analysis |
| Find out the enriched GO biological processes and KEGG pathways involved in transition from healthy to precancer to cancer |
| Tissue | Disease Stage | Enriched GO biological Processes |
| Colorectum | AD |  |
| Colorectum | SER |  |
| Colorectum | MSS |  |
| Colorectum | MSI-H |  |
| Colorectum | FAP |  |
| ∗Top 15 enriched GO BP terms are showed in the bar plot of each disease state in each tissue. Each row represents a significant GO biological process which is colored according to the -log10(p.adjust). |
| Page: 1 2 3 4 5 6 7 8 9 |
| GO ID | Tissue | Disease Stage | Description | Gene Ratio | Bg Ratio | pvalue | p.adjust | Count |
| Page: 1 |
| Pathway ID | Tissue | Disease Stage | Description | Gene Ratio | Bg Ratio | pvalue | p.adjust | qvalue | Count |
| Page: 1 |
Top |
Cell-cell communication analysis |
| Identification of potential cell-cell interactions between two cell types and their ligand-receptor pairs for different disease states |
| Ligand | Receptor | LRpair | Pathway | Tissue | Disease Stage |
| Page: 1 |
Top |
Single-cell gene regulatory network inference analysis |
| Find out the significant the regulons (TFs) and the target genes of each regulon across cell types for different disease states |
| TF | Cell Type | Tissue | Disease Stage | Target Gene | RSS | Regulon Activity |
| ∗The dot plots of a searched regulon are shown for all cell subpopulations in each disease state of each tissue based on the regulon specific score inferred using pySCENIC and by calculating the average expression. |
| Page: 1 |
Top |
Somatic mutation of malignant transformation related genes |
| Annotation of somatic variants for genes involved in malignant transformation |
| Hugo Symbol | Variant Class | Variant Classification | dbSNP RS | HGVSc | HGVSp | HGVSp Short | SWISSPROT | BIOTYPE | SIFT | PolyPhen | Tumor Sample Barcode | Tissue | Histology | Sex | Age | Stage | Therapy Types | Drugs | Outcome |
| ADGRE1 | SNV | Missense_Mutation | c.771G>T | p.Leu257Phe | p.L257F | Q14246 | protein_coding | tolerated(0.16) | possibly_damaging(0.717) | TCGA-3C-AALK-01 | Breast | breast invasive carcinoma | Female | <65 | I/II | Chemotherapy | docetaxel | SD | |
| ADGRE1 | SNV | Missense_Mutation | rs376031317 | c.1285N>T | p.Arg429Trp | p.R429W | Q14246 | protein_coding | deleterious(0.01) | possibly_damaging(0.642) | TCGA-AN-A046-01 | Breast | breast invasive carcinoma | Female | >=65 | I/II | Unknown | Unknown | SD |
| ADGRE1 | SNV | Missense_Mutation | c.2013N>A | p.Phe671Leu | p.F671L | Q14246 | protein_coding | tolerated(0.67) | benign(0.022) | TCGA-AO-A0J6-01 | Breast | breast invasive carcinoma | Female | <65 | I/II | Chemotherapy | doxorubicin | SD | |
| ADGRE1 | SNV | Missense_Mutation | rs149695793 | c.1021N>A | p.Ala341Thr | p.A341T | Q14246 | protein_coding | tolerated(0.39) | benign(0.001) | TCGA-BH-A1EN-01 | Breast | breast invasive carcinoma | Female | >=65 | I/II | Unknown | Unknown | SD |
| ADGRE1 | SNV | Missense_Mutation | c.2077A>G | p.Met693Val | p.M693V | Q14246 | protein_coding | deleterious(0.03) | benign(0.192) | TCGA-C8-A1HJ-01 | Breast | breast invasive carcinoma | Female | <65 | I/II | Unknown | Unknown | SD | |
| ADGRE1 | SNV | Missense_Mutation | novel | c.2048N>C | p.Met683Thr | p.M683T | Q14246 | protein_coding | deleterious(0.03) | probably_damaging(0.967) | TCGA-EW-A6SC-01 | Breast | breast invasive carcinoma | Female | <65 | I/II | Hormone Therapy | aromatase | SD |
| ADGRE1 | SNV | Missense_Mutation | rs528274667 | c.818N>A | p.Arg273His | p.R273H | Q14246 | protein_coding | tolerated(0.58) | possibly_damaging(0.823) | TCGA-2W-A8YY-01 | Cervix | cervical & endocervical cancer | Female | <65 | I/II | Chemotherapy | cisplatin | CR |
| ADGRE1 | SNV | Missense_Mutation | rs376031317 | c.1285N>T | p.Arg429Trp | p.R429W | Q14246 | protein_coding | deleterious(0.01) | possibly_damaging(0.642) | TCGA-2W-A8YY-01 | Cervix | cervical & endocervical cancer | Female | <65 | I/II | Chemotherapy | cisplatin | CR |
| ADGRE1 | SNV | Missense_Mutation | novel | c.2122N>G | p.Ile708Val | p.I708V | Q14246 | protein_coding | tolerated(0.29) | probably_damaging(0.983) | TCGA-2W-A8YY-01 | Cervix | cervical & endocervical cancer | Female | <65 | I/II | Chemotherapy | cisplatin | CR |
| ADGRE1 | SNV | Missense_Mutation | c.433N>A | p.His145Asn | p.H145N | Q14246 | protein_coding | tolerated(0.68) | benign(0.022) | TCGA-AA-3819-01 | Colorectum | colon adenocarcinoma | Female | <65 | I/II | Unknown | Unknown | SD |
| Page: 1 2 3 4 5 6 7 8 9 10 11 12 13 14 |
Top |
Related drugs of malignant transformation related genes |
| Identification of chemicals and drugs interact with genes involved in malignant transfromation |
| (DGIdb 4.0) |
| Entrez ID | Symbol | Category | Interaction Types | Drug Claim Name | Drug Name | PMIDs |
| Page: 1 |

Copyright 2023-Present -The University of Texas Health Science Center at Houston |