
|
|||||
|
 | |
| |
| |
| |
| |
| |
|
Gene: ADGRB3 |
Gene summary for ADGRB3 |
| Gene information | Species | Human | Gene symbol | ADGRB3 | Gene ID | 577 |
| Gene name | adhesion G protein-coupled receptor B3 | |
| Gene Alias | BAI3 | |
| Cytomap | 6q12-q13 | |
| Gene Type | protein-coding | GO ID | GO:0000768 | UniProtAcc | O60242 |
Top |
Malignant transformation analysis |
| Identification of the aberrant gene expression in precancerous and cancerous lesions by comparing the gene expression of stem-like cells in diseased tissues with normal stem cells |
| Entrez ID | Symbol | Replicates | Species | Organ | Tissue | Adj P-value | Log2FC | Malignancy |
| 577 | ADGRB3 | C43 | Human | Oral cavity | OSCC | 7.87e-03 | -2.03e-01 | 0.1704 |
| 577 | ADGRB3 | C46 | Human | Oral cavity | OSCC | 3.44e-02 | -2.03e-01 | 0.1673 |
| 577 | ADGRB3 | C08 | Human | Oral cavity | OSCC | 1.66e-02 | -2.03e-01 | 0.1919 |
| 577 | ADGRB3 | EOLP-1 | Human | Oral cavity | EOLP | 3.49e-13 | 5.59e-01 | -0.0202 |
| 577 | ADGRB3 | NEOLP-1 | Human | Oral cavity | NEOLP | 1.44e-11 | 6.14e-01 | -0.0194 |
| 577 | ADGRB3 | NEOLP-2 | Human | Oral cavity | NEOLP | 1.64e-18 | 5.44e-01 | -0.0196 |
| 577 | ADGRB3 | NEOLP-3 | Human | Oral cavity | NEOLP | 4.99e-06 | 4.15e-01 | -0.0191 |
| 577 | ADGRB3 | SYSMH1 | Human | Oral cavity | OSCC | 1.77e-03 | -2.03e-01 | 0.1127 |
| 577 | ADGRB3 | SYSMH2 | Human | Oral cavity | OSCC | 3.73e-03 | -2.03e-01 | 0.2326 |
| 577 | ADGRB3 | SYSMH3 | Human | Oral cavity | OSCC | 3.73e-03 | -2.03e-01 | 0.2442 |
| 577 | ADGRB3 | SYSMH4 | Human | Oral cavity | OSCC | 1.66e-02 | -2.02e-01 | 0.1226 |
| 577 | ADGRB3 | SYSMH5 | Human | Oral cavity | OSCC | 1.66e-02 | -2.03e-01 | 0.0647 |
| 577 | ADGRB3 | HTA12-15-2 | Human | Pancreas | PDAC | 2.53e-12 | 7.60e-01 | 0.2315 |
| 577 | ADGRB3 | HTA12-23-1 | Human | Pancreas | PDAC | 2.93e-09 | 8.71e-01 | 0.3405 |
| 577 | ADGRB3 | HTA12-25-1 | Human | Pancreas | PDAC | 5.45e-17 | 1.05e+00 | 0.313 |
| 577 | ADGRB3 | HTA12-26-1 | Human | Pancreas | PDAC | 1.76e-26 | 1.20e+00 | 0.3728 |
| 577 | ADGRB3 | HTA12-29-1 | Human | Pancreas | PDAC | 7.59e-52 | 1.11e+00 | 0.3722 |
| 577 | ADGRB3 | HTA12-30-1 | Human | Pancreas | PDAC | 5.66e-08 | 1.26e+00 | 0.3671 |
| 577 | ADGRB3 | HTA12-9-3 | Human | Pancreas | PDAC | 7.02e-05 | 6.90e-01 | 0.2045 |
| Page: 1 |
| Tissue | Expression Dynamics | Abbreviation |
| Endometrium |  | AEH: Atypical endometrial hyperplasia |
| EEC: Endometrioid Cancer | ||
| Oral Cavity | 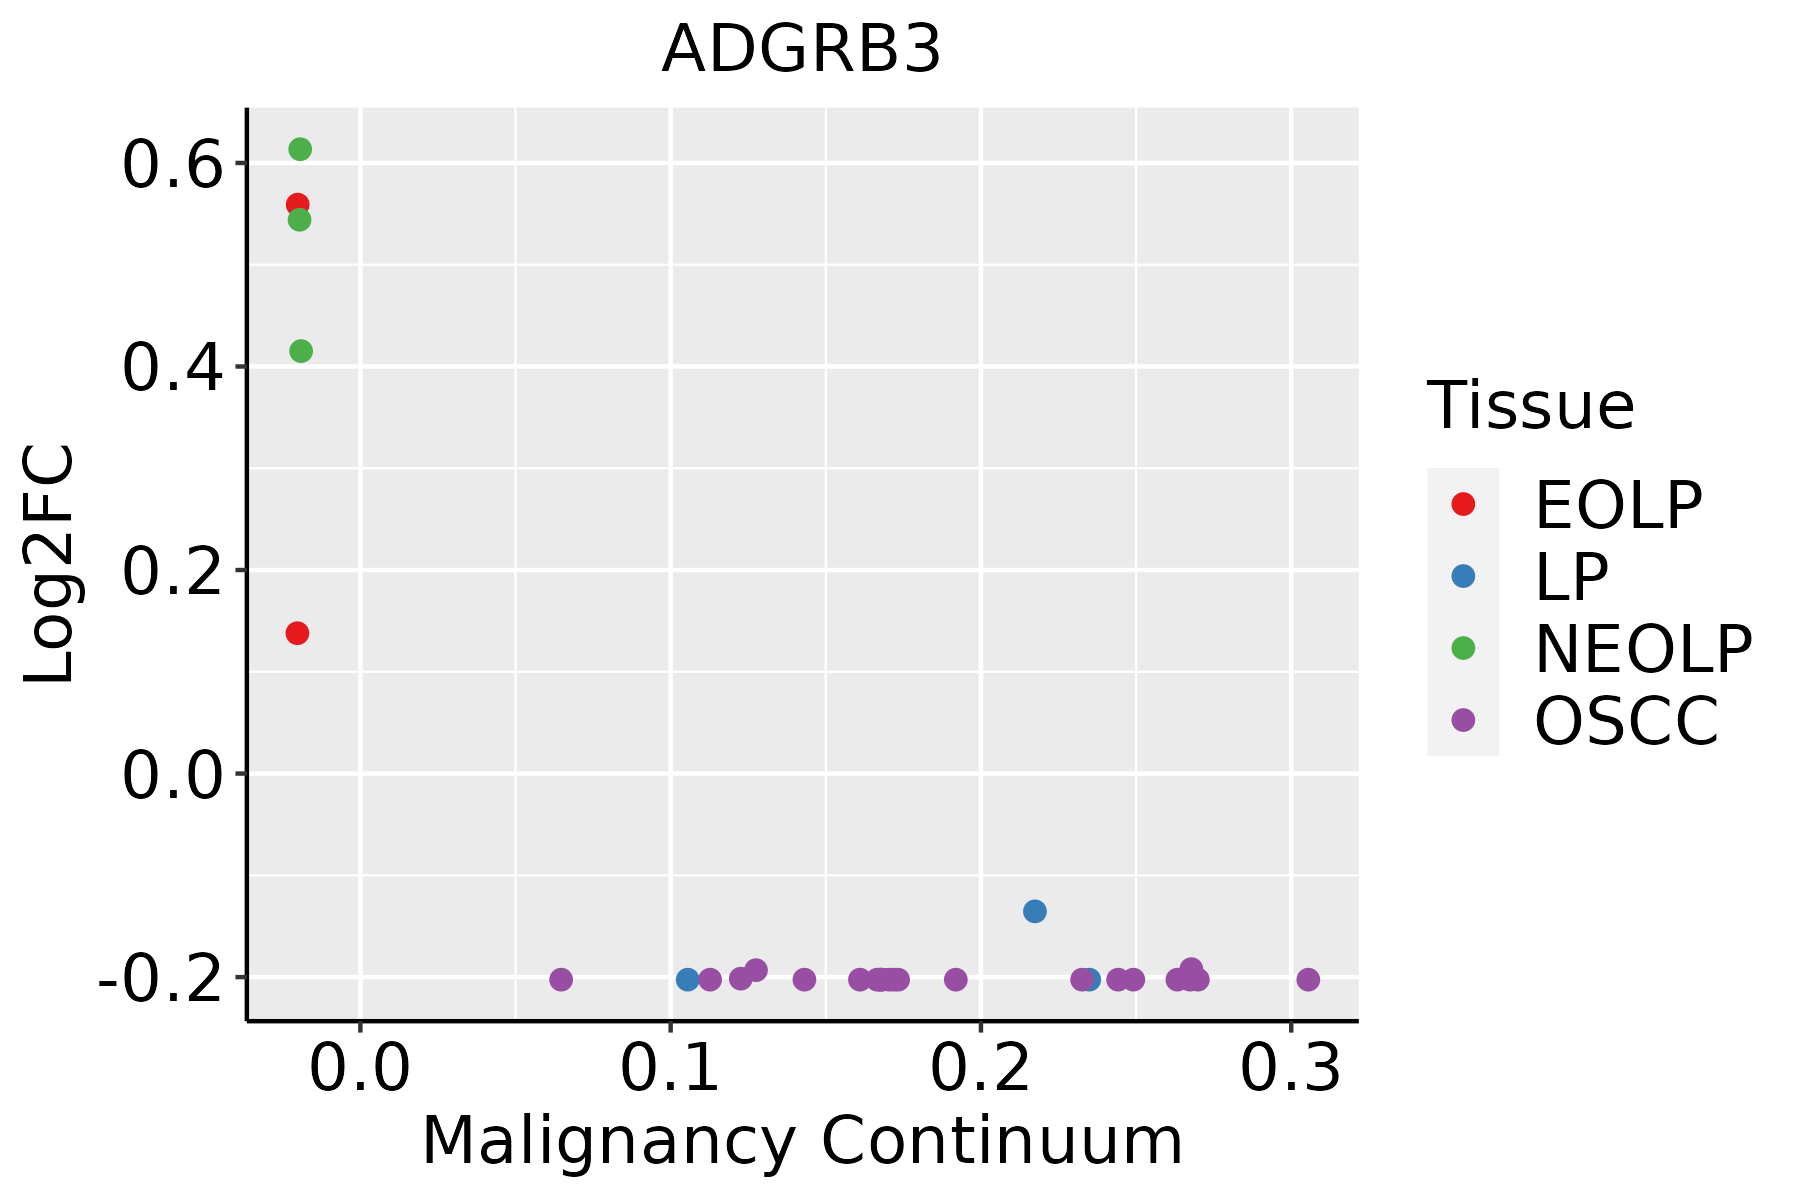 | EOLP: Erosive Oral lichen planus |
| LP: leukoplakia | ||
| NEOLP: Non-erosive oral lichen planus | ||
| OSCC: Oral squamous cell carcinoma |
| ∗log2FC in expression of this searched gene in stem-like cells from each diseased tissue sample relative to stem-like cells in normal samples in each tissue plotted against the malignancy continuum. Samples are colored based on if they are from different disease stage. |
Top |
Malignant transformation related pathway analysis |
| Find out the enriched GO biological processes and KEGG pathways involved in transition from healthy to precancer to cancer |
| Tissue | Disease Stage | Enriched GO biological Processes |
| Colorectum | AD |  |
| Colorectum | SER |  |
| Colorectum | MSS |  |
| Colorectum | MSI-H |  |
| Colorectum | FAP |  |
| ∗Top 15 enriched GO BP terms are showed in the bar plot of each disease state in each tissue. Each row represents a significant GO biological process which is colored according to the -log10(p.adjust). |
| Page: 1 2 3 4 5 6 7 8 9 |
| GO ID | Tissue | Disease Stage | Description | Gene Ratio | Bg Ratio | pvalue | p.adjust | Count |
| GO:00519624 | Oral cavity | OSCC | positive regulation of nervous system development | 135/7305 | 272/18723 | 2.20e-04 | 1.44e-03 | 135 |
| GO:001097510 | Oral cavity | OSCC | regulation of neuron projection development | 210/7305 | 445/18723 | 2.35e-04 | 1.52e-03 | 210 |
| GO:00519605 | Oral cavity | OSCC | regulation of nervous system development | 205/7305 | 443/18723 | 9.80e-04 | 5.11e-03 | 205 |
| GO:00426927 | Oral cavity | OSCC | muscle cell differentiation | 175/7305 | 384/18723 | 4.79e-03 | 1.92e-02 | 175 |
| GO:003432916 | Oral cavity | OSCC | cell junction assembly | 190/7305 | 420/18723 | 4.99e-03 | 1.96e-02 | 190 |
| GO:001635810 | Oral cavity | OSCC | dendrite development | 113/7305 | 243/18723 | 1.00e-02 | 3.49e-02 | 113 |
| GO:001635815 | Oral cavity | EOLP | dendrite development | 55/2218 | 243/18723 | 1.43e-06 | 3.42e-05 | 55 |
| GO:004269214 | Oral cavity | EOLP | muscle cell differentiation | 77/2218 | 384/18723 | 2.18e-06 | 4.91e-05 | 77 |
| GO:001097515 | Oral cavity | EOLP | regulation of neuron projection development | 86/2218 | 445/18723 | 2.75e-06 | 6.05e-05 | 86 |
| GO:00511467 | Oral cavity | EOLP | striated muscle cell differentiation | 57/2218 | 283/18723 | 3.82e-05 | 5.25e-04 | 57 |
| GO:00488137 | Oral cavity | EOLP | dendrite morphogenesis | 34/2218 | 146/18723 | 7.56e-05 | 9.19e-04 | 34 |
| GO:003432917 | Oral cavity | EOLP | cell junction assembly | 76/2218 | 420/18723 | 1.02e-04 | 1.17e-03 | 76 |
| GO:19018889 | Oral cavity | EOLP | regulation of cell junction assembly | 39/2218 | 204/18723 | 1.67e-03 | 1.11e-02 | 39 |
| GO:00007682 | Oral cavity | EOLP | syncytium formation by plasma membrane fusion | 14/2218 | 55/18723 | 4.04e-03 | 2.23e-02 | 14 |
| GO:01402532 | Oral cavity | EOLP | cell-cell fusion | 14/2218 | 55/18723 | 4.04e-03 | 2.23e-02 | 14 |
| GO:00069492 | Oral cavity | EOLP | syncytium formation | 14/2218 | 57/18723 | 5.70e-03 | 2.92e-02 | 14 |
| GO:00075202 | Oral cavity | EOLP | myoblast fusion | 11/2218 | 42/18723 | 8.21e-03 | 3.86e-02 | 11 |
| GO:19013425 | Oral cavity | EOLP | regulation of vasculature development | 56/2218 | 348/18723 | 1.05e-02 | 4.71e-02 | 56 |
| GO:00488142 | Oral cavity | EOLP | regulation of dendrite morphogenesis | 15/2218 | 67/18723 | 1.05e-02 | 4.72e-02 | 15 |
| GO:003432923 | Oral cavity | NEOLP | cell junction assembly | 88/2005 | 420/18723 | 4.18e-10 | 3.44e-08 | 88 |
| Page: 1 2 |
| Pathway ID | Tissue | Disease Stage | Description | Gene Ratio | Bg Ratio | pvalue | p.adjust | qvalue | Count |
| Page: 1 |
Top |
Cell-cell communication analysis |
| Identification of potential cell-cell interactions between two cell types and their ligand-receptor pairs for different disease states |
| Ligand | Receptor | LRpair | Pathway | Tissue | Disease Stage |
| Page: 1 |
Top |
Single-cell gene regulatory network inference analysis |
| Find out the significant the regulons (TFs) and the target genes of each regulon across cell types for different disease states |
| TF | Cell Type | Tissue | Disease Stage | Target Gene | RSS | Regulon Activity |
| ∗The dot plots of a searched regulon are shown for all cell subpopulations in each disease state of each tissue based on the regulon specific score inferred using pySCENIC and by calculating the average expression. |
| Page: 1 |
Top |
Somatic mutation of malignant transformation related genes |
| Annotation of somatic variants for genes involved in malignant transformation |
| Hugo Symbol | Variant Class | Variant Classification | dbSNP RS | HGVSc | HGVSp | HGVSp Short | SWISSPROT | BIOTYPE | SIFT | PolyPhen | Tumor Sample Barcode | Tissue | Histology | Sex | Age | Stage | Therapy Types | Drugs | Outcome |
| ADGRB3 | SNV | Missense_Mutation | c.3768G>C | p.Leu1256Phe | p.L1256F | O60242 | protein_coding | tolerated(0.57) | benign(0.033) | TCGA-A2-A04W-01 | Breast | breast invasive carcinoma | Female | <65 | I/II | Chemotherapy | cytoxan | SD | |
| ADGRB3 | SNV | Missense_Mutation | c.3905N>C | p.Arg1302Thr | p.R1302T | O60242 | protein_coding | tolerated(0.22) | benign(0.154) | TCGA-A2-A4RW-01 | Breast | breast invasive carcinoma | Female | <65 | III/IV | Unknown | Unknown | SD | |
| ADGRB3 | SNV | Missense_Mutation | rs776376254 | c.2209G>T | p.Asp737Tyr | p.D737Y | O60242 | protein_coding | deleterious(0) | probably_damaging(1) | TCGA-A8-A081-01 | Breast | breast invasive carcinoma | Female | >=65 | I/II | Unknown | Unknown | SD |
| ADGRB3 | SNV | Missense_Mutation | rs763907015 | c.41N>A | p.Thr14Asn | p.T14N | O60242 | protein_coding | tolerated(0.16) | probably_damaging(0.95) | TCGA-AC-A6IW-01 | Breast | breast invasive carcinoma | Female | >=65 | I/II | Unknown | Unknown | SD |
| ADGRB3 | SNV | Missense_Mutation | novel | c.2714A>G | p.Tyr905Cys | p.Y905C | O60242 | protein_coding | deleterious(0) | probably_damaging(0.983) | TCGA-AN-A046-01 | Breast | breast invasive carcinoma | Female | >=65 | I/II | Unknown | Unknown | SD |
| ADGRB3 | SNV | Missense_Mutation | rs368886155 | c.4217N>T | p.Thr1406Met | p.T1406M | O60242 | protein_coding | deleterious(0) | benign(0.23) | TCGA-AN-A0AK-01 | Breast | breast invasive carcinoma | Female | >=65 | I/II | Unknown | Unknown | SD |
| ADGRB3 | SNV | Missense_Mutation | c.542N>T | p.Ser181Leu | p.S181L | O60242 | protein_coding | tolerated(0.28) | benign(0) | TCGA-AN-A0XU-01 | Breast | breast invasive carcinoma | Female | <65 | I/II | Unknown | Unknown | SD | |
| ADGRB3 | SNV | Missense_Mutation | c.4138N>A | p.Pro1380Thr | p.P1380T | O60242 | protein_coding | deleterious(0.02) | possibly_damaging(0.815) | TCGA-AR-A256-01 | Breast | breast invasive carcinoma | Female | <65 | I/II | Chemotherapy | doxorubicin | PD | |
| ADGRB3 | SNV | Missense_Mutation | c.4013N>G | p.Glu1338Gly | p.E1338G | O60242 | protein_coding | tolerated(0.33) | benign(0) | TCGA-BH-A0B1-01 | Breast | breast invasive carcinoma | Female | >=65 | I/II | Chemotherapy | adriamycin | SD | |
| ADGRB3 | SNV | Missense_Mutation | novel | c.4345G>A | p.Asp1449Asn | p.D1449N | O60242 | protein_coding | deleterious(0.05) | benign(0.052) | TCGA-BH-A5IZ-01 | Breast | breast invasive carcinoma | Female | <65 | I/II | Chemotherapy | adriamycin | CR |
| Page: 1 2 3 4 5 6 7 8 9 10 11 12 13 14 15 16 17 18 19 20 21 22 23 24 25 26 27 28 29 30 31 32 33 34 35 36 37 38 39 40 41 42 43 |
Top |
Related drugs of malignant transformation related genes |
| Identification of chemicals and drugs interact with genes involved in malignant transfromation |
| (DGIdb 4.0) |
| Entrez ID | Symbol | Category | Interaction Types | Drug Claim Name | Drug Name | PMIDs |
| Page: 1 |

Copyright 2023-Present -The University of Texas Health Science Center at Houston |