Schematic overview of the cellular and molecular mechanisms involved in the cancer progression, including the proposed cellular and molecular mechanisms in cancer cells trajectory. AT1: alveolar type 1 cells; AT2: alveolar type 2 cells; AAH: atypical adenomatous hyperplasia; AIS: adenocarcinoma in situ; MIA: minimally invasive adenocarcinoma; IA: invasive adenocarcinoma; EMT: epithelial-mesenchymal transition

Home

Download

Statistics

Help

Contact

Center for Computational Systems Medicine
leaf

Gene summary

leaf

Malignant transformation analysis

leaf

Malignant transformation related pathway analysis

leaf

Cell-cell communication analysis

leaf

Single-cell gene regulatory network inference analysis

leaf

Somatic mutation of malignant transformation related genes

leaf

Related drugs of malignant transformation related genes

Gene: ADD3

Gene summary for ADD3

check button Gene summary.

Gene informationSpeciesHuman
Gene symbol

ADD3

Gene ID

120

Gene nameadducin 3
Gene AliasADDL
Cytomap10q25.1-q25.2
Gene Typeprotein-coding
GO ID

GO:0006996

UniProtAcc

Q9UEY8


Top

Malignant transformation analysis

check button Identification of the aberrant gene expression in precancerous and cancerous lesions by comparing the gene expression of stem-like cells in diseased tissues with normal stem cells
check button Malignant transformation involving gene list.
Entrez IDSymbolReplicatesSpeciesOrganTissueAdj P-valueLog2FCMalignancy
120ADD3HTA11_3410_2000001011HumanColorectumAD1.18e-02-2.84e-010.0155
120ADD3HTA11_347_2000001011HumanColorectumAD5.51e-157.65e-01-0.1954
120ADD3HTA11_4255_2000001011HumanColorectumSER9.56e-03-4.78e-020.0446
120ADD3HTA11_99999965104_69814HumanColorectumMSS1.74e-151.01e+000.281
120ADD3A015-C-203HumanColorectumFAP1.98e-28-3.57e-01-0.1294
120ADD3A014-C-040HumanColorectumFAP2.68e-02-2.15e-01-0.1184
120ADD3A002-C-201HumanColorectumFAP4.32e-08-2.94e-010.0324
120ADD3A002-C-203HumanColorectumFAP4.58e-02-2.08e-020.2786
120ADD3A001-C-119HumanColorectumFAP1.03e-02-1.56e-01-0.1557
120ADD3A001-C-108HumanColorectumFAP2.61e-14-6.26e-02-0.0272
120ADD3A002-C-205HumanColorectumFAP2.73e-18-1.67e-01-0.1236
120ADD3A015-C-005HumanColorectumFAP1.64e-03-2.94e-01-0.0336
120ADD3A015-C-006HumanColorectumFAP3.15e-12-3.85e-01-0.0994
120ADD3A015-C-106HumanColorectumFAP3.17e-09-1.76e-01-0.0511
120ADD3A002-C-114HumanColorectumFAP3.66e-18-4.67e-01-0.1561
120ADD3A015-C-104HumanColorectumFAP3.52e-36-3.34e-01-0.1899
120ADD3A001-C-014HumanColorectumFAP6.88e-15-1.93e-010.0135
120ADD3A002-C-016HumanColorectumFAP2.39e-21-1.85e-010.0521
120ADD3A015-C-002HumanColorectumFAP8.36e-12-5.50e-01-0.0763
120ADD3A001-C-203HumanColorectumFAP1.01e-08-1.23e-01-0.0481
Page: 1 2 3 4 5 6 7 8 

check button Transcriptomic changes along malignancy continuum.
TissueExpression DynamicsAbbreviation
Colorectum (GSE201348)The image shows the transcriptomic changes along malignancy continuum.log2FC in expression of this searched gene in stem-like cells from each diseased tissue sample relative to stem-like cells in normal samples in each tissue plotted against the malignancy continuum. Samples are colored based on if they are from different disease stage.FAP: Familial adenomatous polyposis
CRC: Colorectal cancer
Colorectum (HTA11)The image shows the transcriptomic changes along malignancy continuum.log2FC in expression of this searched gene in stem-like cells from each diseased tissue sample relative to stem-like cells in normal samples in each tissue plotted against the malignancy continuum. Samples are colored based on if they are from different disease stage.AD: Adenomas
SER: Sessile serrated lesions
MSI-H: Microsatellite-high colorectal cancer
MSS: Microsatellite stable colorectal cancer
EsophagusThe image shows the transcriptomic changes along malignancy continuum.log2FC in expression of this searched gene in stem-like cells from each diseased tissue sample relative to stem-like cells in normal samples in each tissue plotted against the malignancy continuum. Samples are colored based on if they are from different disease stage.
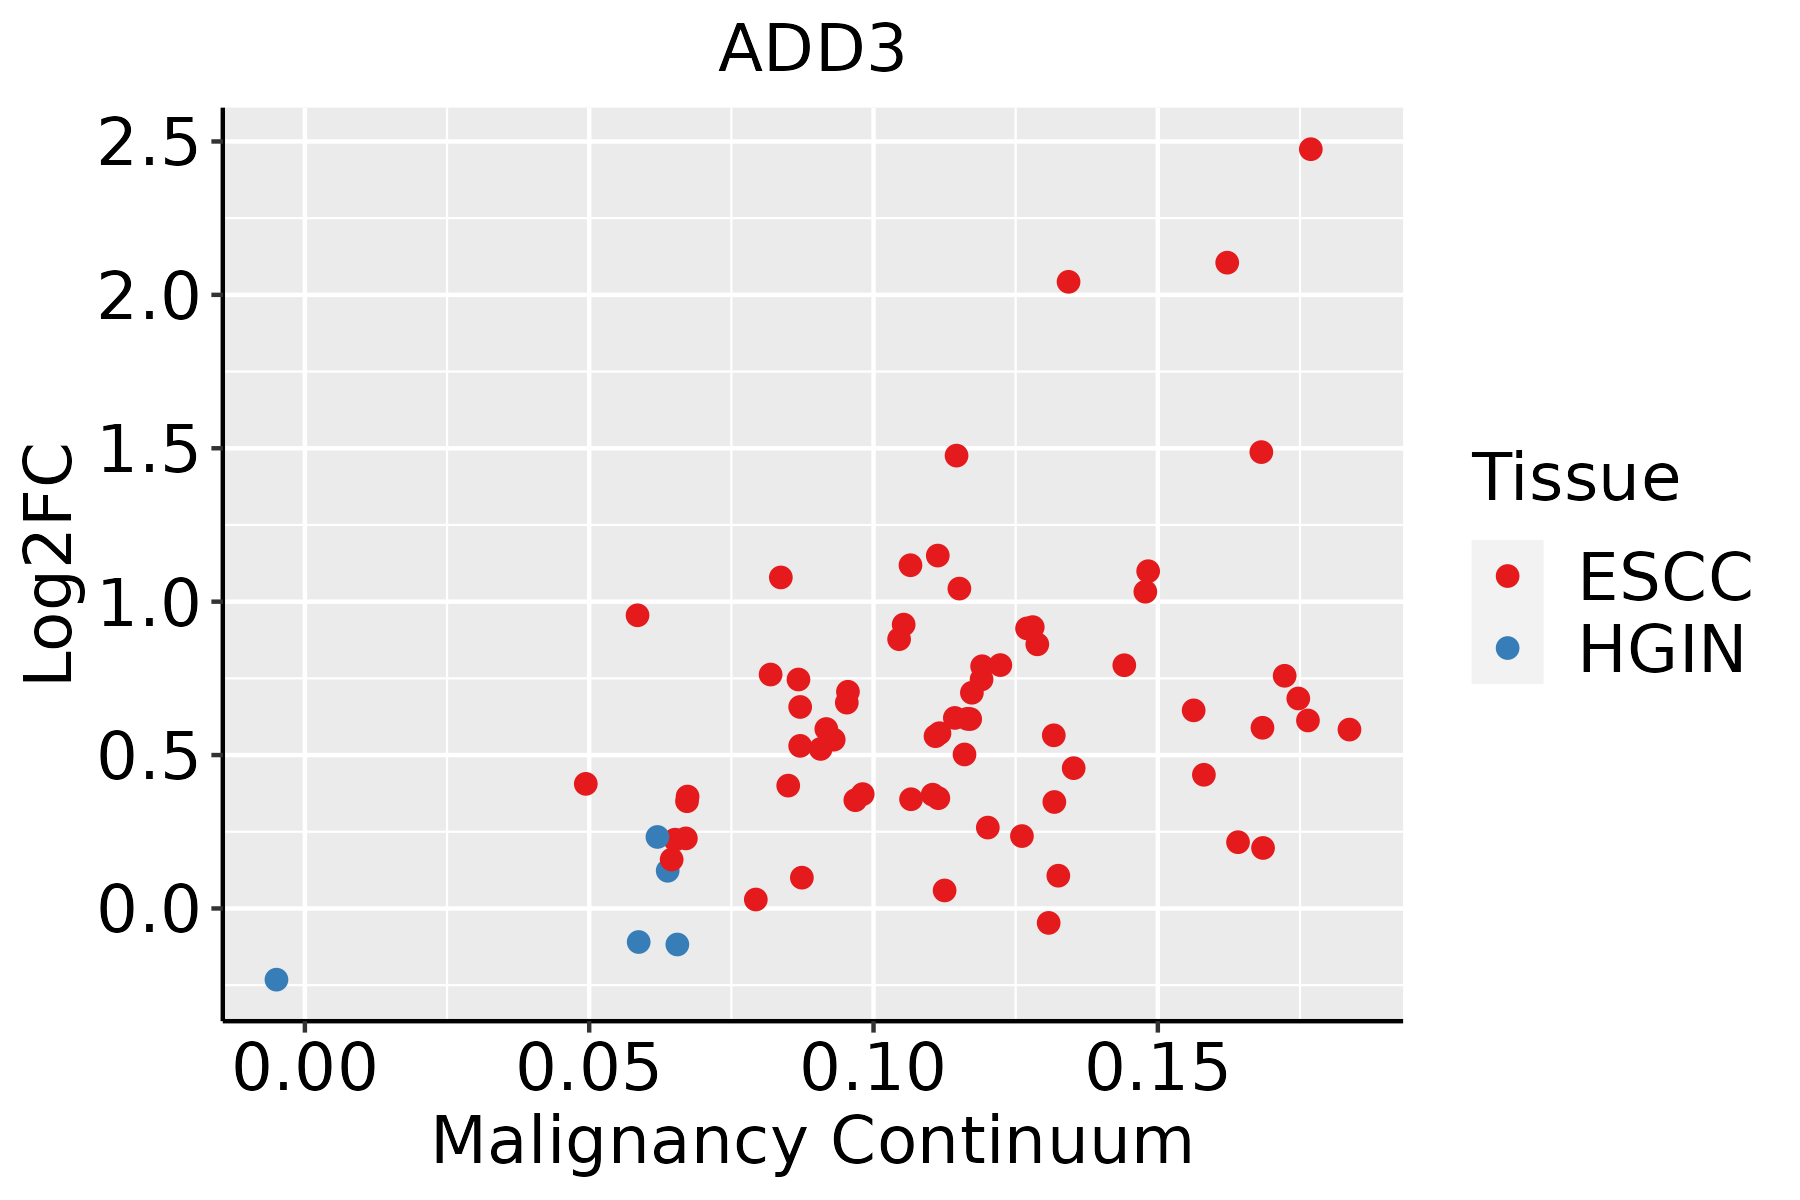
ESCC: Esophageal squamous cell carcinoma
HGIN: High-grade intraepithelial neoplasias
LGIN: Low-grade intraepithelial neoplasias
LiverThe image shows the transcriptomic changes along malignancy continuum.log2FC in expression of this searched gene in stem-like cells from each diseased tissue sample relative to stem-like cells in normal samples in each tissue plotted against the malignancy continuum. Samples are colored based on if they are from different disease stage.HCC: Hepatocellular carcinoma
NAFLD: Non-alcoholic fatty liver disease
Oral CavityThe image shows the transcriptomic changes along malignancy continuum.log2FC in expression of this searched gene in stem-like cells from each diseased tissue sample relative to stem-like cells in normal samples in each tissue plotted against the malignancy continuum. Samples are colored based on if they are from different disease stage.EOLP: Erosive Oral lichen planus
LP: leukoplakia
NEOLP: Non-erosive oral lichen planus
OSCC: Oral squamous cell carcinoma
ProstateThe image shows the transcriptomic changes along malignancy continuum.log2FC in expression of this searched gene in stem-like cells from each diseased tissue sample relative to stem-like cells in normal samples in each tissue plotted against the malignancy continuum. Samples are colored based on if they are from different disease stage.
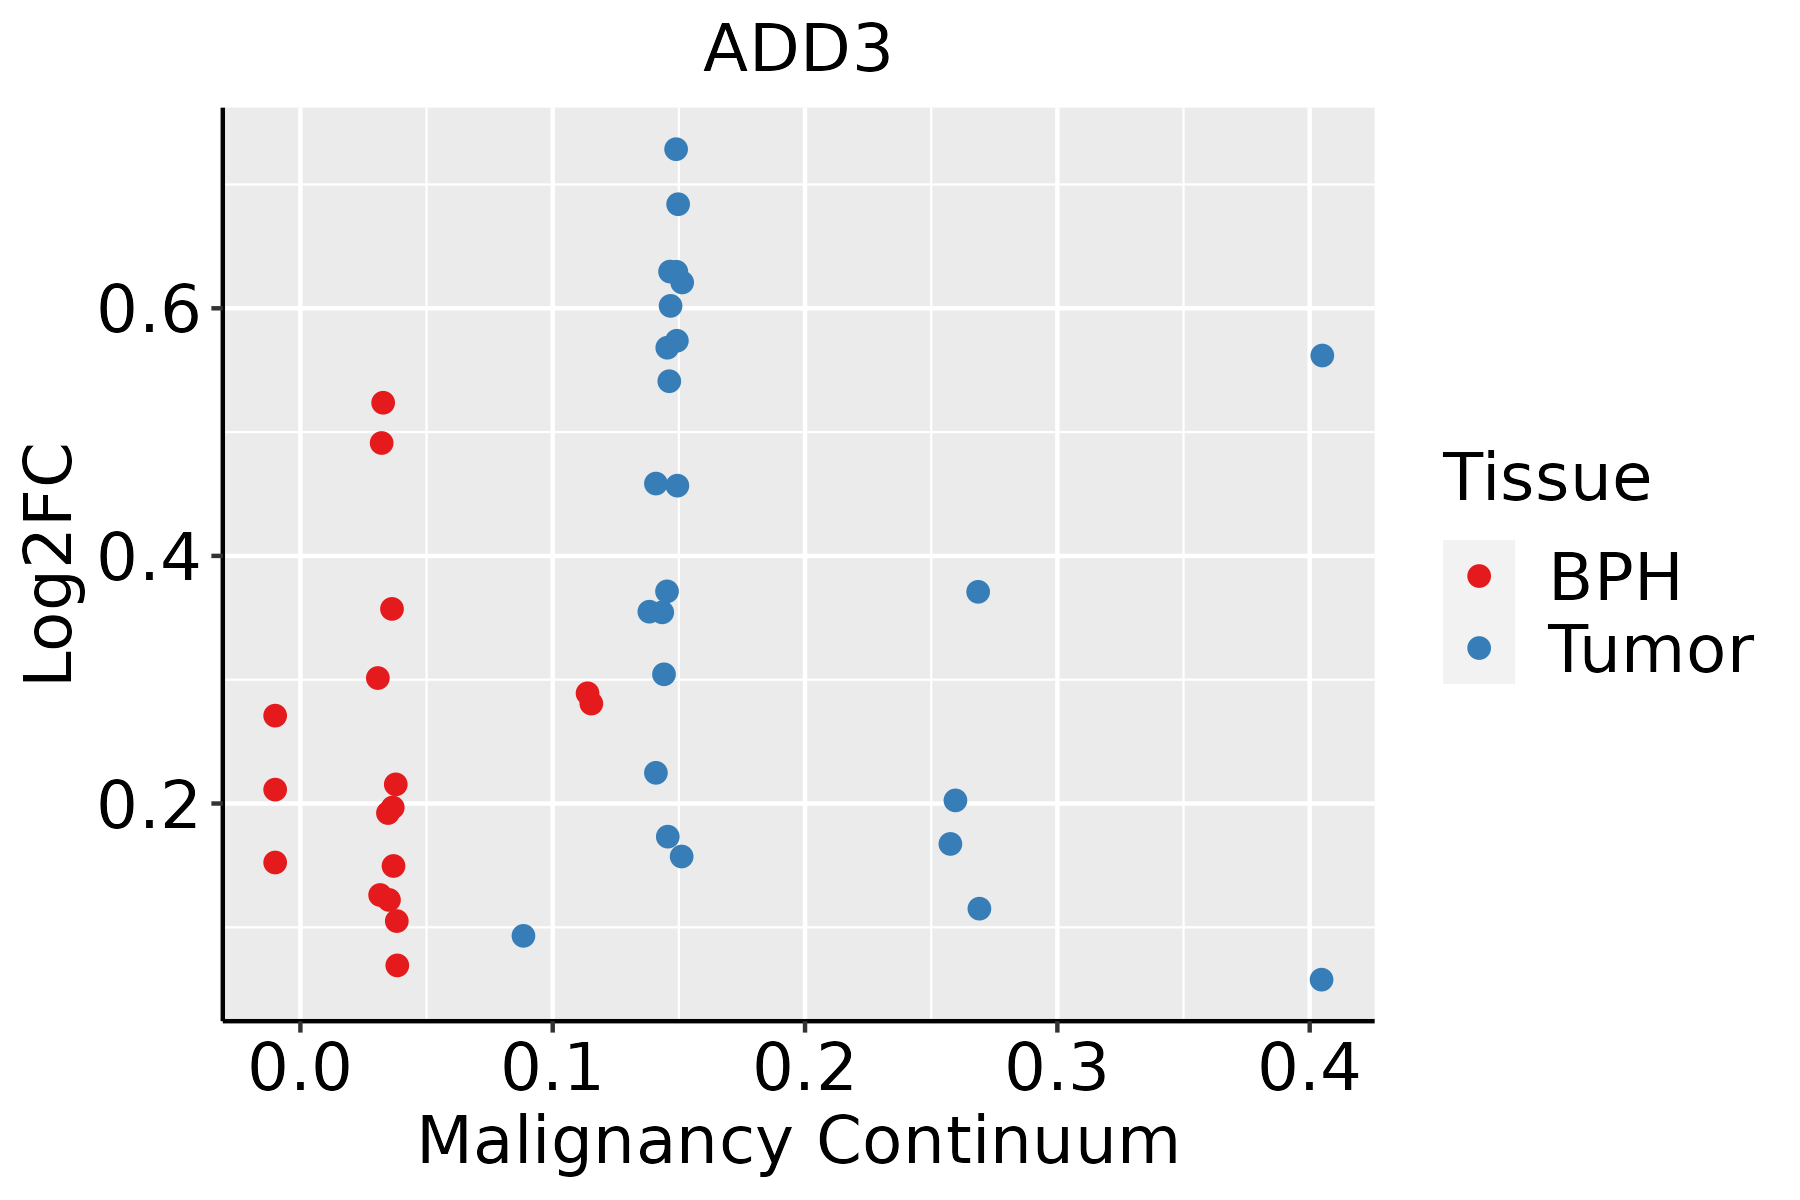
BPH: Benign Prostatic Hyperplasia
ThyroidThe image shows the transcriptomic changes along malignancy continuum.log2FC in expression of this searched gene in stem-like cells from each diseased tissue sample relative to stem-like cells in normal samples in each tissue plotted against the malignancy continuum. Samples are colored based on if they are from different disease stage.
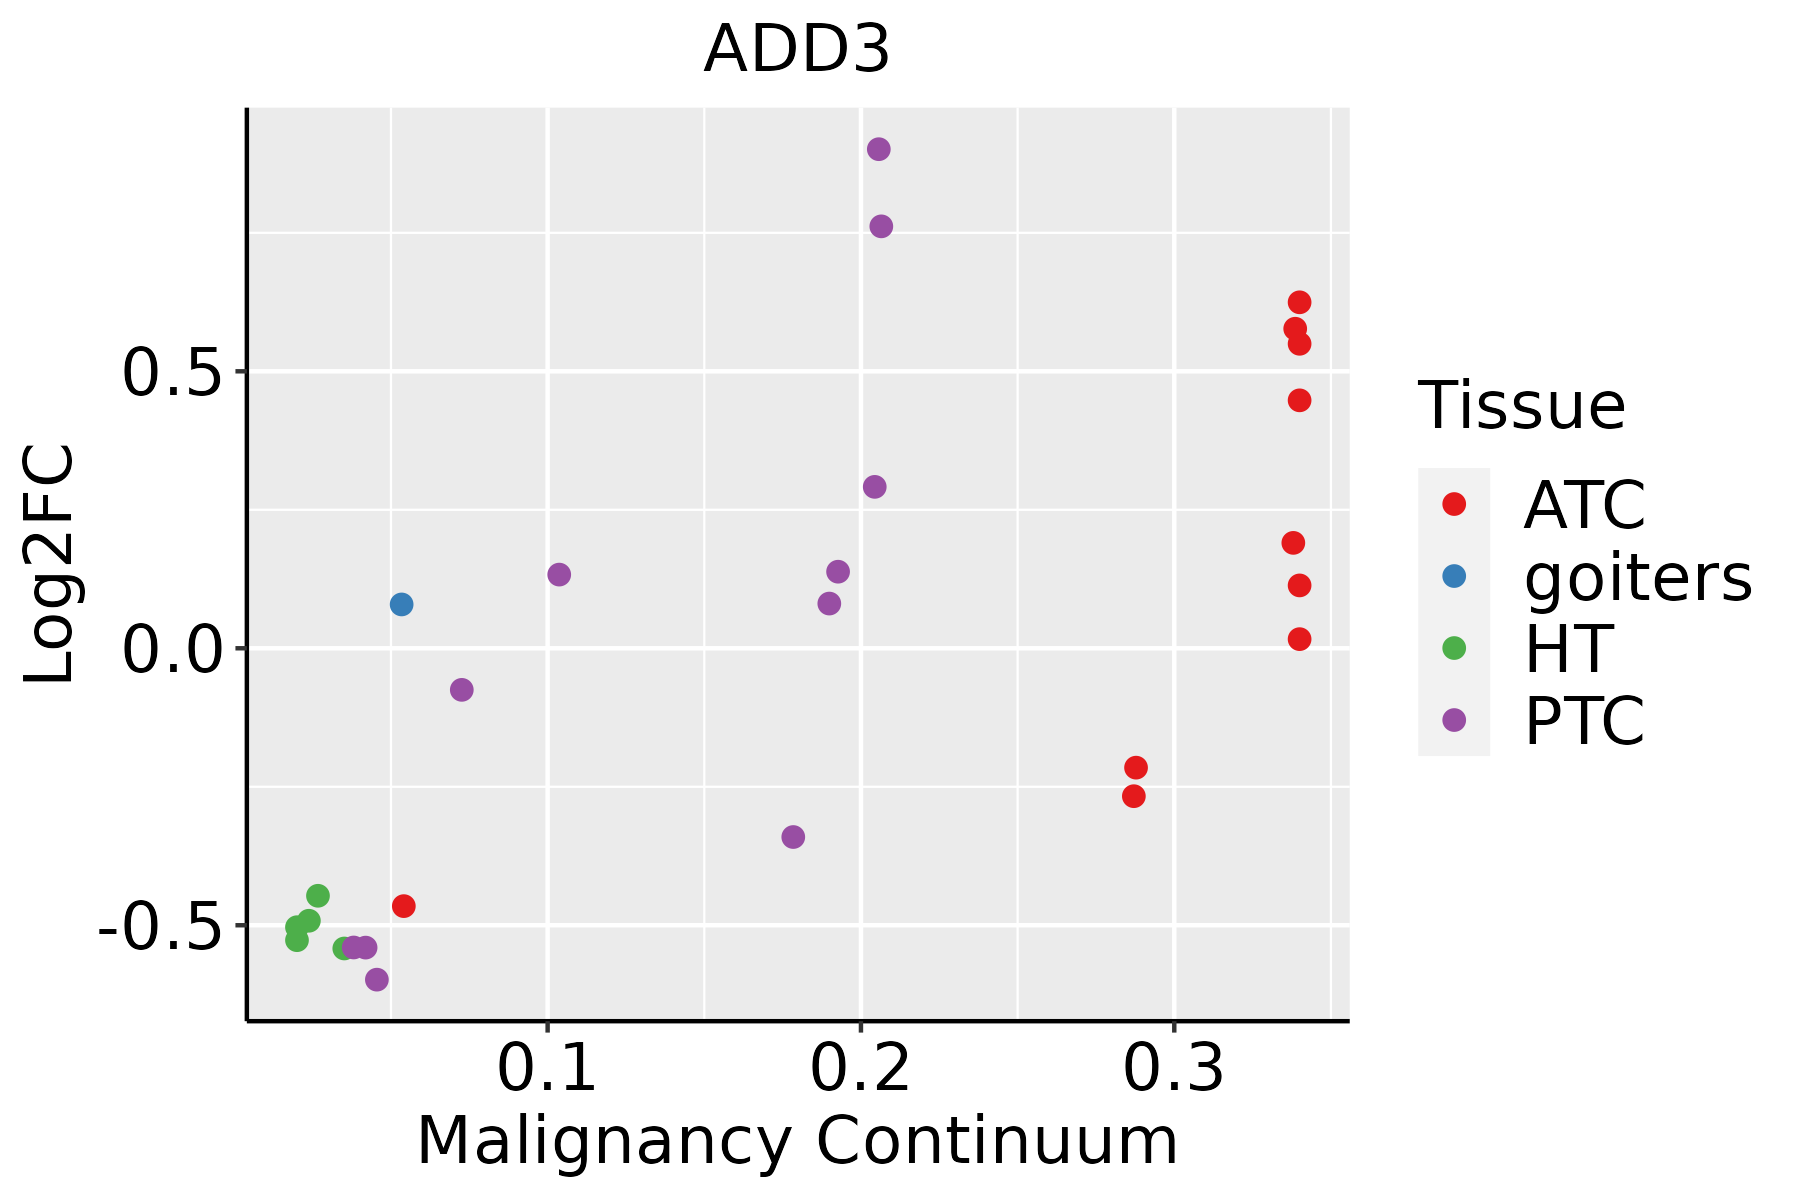
ATC: Anaplastic thyroid cancer
HT: Hashimoto's thyroiditis
PTC: Papillary thyroid cancer
∗log2FC in expression of this searched gene in stem-like cells from each diseased tissue sample relative to stem-like cells in normal samples in each tissue plotted against the malignancy continuum. Samples are colored based on if they are from different disease stage.

Top

Malignant transformation related pathway analysis

check buttonFind out the enriched GO biological processes and KEGG pathways involved in transition from healthy to precancer to cancer
check button Figure of enriched GO biological processes.
TissueDisease StageEnriched GO biological Processes
ColorectumADGO analysis - Figure of enriched GO biological processes: Top 15 enriched GO BP terms are showed in the bar plot of each disease state in each tissue. Each row represents a significant GO biological process which is colored according to the -log10(p.adjust).
ColorectumSERGO analysis - Figure of enriched GO biological processes: Top 15 enriched GO BP terms are showed in the bar plot of each disease state in each tissue. Each row represents a significant GO biological process which is colored according to the -log10(p.adjust).
ColorectumMSSGO analysis - Figure of enriched GO biological processes: Top 15 enriched GO BP terms are showed in the bar plot of each disease state in each tissue. Each row represents a significant GO biological process which is colored according to the -log10(p.adjust).
ColorectumMSI-HGO analysis - Figure of enriched GO biological processes: Top 15 enriched GO BP terms are showed in the bar plot of each disease state in each tissue. Each row represents a significant GO biological process which is colored according to the -log10(p.adjust).
ColorectumFAPGO analysis - Figure of enriched GO biological processes: Top 15 enriched GO BP terms are showed in the bar plot of each disease state in each tissue. Each row represents a significant GO biological process which is colored according to the -log10(p.adjust).
∗Top 15 enriched GO BP terms are showed in the bar plot of each disease state in each tissue. Each row represents a significant GO biological process which is colored according to the -log10(p.adjust).
Page: 1 2 3 4 5 6 7 8 9 

check button Enriched GO biological processes.
GO IDTissueDisease StageDescriptionGene RatioBg Ratiopvaluep.adjustCount
GO:0007015ColorectumADactin filament organization167/3918442/187231.65e-167.94e-14167
GO:0032535ColorectumADregulation of cellular component size142/3918383/187231.74e-133.41e-11142
GO:1902903ColorectumADregulation of supramolecular fiber organization139/3918383/187232.01e-123.19e-10139
GO:0032970ColorectumADregulation of actin filament-based process142/3918397/187234.05e-125.90e-10142
GO:0110053ColorectumADregulation of actin filament organization108/3918278/187235.02e-126.98e-10108
GO:0008154ColorectumADactin polymerization or depolymerization90/3918218/187236.14e-128.23e-1090
GO:0032271ColorectumADregulation of protein polymerization94/3918233/187231.01e-111.29e-0994
GO:0030041ColorectumADactin filament polymerization81/3918191/187231.35e-111.69e-0981
GO:0051258ColorectumADprotein polymerization112/3918297/187231.85e-112.27e-09112
GO:0043254ColorectumADregulation of protein-containing complex assembly148/3918428/187232.64e-113.18e-09148
GO:0008064ColorectumADregulation of actin polymerization or depolymerization79/3918188/187234.17e-114.74e-0979
GO:0030833ColorectumADregulation of actin filament polymerization74/3918172/187234.50e-115.03e-0974
GO:0030832ColorectumADregulation of actin filament length79/3918189/187235.71e-116.27e-0979
GO:0032956ColorectumADregulation of actin cytoskeleton organization127/3918358/187231.03e-101.04e-08127
GO:0022411ColorectumADcellular component disassembly147/3918443/187238.53e-106.76e-08147
GO:0032984ColorectumADprotein-containing complex disassembly81/3918224/187239.41e-084.65e-0681
GO:0010639ColorectumADnegative regulation of organelle organization114/3918348/187231.41e-076.49e-06114
GO:0032272ColorectumADnegative regulation of protein polymerization36/391880/187231.13e-063.72e-0536
GO:0030837ColorectumADnegative regulation of actin filament polymerization30/391865/187234.59e-061.22e-0430
GO:1902904ColorectumADnegative regulation of supramolecular fiber organization60/3918167/187235.23e-061.35e-0460
Page: 1 2 3 4 5 6 7 8 9 10 11 12 13 14 15 16 17 18 19 20 21 22 

check button Enriched KEGG pathways.
Pathway IDTissueDisease StageDescriptionGene RatioBg Ratiopvaluep.adjustqvalueCount
Page: 1 

Top

Cell-cell communication analysis

check buttonIdentification of potential cell-cell interactions between two cell types and their ligand-receptor pairs for different disease states
LigandReceptorLRpairPathwayTissueDisease Stage
Page: 1 

Top

Single-cell gene regulatory network inference analysis

check buttonFind out the significant the regulons (TFs) and the target genes of each regulon across cell types for different disease states
TFCell TypeTissueDisease StageTarget GeneRSSRegulon Activity
∗The dot plots of a searched regulon are shown for all cell subpopulations in each disease state of each tissue based on the regulon specific score inferred using pySCENIC and by calculating the average expression.
Page: 1 

Top

Somatic mutation of malignant transformation related genes

check buttonAnnotation of somatic variants for genes involved in malignant transformation
Hugo SymbolVariant ClassVariant ClassificationdbSNP RSHGVScHGVSpHGVSp ShortSWISSPROTBIOTYPESIFTPolyPhenTumor Sample BarcodeTissueHistologySexAgeStageTherapy TypesDrugsOutcome
ADD3SNVMissense_Mutationnovelc.799N>Tp.Gly267Trpp.G267WQ9UEY8protein_codingdeleterious(0)probably_damaging(1)TCGA-A2-A25A-01Breastbreast invasive carcinomaFemale<65I/IIUnspecificCytoxanSD
ADD3SNVMissense_Mutationc.170G>Ap.Arg57Glnp.R57QQ9UEY8protein_codingdeleterious(0.01)probably_damaging(0.999)TCGA-AN-A0AS-01Breastbreast invasive carcinomaFemale>=65III/IVUnknownUnknownSD
ADD3SNVMissense_Mutationnovelc.1897G>Tp.Asp633Tyrp.D633YQ9UEY8protein_codingdeleterious(0)possibly_damaging(0.855)TCGA-AR-A24Q-01Breastbreast invasive carcinomaFemale<65I/IIChemotherapydoxorubicinSD
ADD3insertionIn_Frame_Insnovelc.1382_1383insGATGTATGGTTTGGCAAATGTTATTTTAGAp.Ser461delinsArgMetTyrGlyLeuAlaAsnValIleLeuAspp.S461delinsRMYGLANVILDQ9UEY8protein_codingTCGA-B6-A0I8-01Breastbreast invasive carcinomaFemale<65I/IIUnknownUnknownPD
ADD3deletionFrame_Shift_Delnovelc.398delGp.Gly133GlufsTer16p.G133Efs*16Q9UEY8protein_codingTCGA-EW-A2FV-01Breastbreast invasive carcinomaFemale<65III/IVChemotherapydocetaxelSD
ADD3SNVMissense_Mutationc.521N>Ap.Ile174Lysp.I174KQ9UEY8protein_codingdeleterious(0)probably_damaging(1)TCGA-C5-A7UH-01Cervixcervical & endocervical cancerFemale<65III/IVChemotherapycisplatinSD
ADD3SNVMissense_Mutationnovelc.808N>Ap.Glu270Lysp.E270KQ9UEY8protein_codingtolerated(0.26)benign(0.102)TCGA-EK-A2RA-01Cervixcervical & endocervical cancerFemale>=65I/IIUnknownUnknownSD
ADD3SNVMissense_Mutationc.2025N>Cp.Glu675Aspp.E675DQ9UEY8protein_codingtolerated(0.15)benign(0.003)TCGA-A6-3809-01Colorectumcolon adenocarcinomaFemale>=65I/IIUnknownUnknownSD
ADD3SNVMissense_Mutationc.1207N>Tp.Asp403Tyrp.D403YQ9UEY8protein_codingdeleterious(0)probably_damaging(0.992)TCGA-A6-5665-01Colorectumcolon adenocarcinomaFemale>=65I/IIUnknownUnknownPD
ADD3SNVMissense_Mutationc.596T>Cp.Val199Alap.V199AQ9UEY8protein_codingdeleterious(0)probably_damaging(0.932)TCGA-A6-6781-01Colorectumcolon adenocarcinomaMale<65III/IVChemotherapyoxaliplatinSD
Page: 1 2 3 4 5 6 7 8 

Top

Related drugs of malignant transformation related genes

check buttonIdentification of chemicals and drugs interact with genes involved in malignant transfromation
(DGIdb 4.0)
Entrez IDSymbolCategoryInteraction TypesDrug Claim NameDrug NamePMIDs
Page: 1