
|
|||||
|
 | |
| |
| |
| |
| |
| |
|
Gene: ADCK2 |
Gene summary for ADCK2 |
| Gene information | Species | Human | Gene symbol | ADCK2 | Gene ID | 90956 |
| Gene name | aarF domain containing kinase 2 | |
| Gene Alias | AARF | |
| Cytomap | 7q34 | |
| Gene Type | protein-coding | GO ID | GO:0006464 | UniProtAcc | A4D1T6 |
Top |
Malignant transformation analysis |
| Identification of the aberrant gene expression in precancerous and cancerous lesions by comparing the gene expression of stem-like cells in diseased tissues with normal stem cells |
| Entrez ID | Symbol | Replicates | Species | Organ | Tissue | Adj P-value | Log2FC | Malignancy |
| 90956 | ADCK2 | C04 | Human | Oral cavity | OSCC | 5.33e-06 | 2.83e-01 | 0.2633 |
| 90956 | ADCK2 | C21 | Human | Oral cavity | OSCC | 4.77e-12 | 3.53e-01 | 0.2678 |
| 90956 | ADCK2 | C30 | Human | Oral cavity | OSCC | 8.66e-24 | 8.13e-01 | 0.3055 |
| 90956 | ADCK2 | C43 | Human | Oral cavity | OSCC | 1.71e-09 | 2.56e-01 | 0.1704 |
| 90956 | ADCK2 | C46 | Human | Oral cavity | OSCC | 4.37e-13 | 3.20e-01 | 0.1673 |
| 90956 | ADCK2 | C51 | Human | Oral cavity | OSCC | 5.38e-09 | 3.87e-01 | 0.2674 |
| 90956 | ADCK2 | C06 | Human | Oral cavity | OSCC | 3.12e-02 | 4.20e-01 | 0.2699 |
| 90956 | ADCK2 | C08 | Human | Oral cavity | OSCC | 9.84e-24 | 5.26e-01 | 0.1919 |
| 90956 | ADCK2 | C09 | Human | Oral cavity | OSCC | 4.58e-07 | 1.91e-01 | 0.1431 |
| 90956 | ADCK2 | LN46 | Human | Oral cavity | OSCC | 3.39e-07 | 2.81e-01 | 0.1666 |
| 90956 | ADCK2 | LP15 | Human | Oral cavity | LP | 2.31e-02 | 4.38e-01 | 0.2174 |
| 90956 | ADCK2 | SYSMH1 | Human | Oral cavity | OSCC | 5.10e-07 | 1.99e-01 | 0.1127 |
| 90956 | ADCK2 | SYSMH2 | Human | Oral cavity | OSCC | 2.97e-12 | 3.35e-01 | 0.2326 |
| 90956 | ADCK2 | SYSMH3 | Human | Oral cavity | OSCC | 3.03e-03 | 2.13e-01 | 0.2442 |
| 90956 | ADCK2 | male-WTA | Human | Thyroid | PTC | 7.21e-03 | 7.91e-02 | 0.1037 |
| 90956 | ADCK2 | PTC01 | Human | Thyroid | PTC | 1.14e-03 | 1.29e-01 | 0.1899 |
| 90956 | ADCK2 | PTC04 | Human | Thyroid | PTC | 5.99e-03 | 9.48e-02 | 0.1927 |
| 90956 | ADCK2 | PTC05 | Human | Thyroid | PTC | 4.36e-13 | 3.02e-01 | 0.2065 |
| 90956 | ADCK2 | PTC06 | Human | Thyroid | PTC | 2.83e-16 | 2.64e-01 | 0.2057 |
| 90956 | ADCK2 | PTC07 | Human | Thyroid | PTC | 2.60e-12 | 2.31e-01 | 0.2044 |
| Page: 1 2 |
| Tissue | Expression Dynamics | Abbreviation |
| Oral Cavity | 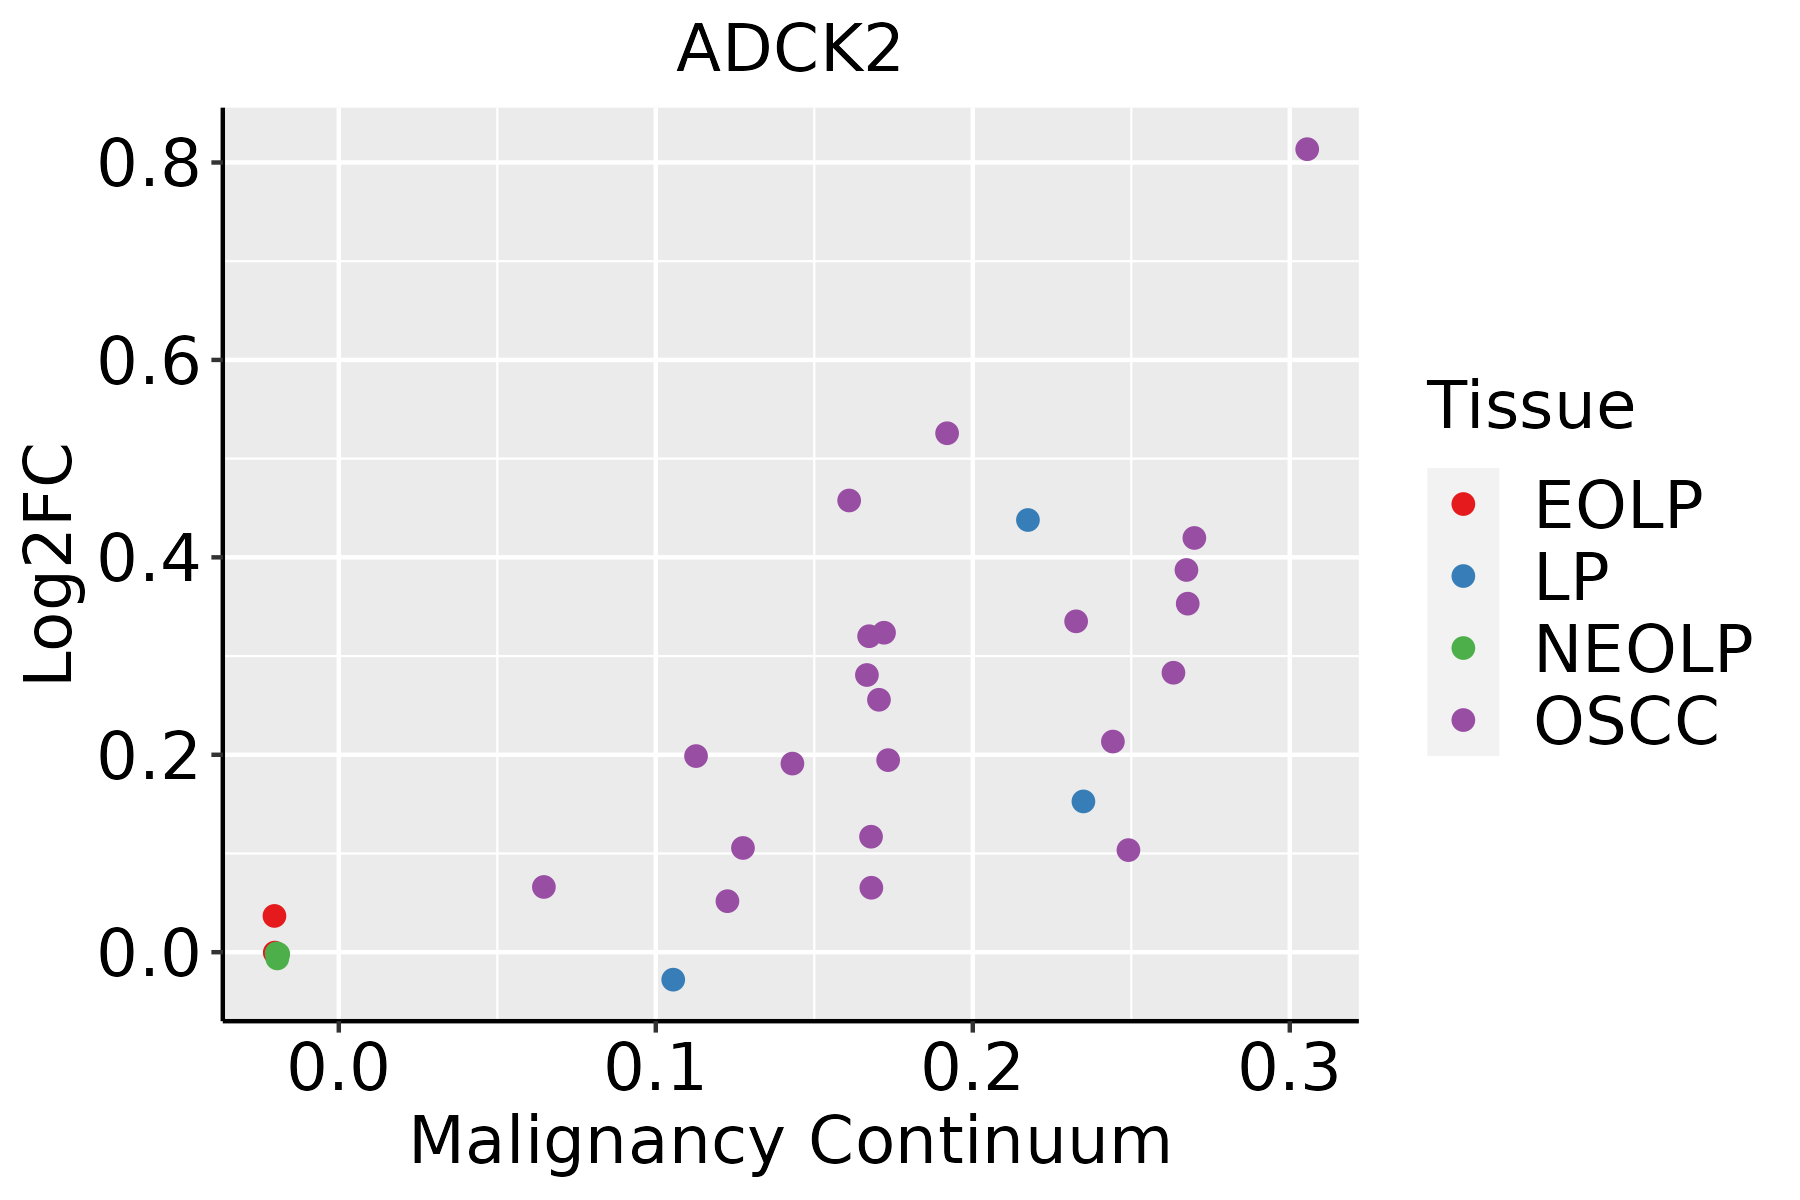 | EOLP: Erosive Oral lichen planus |
| LP: leukoplakia | ||
| NEOLP: Non-erosive oral lichen planus | ||
| OSCC: Oral squamous cell carcinoma | ||
| Thyroid |  | ATC: Anaplastic thyroid cancer |
| HT: Hashimoto's thyroiditis | ||
| PTC: Papillary thyroid cancer |
| ∗log2FC in expression of this searched gene in stem-like cells from each diseased tissue sample relative to stem-like cells in normal samples in each tissue plotted against the malignancy continuum. Samples are colored based on if they are from different disease stage. |
Top |
Malignant transformation related pathway analysis |
| Find out the enriched GO biological processes and KEGG pathways involved in transition from healthy to precancer to cancer |
| Tissue | Disease Stage | Enriched GO biological Processes |
| Colorectum | AD |  |
| Colorectum | SER |  |
| Colorectum | MSS |  |
| Colorectum | MSI-H |  |
| Colorectum | FAP |  |
| ∗Top 15 enriched GO BP terms are showed in the bar plot of each disease state in each tissue. Each row represents a significant GO biological process which is colored according to the -log10(p.adjust). |
| Page: 1 2 3 4 5 6 7 8 9 |
| GO ID | Tissue | Disease Stage | Description | Gene Ratio | Bg Ratio | pvalue | p.adjust | Count |
| Page: 1 |
| Pathway ID | Tissue | Disease Stage | Description | Gene Ratio | Bg Ratio | pvalue | p.adjust | qvalue | Count |
| Page: 1 |
Top |
Cell-cell communication analysis |
| Identification of potential cell-cell interactions between two cell types and their ligand-receptor pairs for different disease states |
| Ligand | Receptor | LRpair | Pathway | Tissue | Disease Stage |
| Page: 1 |
Top |
Single-cell gene regulatory network inference analysis |
| Find out the significant the regulons (TFs) and the target genes of each regulon across cell types for different disease states |
| TF | Cell Type | Tissue | Disease Stage | Target Gene | RSS | Regulon Activity |
| ∗The dot plots of a searched regulon are shown for all cell subpopulations in each disease state of each tissue based on the regulon specific score inferred using pySCENIC and by calculating the average expression. |
| Page: 1 |
Top |
Somatic mutation of malignant transformation related genes |
| Annotation of somatic variants for genes involved in malignant transformation |
| Hugo Symbol | Variant Class | Variant Classification | dbSNP RS | HGVSc | HGVSp | HGVSp Short | SWISSPROT | BIOTYPE | SIFT | PolyPhen | Tumor Sample Barcode | Tissue | Histology | Sex | Age | Stage | Therapy Types | Drugs | Outcome |
| ADCK2 | SNV | Missense_Mutation | c.601N>C | p.Glu201Gln | p.E201Q | Q7Z695 | protein_coding | tolerated(0.12) | possibly_damaging(0.548) | TCGA-AC-A23H-01 | Breast | breast invasive carcinoma | Female | >=65 | I/II | Unknown | Unknown | PD | |
| ADCK2 | SNV | Missense_Mutation | c.1364N>A | p.Gly455Asp | p.G455D | Q7Z695 | protein_coding | tolerated(0.06) | benign(0.086) | TCGA-AC-A23H-01 | Breast | breast invasive carcinoma | Female | >=65 | I/II | Unknown | Unknown | PD | |
| ADCK2 | SNV | Missense_Mutation | rs781057568 | c.1563G>C | p.Gln521His | p.Q521H | Q7Z695 | protein_coding | tolerated(0.2) | benign(0.001) | TCGA-EW-A1PB-01 | Breast | breast invasive carcinoma | Female | >=65 | III/IV | Unknown | Unknown | SD |
| ADCK2 | insertion | Nonsense_Mutation | novel | c.1464_1465insTTATAGGCGTGAGCCACCACACCCGGC | p.Leu489_Val490insTer | p.L489_V490ins* | Q7Z695 | protein_coding | TCGA-A8-A09D-01 | Breast | breast invasive carcinoma | Female | <65 | I/II | Chemotherapy | doxorubicin | CR | ||
| ADCK2 | insertion | Frame_Shift_Ins | novel | c.1466_1467insTATTTATTTATTTTTACAA | p.Val490IlefsTer21 | p.V490Ifs*21 | Q7Z695 | protein_coding | TCGA-A8-A09D-01 | Breast | breast invasive carcinoma | Female | <65 | I/II | Chemotherapy | doxorubicin | CR | ||
| ADCK2 | SNV | Missense_Mutation | novel | c.1398G>T | p.Gln466His | p.Q466H | Q7Z695 | protein_coding | deleterious(0.04) | benign(0.336) | TCGA-2W-A8YY-01 | Cervix | cervical & endocervical cancer | Female | <65 | I/II | Chemotherapy | cisplatin | CR |
| ADCK2 | SNV | Missense_Mutation | c.920N>A | p.Ser307Tyr | p.S307Y | Q7Z695 | protein_coding | deleterious(0) | benign(0.017) | TCGA-C5-A7CH-01 | Cervix | cervical & endocervical cancer | Female | <65 | I/II | Unspecific | SD | ||
| ADCK2 | SNV | Missense_Mutation | novel | c.422N>T | p.Ser141Leu | p.S141L | Q7Z695 | protein_coding | deleterious(0) | benign(0.343) | TCGA-5M-AATE-01 | Colorectum | colon adenocarcinoma | Male | >=65 | I/II | Unknown | Unknown | PD |
| ADCK2 | SNV | Missense_Mutation | c.355N>A | p.Leu119Ile | p.L119I | Q7Z695 | protein_coding | tolerated(0.1) | possibly_damaging(0.734) | TCGA-A6-2686-01 | Colorectum | colon adenocarcinoma | Female | >=65 | I/II | Unknown | Unknown | SD | |
| ADCK2 | SNV | Missense_Mutation | c.1348N>C | p.Asn450His | p.N450H | Q7Z695 | protein_coding | deleterious(0) | probably_damaging(0.99) | TCGA-AA-A00N-01 | Colorectum | colon adenocarcinoma | Male | >=65 | I/II | Unknown | Unknown | PD |
| Page: 1 2 3 4 |
Top |
Related drugs of malignant transformation related genes |
| Identification of chemicals and drugs interact with genes involved in malignant transfromation |
| (DGIdb 4.0) |
| Entrez ID | Symbol | Category | Interaction Types | Drug Claim Name | Drug Name | PMIDs |
| Page: 1 |

Copyright 2023-Present -The University of Texas Health Science Center at Houston |