
|
|||||
|
 | |
| |
| |
| |
| |
| |
|
Gene: ADAT3 |
Gene summary for ADAT3 |
| Gene information | Species | Human | Gene symbol | ADAT3 | Gene ID | 113179 |
| Gene name | adenosine deaminase tRNA specific 3 | |
| Gene Alias | FWP005 | |
| Cytomap | 19p13.3 | |
| Gene Type | protein-coding | GO ID | GO:0006139 | UniProtAcc | Q96EY9 |
Top |
Malignant transformation analysis |
| Identification of the aberrant gene expression in precancerous and cancerous lesions by comparing the gene expression of stem-like cells in diseased tissues with normal stem cells |
| Entrez ID | Symbol | Replicates | Species | Organ | Tissue | Adj P-value | Log2FC | Malignancy |
| 113179 | ADAT3 | LZE24T | Human | Esophagus | ESCC | 3.62e-10 | 2.70e-01 | 0.0596 |
| 113179 | ADAT3 | P1T-E | Human | Esophagus | ESCC | 2.39e-04 | 3.11e-01 | 0.0875 |
| 113179 | ADAT3 | P2T-E | Human | Esophagus | ESCC | 7.65e-07 | 1.15e-01 | 0.1177 |
| 113179 | ADAT3 | P4T-E | Human | Esophagus | ESCC | 1.92e-06 | 2.14e-01 | 0.1323 |
| 113179 | ADAT3 | P8T-E | Human | Esophagus | ESCC | 5.66e-07 | 1.71e-01 | 0.0889 |
| 113179 | ADAT3 | P9T-E | Human | Esophagus | ESCC | 3.27e-14 | 3.19e-01 | 0.1131 |
| 113179 | ADAT3 | P10T-E | Human | Esophagus | ESCC | 3.69e-05 | 1.83e-01 | 0.116 |
| 113179 | ADAT3 | P11T-E | Human | Esophagus | ESCC | 1.67e-05 | 2.78e-01 | 0.1426 |
| 113179 | ADAT3 | P12T-E | Human | Esophagus | ESCC | 4.05e-10 | 2.79e-01 | 0.1122 |
| 113179 | ADAT3 | P15T-E | Human | Esophagus | ESCC | 1.89e-08 | 2.18e-01 | 0.1149 |
| 113179 | ADAT3 | P16T-E | Human | Esophagus | ESCC | 9.20e-05 | 1.01e-01 | 0.1153 |
| 113179 | ADAT3 | P20T-E | Human | Esophagus | ESCC | 2.72e-07 | 2.06e-01 | 0.1124 |
| 113179 | ADAT3 | P21T-E | Human | Esophagus | ESCC | 1.89e-04 | 1.34e-01 | 0.1617 |
| 113179 | ADAT3 | P22T-E | Human | Esophagus | ESCC | 9.86e-13 | 2.28e-01 | 0.1236 |
| 113179 | ADAT3 | P23T-E | Human | Esophagus | ESCC | 4.61e-19 | 4.66e-01 | 0.108 |
| 113179 | ADAT3 | P24T-E | Human | Esophagus | ESCC | 8.78e-09 | 2.53e-01 | 0.1287 |
| 113179 | ADAT3 | P26T-E | Human | Esophagus | ESCC | 2.74e-11 | 3.35e-01 | 0.1276 |
| 113179 | ADAT3 | P27T-E | Human | Esophagus | ESCC | 6.58e-10 | 2.75e-01 | 0.1055 |
| 113179 | ADAT3 | P28T-E | Human | Esophagus | ESCC | 6.24e-29 | 5.15e-01 | 0.1149 |
| 113179 | ADAT3 | P30T-E | Human | Esophagus | ESCC | 1.75e-14 | 5.57e-01 | 0.137 |
| Page: 1 2 3 |
| Tissue | Expression Dynamics | Abbreviation |
| Esophagus | 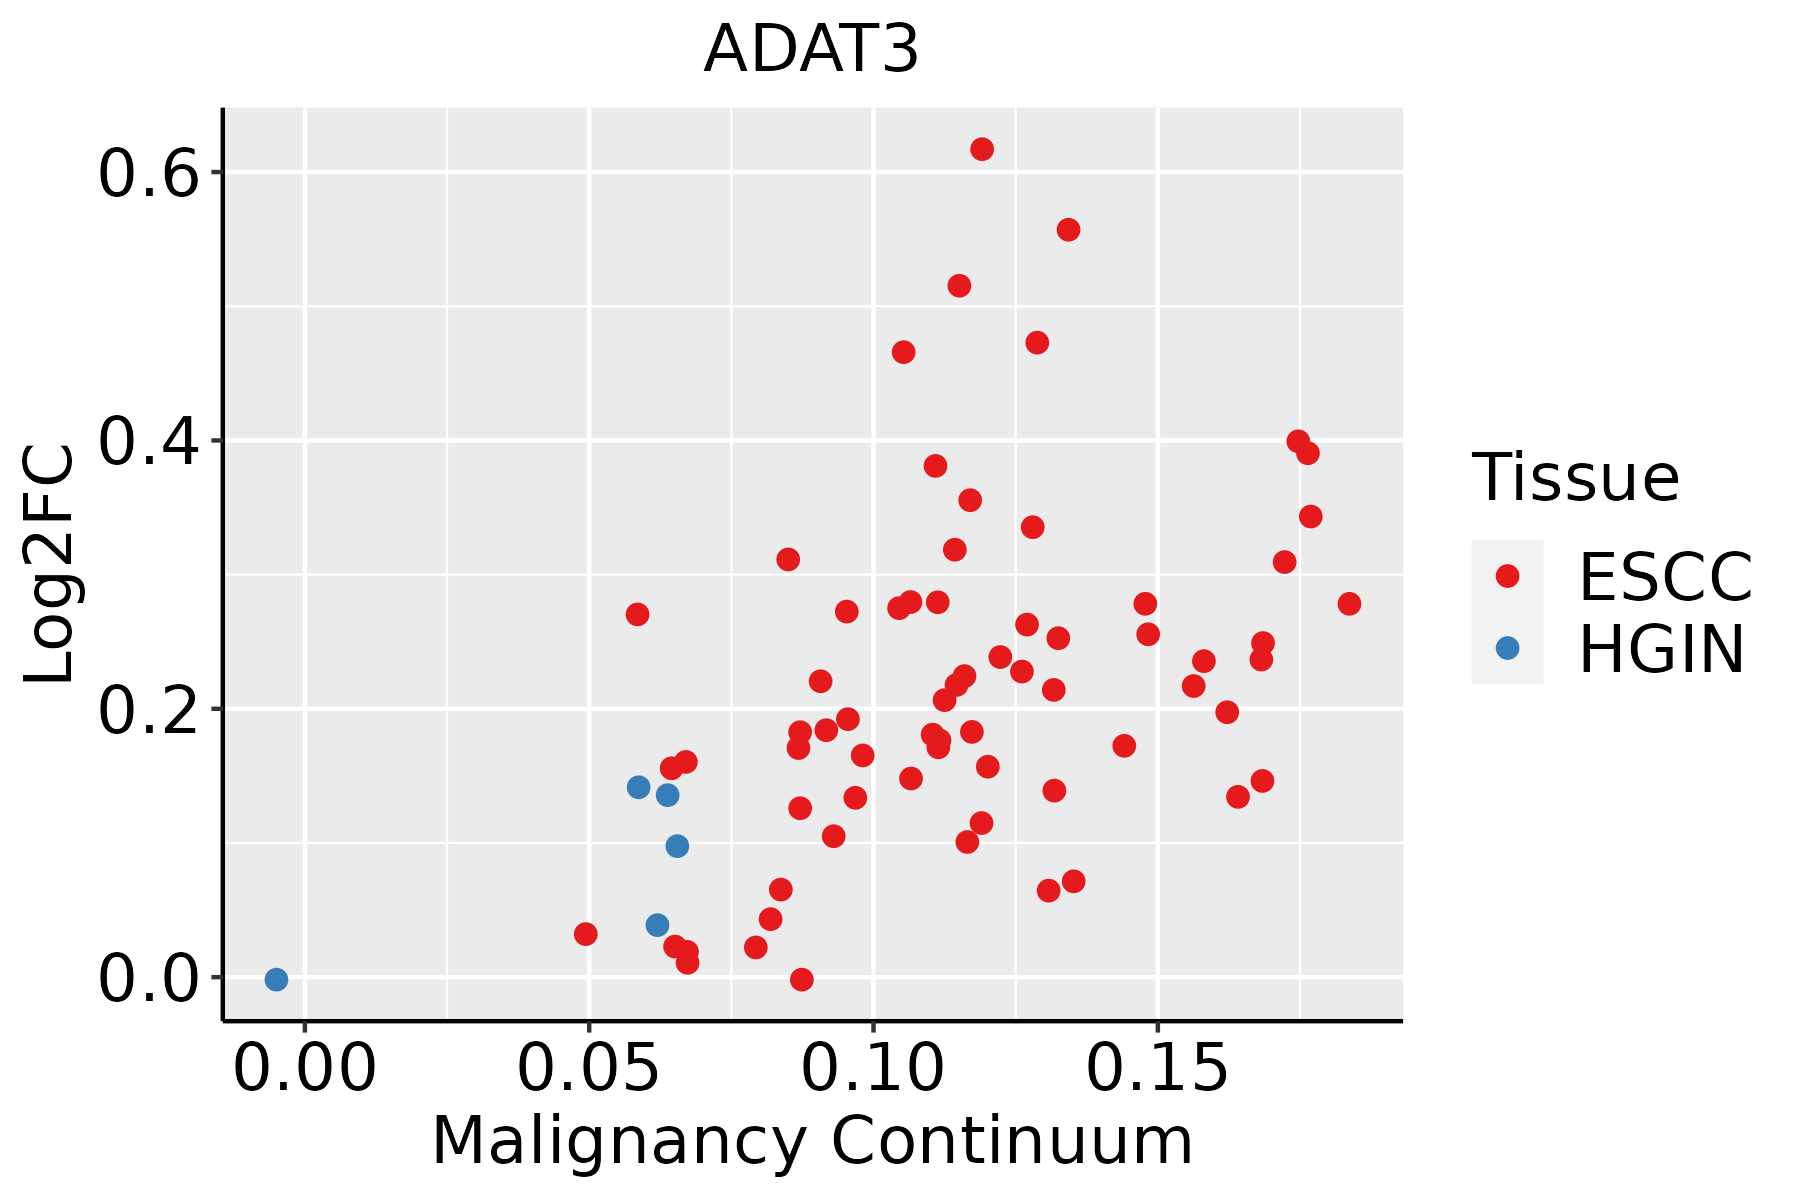 | ESCC: Esophageal squamous cell carcinoma |
| HGIN: High-grade intraepithelial neoplasias | ||
| LGIN: Low-grade intraepithelial neoplasias |
| ∗log2FC in expression of this searched gene in stem-like cells from each diseased tissue sample relative to stem-like cells in normal samples in each tissue plotted against the malignancy continuum. Samples are colored based on if they are from different disease stage. |
Top |
Malignant transformation related pathway analysis |
| Find out the enriched GO biological processes and KEGG pathways involved in transition from healthy to precancer to cancer |
| Tissue | Disease Stage | Enriched GO biological Processes |
| Colorectum | AD |  |
| Colorectum | SER |  |
| Colorectum | MSS |  |
| Colorectum | MSI-H |  |
| Colorectum | FAP |  |
| ∗Top 15 enriched GO BP terms are showed in the bar plot of each disease state in each tissue. Each row represents a significant GO biological process which is colored according to the -log10(p.adjust). |
| Page: 1 2 3 4 5 6 7 8 9 |
| GO ID | Tissue | Disease Stage | Description | Gene Ratio | Bg Ratio | pvalue | p.adjust | Count |
| GO:003447015 | Esophagus | ESCC | ncRNA processing | 300/8552 | 395/18723 | 3.09e-35 | 3.26e-32 | 300 |
| GO:003466012 | Esophagus | ESCC | ncRNA metabolic process | 346/8552 | 485/18723 | 4.35e-31 | 2.51e-28 | 346 |
| GO:00080333 | Esophagus | ESCC | tRNA processing | 92/8552 | 127/18723 | 7.83e-10 | 1.93e-08 | 92 |
| GO:00063992 | Esophagus | ESCC | tRNA metabolic process | 122/8552 | 179/18723 | 9.03e-10 | 2.19e-08 | 122 |
| Page: 1 |
| Pathway ID | Tissue | Disease Stage | Description | Gene Ratio | Bg Ratio | pvalue | p.adjust | qvalue | Count |
| Page: 1 |
Top |
Cell-cell communication analysis |
| Identification of potential cell-cell interactions between two cell types and their ligand-receptor pairs for different disease states |
| Ligand | Receptor | LRpair | Pathway | Tissue | Disease Stage |
| Page: 1 |
Top |
Single-cell gene regulatory network inference analysis |
| Find out the significant the regulons (TFs) and the target genes of each regulon across cell types for different disease states |
| TF | Cell Type | Tissue | Disease Stage | Target Gene | RSS | Regulon Activity |
| ∗The dot plots of a searched regulon are shown for all cell subpopulations in each disease state of each tissue based on the regulon specific score inferred using pySCENIC and by calculating the average expression. |
| Page: 1 |
Top |
Somatic mutation of malignant transformation related genes |
| Annotation of somatic variants for genes involved in malignant transformation |
| Hugo Symbol | Variant Class | Variant Classification | dbSNP RS | HGVSc | HGVSp | HGVSp Short | SWISSPROT | BIOTYPE | SIFT | PolyPhen | Tumor Sample Barcode | Tissue | Histology | Sex | Age | Stage | Therapy Types | Drugs | Outcome |
| ADAT3 | SNV | Missense_Mutation | novel | c.190N>T | p.Ala64Ser | p.A64S | protein_coding | deleterious(0.02) | possibly_damaging(0.726) | TCGA-A2-A3XS-01 | Breast | breast invasive carcinoma | Female | <65 | III/IV | Chemotherapy | cytoxan | PD | |
| ADAT3 | SNV | Missense_Mutation | novel | c.1043N>T | p.Arg348Leu | p.R348L | protein_coding | deleterious(0.01) | possibly_damaging(0.548) | TCGA-C5-A8XH-01 | Cervix | cervical & endocervical cancer | Female | <65 | I/II | Unknown | Unknown | SD | |
| ADAT3 | SNV | Missense_Mutation | rs773656522 | c.1030N>A | p.Asp344Asn | p.D344N | protein_coding | tolerated(0.12) | benign(0.185) | TCGA-AX-A2HC-01 | Endometrium | uterine corpus endometrioid carcinoma | Female | <65 | III/IV | Chemotherapy | paclitaxel | PD | |
| ADAT3 | SNV | Missense_Mutation | novel | c.832N>A | p.Ala278Thr | p.A278T | protein_coding | tolerated(0.55) | benign(0.131) | TCGA-B5-A11H-01 | Endometrium | uterine corpus endometrioid carcinoma | Female | >=65 | III/IV | Hormone Therapy | megace | SD | |
| ADAT3 | SNV | Missense_Mutation | novel | c.868N>A | p.Gly290Ser | p.G290S | protein_coding | tolerated(0.16) | benign(0.019) | TCGA-BG-A222-01 | Endometrium | uterine corpus endometrioid carcinoma | Female | <65 | I/II | Unknown | Unknown | SD | |
| ADAT3 | SNV | Missense_Mutation | novel | c.137N>T | p.Pro46Leu | p.P46L | protein_coding | tolerated(0.07) | probably_damaging(0.998) | TCGA-FI-A2D0-01 | Endometrium | uterine corpus endometrioid carcinoma | Female | <65 | I/II | Unknown | Unknown | SD | |
| ADAT3 | SNV | Missense_Mutation | rs756591965 | c.845N>A | p.Arg282His | p.R282H | protein_coding | tolerated(0.13) | benign(0.043) | TCGA-BB-A6UO-01 | Oral cavity | head & neck squamous cell carcinoma | Female | <65 | I/II | Unknown | Unknown | PD | |
| ADAT3 | SNV | Missense_Mutation | c.1063N>A | p.Val355Met | p.V355M | protein_coding | deleterious(0) | benign(0.396) | TCGA-BR-4361-01 | Stomach | stomach adenocarcinoma | Female | >=65 | III/IV | Unknown | Unknown | SD | ||
| ADAT3 | SNV | Missense_Mutation | c.931N>A | p.Ala311Thr | p.A311T | protein_coding | deleterious(0) | probably_damaging(0.976) | TCGA-BR-8361-01 | Stomach | stomach adenocarcinoma | Female | >=65 | III/IV | Unknown | Unknown | SD | ||
| ADAT3 | SNV | Missense_Mutation | novel | c.1027C>T | p.Pro343Ser | p.P343S | protein_coding | tolerated(0.13) | benign(0.056) | TCGA-CG-5721-01 | Stomach | stomach adenocarcinoma | Male | <65 | III/IV | Unknown | Unknown | SD |
| Page: 1 2 |
Top |
Related drugs of malignant transformation related genes |
| Identification of chemicals and drugs interact with genes involved in malignant transfromation |
| (DGIdb 4.0) |
| Entrez ID | Symbol | Category | Interaction Types | Drug Claim Name | Drug Name | PMIDs |
| Page: 1 |

Copyright 2023-Present -The University of Texas Health Science Center at Houston |