
|
|||||
|
 | |
| |
| |
| |
| |
| |
|
Gene: ADAT2 |
Gene summary for ADAT2 |
| Gene information | Species | Human | Gene symbol | ADAT2 | Gene ID | 134637 |
| Gene name | adenosine deaminase tRNA specific 2 | |
| Gene Alias | DEADC1 | |
| Cytomap | 6q24.2 | |
| Gene Type | protein-coding | GO ID | GO:0002097 | UniProtAcc | Q7Z6V5 |
Top |
Malignant transformation analysis |
| Identification of the aberrant gene expression in precancerous and cancerous lesions by comparing the gene expression of stem-like cells in diseased tissues with normal stem cells |
| Entrez ID | Symbol | Replicates | Species | Organ | Tissue | Adj P-value | Log2FC | Malignancy |
| 134637 | ADAT2 | C04 | Human | Oral cavity | OSCC | 2.39e-03 | 2.32e-01 | 0.2633 |
| 134637 | ADAT2 | C21 | Human | Oral cavity | OSCC | 1.64e-04 | 2.48e-01 | 0.2678 |
| 134637 | ADAT2 | C30 | Human | Oral cavity | OSCC | 1.24e-21 | 7.51e-01 | 0.3055 |
| 134637 | ADAT2 | C46 | Human | Oral cavity | OSCC | 2.14e-03 | 1.03e-01 | 0.1673 |
| 134637 | ADAT2 | C51 | Human | Oral cavity | OSCC | 2.19e-02 | 1.71e-01 | 0.2674 |
| 134637 | ADAT2 | LN46 | Human | Oral cavity | OSCC | 8.13e-03 | 1.05e-01 | 0.1666 |
| 134637 | ADAT2 | LP15 | Human | Oral cavity | LP | 2.41e-06 | 5.28e-01 | 0.2174 |
| 134637 | ADAT2 | SYSMH3 | Human | Oral cavity | OSCC | 3.41e-11 | 2.69e-01 | 0.2442 |
| Page: 1 |
| Tissue | Expression Dynamics | Abbreviation |
| Oral Cavity | 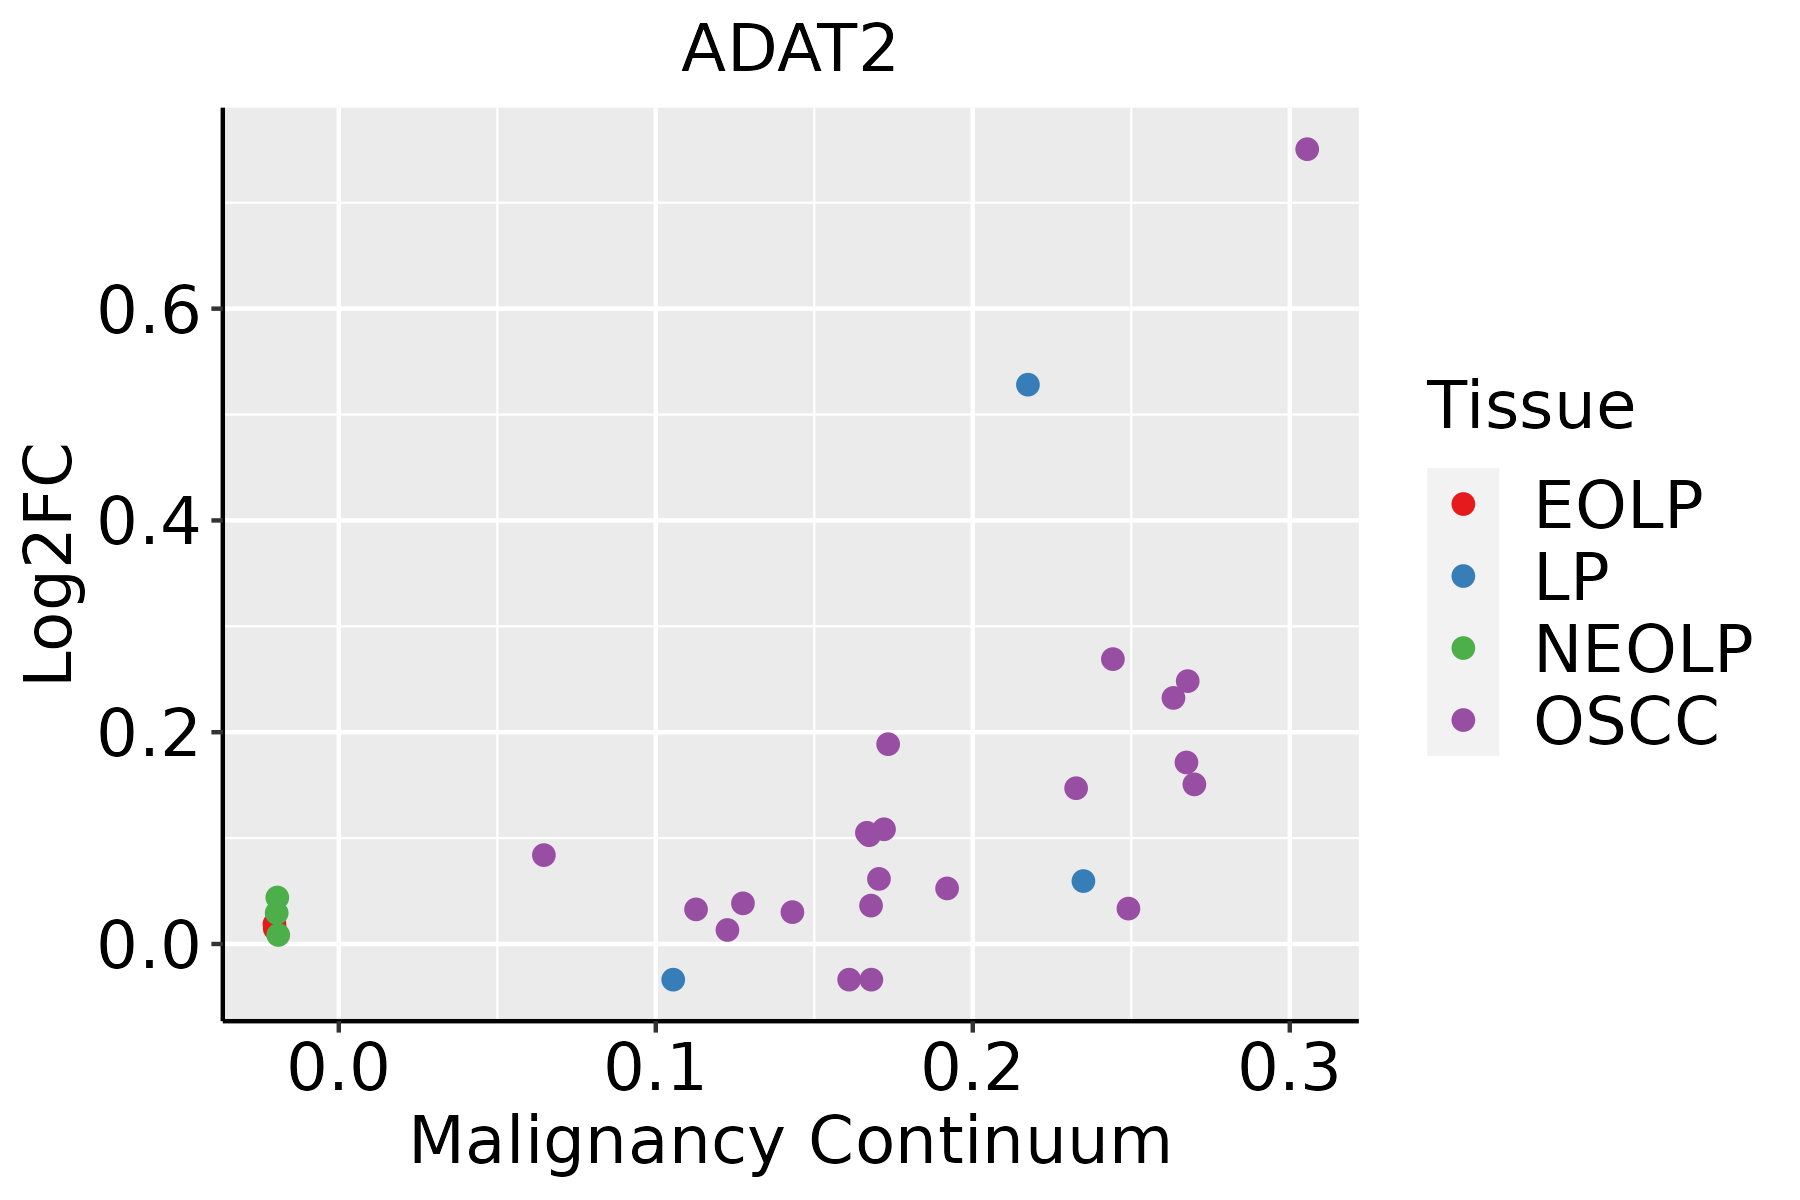 | EOLP: Erosive Oral lichen planus |
| LP: leukoplakia | ||
| NEOLP: Non-erosive oral lichen planus | ||
| OSCC: Oral squamous cell carcinoma |
| ∗log2FC in expression of this searched gene in stem-like cells from each diseased tissue sample relative to stem-like cells in normal samples in each tissue plotted against the malignancy continuum. Samples are colored based on if they are from different disease stage. |
Top |
Malignant transformation related pathway analysis |
| Find out the enriched GO biological processes and KEGG pathways involved in transition from healthy to precancer to cancer |
| Tissue | Disease Stage | Enriched GO biological Processes |
| Colorectum | AD |  |
| Colorectum | SER |  |
| Colorectum | MSS |  |
| Colorectum | MSI-H |  |
| Colorectum | FAP |  |
| ∗Top 15 enriched GO BP terms are showed in the bar plot of each disease state in each tissue. Each row represents a significant GO biological process which is colored according to the -log10(p.adjust). |
| Page: 1 2 3 4 5 6 7 8 9 |
| GO ID | Tissue | Disease Stage | Description | Gene Ratio | Bg Ratio | pvalue | p.adjust | Count |
| GO:00344709 | Oral cavity | OSCC | ncRNA processing | 263/7305 | 395/18723 | 4.38e-29 | 2.78e-26 | 263 |
| GO:00346605 | Oral cavity | OSCC | ncRNA metabolic process | 296/7305 | 485/18723 | 2.94e-23 | 6.65e-21 | 296 |
| GO:00080332 | Oral cavity | OSCC | tRNA processing | 78/7305 | 127/18723 | 2.56e-07 | 4.00e-06 | 78 |
| GO:00063991 | Oral cavity | OSCC | tRNA metabolic process | 101/7305 | 179/18723 | 1.65e-06 | 2.15e-05 | 101 |
| GO:00094511 | Oral cavity | OSCC | RNA modification | 95/7305 | 167/18723 | 2.05e-06 | 2.62e-05 | 95 |
| GO:00064001 | Oral cavity | OSCC | tRNA modification | 53/7305 | 90/18723 | 1.04e-04 | 7.70e-04 | 53 |
| GO:003447014 | Oral cavity | LP | ncRNA processing | 184/4623 | 395/18723 | 1.20e-21 | 3.12e-19 | 184 |
| GO:003466011 | Oral cavity | LP | ncRNA metabolic process | 205/4623 | 485/18723 | 6.46e-18 | 1.09e-15 | 205 |
| GO:00080331 | Oral cavity | LP | tRNA processing | 44/4623 | 127/18723 | 7.50e-03 | 4.15e-02 | 44 |
| Page: 1 |
| Pathway ID | Tissue | Disease Stage | Description | Gene Ratio | Bg Ratio | pvalue | p.adjust | qvalue | Count |
| Page: 1 |
Top |
Cell-cell communication analysis |
| Identification of potential cell-cell interactions between two cell types and their ligand-receptor pairs for different disease states |
| Ligand | Receptor | LRpair | Pathway | Tissue | Disease Stage |
| Page: 1 |
Top |
Single-cell gene regulatory network inference analysis |
| Find out the significant the regulons (TFs) and the target genes of each regulon across cell types for different disease states |
| TF | Cell Type | Tissue | Disease Stage | Target Gene | RSS | Regulon Activity |
| ∗The dot plots of a searched regulon are shown for all cell subpopulations in each disease state of each tissue based on the regulon specific score inferred using pySCENIC and by calculating the average expression. |
| Page: 1 |
Top |
Somatic mutation of malignant transformation related genes |
| Annotation of somatic variants for genes involved in malignant transformation |
| Hugo Symbol | Variant Class | Variant Classification | dbSNP RS | HGVSc | HGVSp | HGVSp Short | SWISSPROT | BIOTYPE | SIFT | PolyPhen | Tumor Sample Barcode | Tissue | Histology | Sex | Age | Stage | Therapy Types | Drugs | Outcome |
| ADAT2 | SNV | Missense_Mutation | novel | c.351G>C | p.Met117Ile | p.M117I | Q7Z6V5 | protein_coding | tolerated(0.34) | benign(0.444) | TCGA-3C-AALI-01 | Breast | breast invasive carcinoma | Female | <65 | I/II | Unspecific | Poly E | Complete Response |
| ADAT2 | insertion | Nonsense_Mutation | novel | c.19_20insAACTGGCTTTACTGCCTCGAAACTTTCTGTAGCCCATTCTCA | p.Pro7delinsGlnLeuAlaLeuLeuProArgAsnPheLeuTerProIleLeuThr | p.P7delinsQLALLPRNFL*PILT | Q7Z6V5 | protein_coding | TCGA-AN-A0AL-01 | Breast | breast invasive carcinoma | Female | <65 | III/IV | Unknown | Unknown | SD | ||
| ADAT2 | SNV | Missense_Mutation | rs757765963 | c.232N>A | p.Asp78Asn | p.D78N | Q7Z6V5 | protein_coding | deleterious(0) | probably_damaging(0.993) | TCGA-MA-AA43-01 | Cervix | cervical & endocervical cancer | Female | <65 | III/IV | Unknown | Unknown | SD |
| ADAT2 | SNV | Missense_Mutation | c.572C>A | p.Ser191Tyr | p.S191Y | Q7Z6V5 | protein_coding | deleterious(0) | benign(0.023) | TCGA-AA-3977-01 | Colorectum | colon adenocarcinoma | Male | >=65 | I/II | Unknown | Unknown | SD | |
| ADAT2 | SNV | Missense_Mutation | rs866986087 | c.476N>A | p.Arg159Gln | p.R159Q | Q7Z6V5 | protein_coding | tolerated(0.3) | benign(0.005) | TCGA-AA-3989-01 | Colorectum | colon adenocarcinoma | Male | >=65 | III/IV | Unknown | Unknown | PD |
| ADAT2 | SNV | Missense_Mutation | novel | c.451C>G | p.Pro151Ala | p.P151A | Q7Z6V5 | protein_coding | tolerated(0.25) | benign(0) | TCGA-AY-4070-01 | Colorectum | colon adenocarcinoma | Female | <65 | III/IV | Chemotherapy | 5-fu | PD |
| ADAT2 | SNV | Missense_Mutation | c.112N>A | p.Glu38Lys | p.E38K | Q7Z6V5 | protein_coding | tolerated(0.26) | benign(0.007) | TCGA-AG-A002-01 | Colorectum | rectum adenocarcinoma | Male | <65 | I/II | Unknown | Unknown | SD | |
| ADAT2 | SNV | Missense_Mutation | c.428N>T | p.Ala143Val | p.A143V | Q7Z6V5 | protein_coding | tolerated(0.27) | benign(0.001) | TCGA-AP-A0LE-01 | Endometrium | uterine corpus endometrioid carcinoma | Female | <65 | I/II | Unknown | Unknown | SD | |
| ADAT2 | SNV | Missense_Mutation | c.176N>A | p.Arg59Lys | p.R59K | Q7Z6V5 | protein_coding | deleterious(0.05) | benign(0.039) | TCGA-AP-A0LM-01 | Endometrium | uterine corpus endometrioid carcinoma | Female | <65 | III/IV | Chemotherapy | cisplatin | SD | |
| ADAT2 | SNV | Missense_Mutation | novel | c.247N>C | p.Trp83Arg | p.W83R | Q7Z6V5 | protein_coding | tolerated(0.22) | probably_damaging(0.986) | TCGA-AX-A2HD-01 | Endometrium | uterine corpus endometrioid carcinoma | Female | >=65 | III/IV | Unknown | Unknown | SD |
| Page: 1 2 3 |
Top |
Related drugs of malignant transformation related genes |
| Identification of chemicals and drugs interact with genes involved in malignant transfromation |
| (DGIdb 4.0) |
| Entrez ID | Symbol | Category | Interaction Types | Drug Claim Name | Drug Name | PMIDs |
| Page: 1 |

Copyright 2023-Present -The University of Texas Health Science Center at Houston |