
|
|||||
|
 | |
| |
| |
| |
| |
| |
|
Gene: ADAT1 |
Gene summary for ADAT1 |
| Gene information | Species | Human | Gene symbol | ADAT1 | Gene ID | 23536 |
| Gene name | adenosine deaminase tRNA specific 1 | |
| Gene Alias | HADAT1 | |
| Cytomap | 16q23.1 | |
| Gene Type | protein-coding | GO ID | GO:0006139 | UniProtAcc | Q9BUB4 |
Top |
Malignant transformation analysis |
| Identification of the aberrant gene expression in precancerous and cancerous lesions by comparing the gene expression of stem-like cells in diseased tissues with normal stem cells |
| Entrez ID | Symbol | Replicates | Species | Organ | Tissue | Adj P-value | Log2FC | Malignancy |
| 23536 | ADAT1 | P1T-E | Human | Esophagus | ESCC | 3.56e-03 | 1.67e-01 | 0.0875 |
| 23536 | ADAT1 | P2T-E | Human | Esophagus | ESCC | 2.56e-07 | 1.11e-01 | 0.1177 |
| 23536 | ADAT1 | P5T-E | Human | Esophagus | ESCC | 7.41e-04 | 9.66e-02 | 0.1327 |
| 23536 | ADAT1 | P8T-E | Human | Esophagus | ESCC | 3.22e-03 | 1.14e-01 | 0.0889 |
| 23536 | ADAT1 | P9T-E | Human | Esophagus | ESCC | 9.83e-03 | 9.11e-02 | 0.1131 |
| 23536 | ADAT1 | P10T-E | Human | Esophagus | ESCC | 9.57e-12 | 1.03e-01 | 0.116 |
| 23536 | ADAT1 | P11T-E | Human | Esophagus | ESCC | 2.69e-04 | 1.61e-01 | 0.1426 |
| 23536 | ADAT1 | P12T-E | Human | Esophagus | ESCC | 1.10e-07 | 9.56e-02 | 0.1122 |
| 23536 | ADAT1 | P15T-E | Human | Esophagus | ESCC | 6.46e-03 | 1.12e-01 | 0.1149 |
| 23536 | ADAT1 | P16T-E | Human | Esophagus | ESCC | 2.79e-07 | 1.23e-01 | 0.1153 |
| 23536 | ADAT1 | P20T-E | Human | Esophagus | ESCC | 1.48e-02 | 8.45e-02 | 0.1124 |
| 23536 | ADAT1 | P21T-E | Human | Esophagus | ESCC | 3.76e-11 | 1.68e-01 | 0.1617 |
| 23536 | ADAT1 | P22T-E | Human | Esophagus | ESCC | 8.54e-08 | 2.01e-01 | 0.1236 |
| 23536 | ADAT1 | P23T-E | Human | Esophagus | ESCC | 4.77e-09 | 2.46e-01 | 0.108 |
| 23536 | ADAT1 | P24T-E | Human | Esophagus | ESCC | 1.63e-06 | 1.68e-01 | 0.1287 |
| 23536 | ADAT1 | P26T-E | Human | Esophagus | ESCC | 8.09e-08 | 1.37e-01 | 0.1276 |
| 23536 | ADAT1 | P27T-E | Human | Esophagus | ESCC | 4.24e-03 | 9.94e-02 | 0.1055 |
| 23536 | ADAT1 | P28T-E | Human | Esophagus | ESCC | 4.74e-04 | 8.72e-02 | 0.1149 |
| 23536 | ADAT1 | P30T-E | Human | Esophagus | ESCC | 1.24e-05 | 2.38e-01 | 0.137 |
| 23536 | ADAT1 | P31T-E | Human | Esophagus | ESCC | 2.55e-12 | 1.99e-01 | 0.1251 |
| Page: 1 2 3 |
| Tissue | Expression Dynamics | Abbreviation |
| Esophagus | 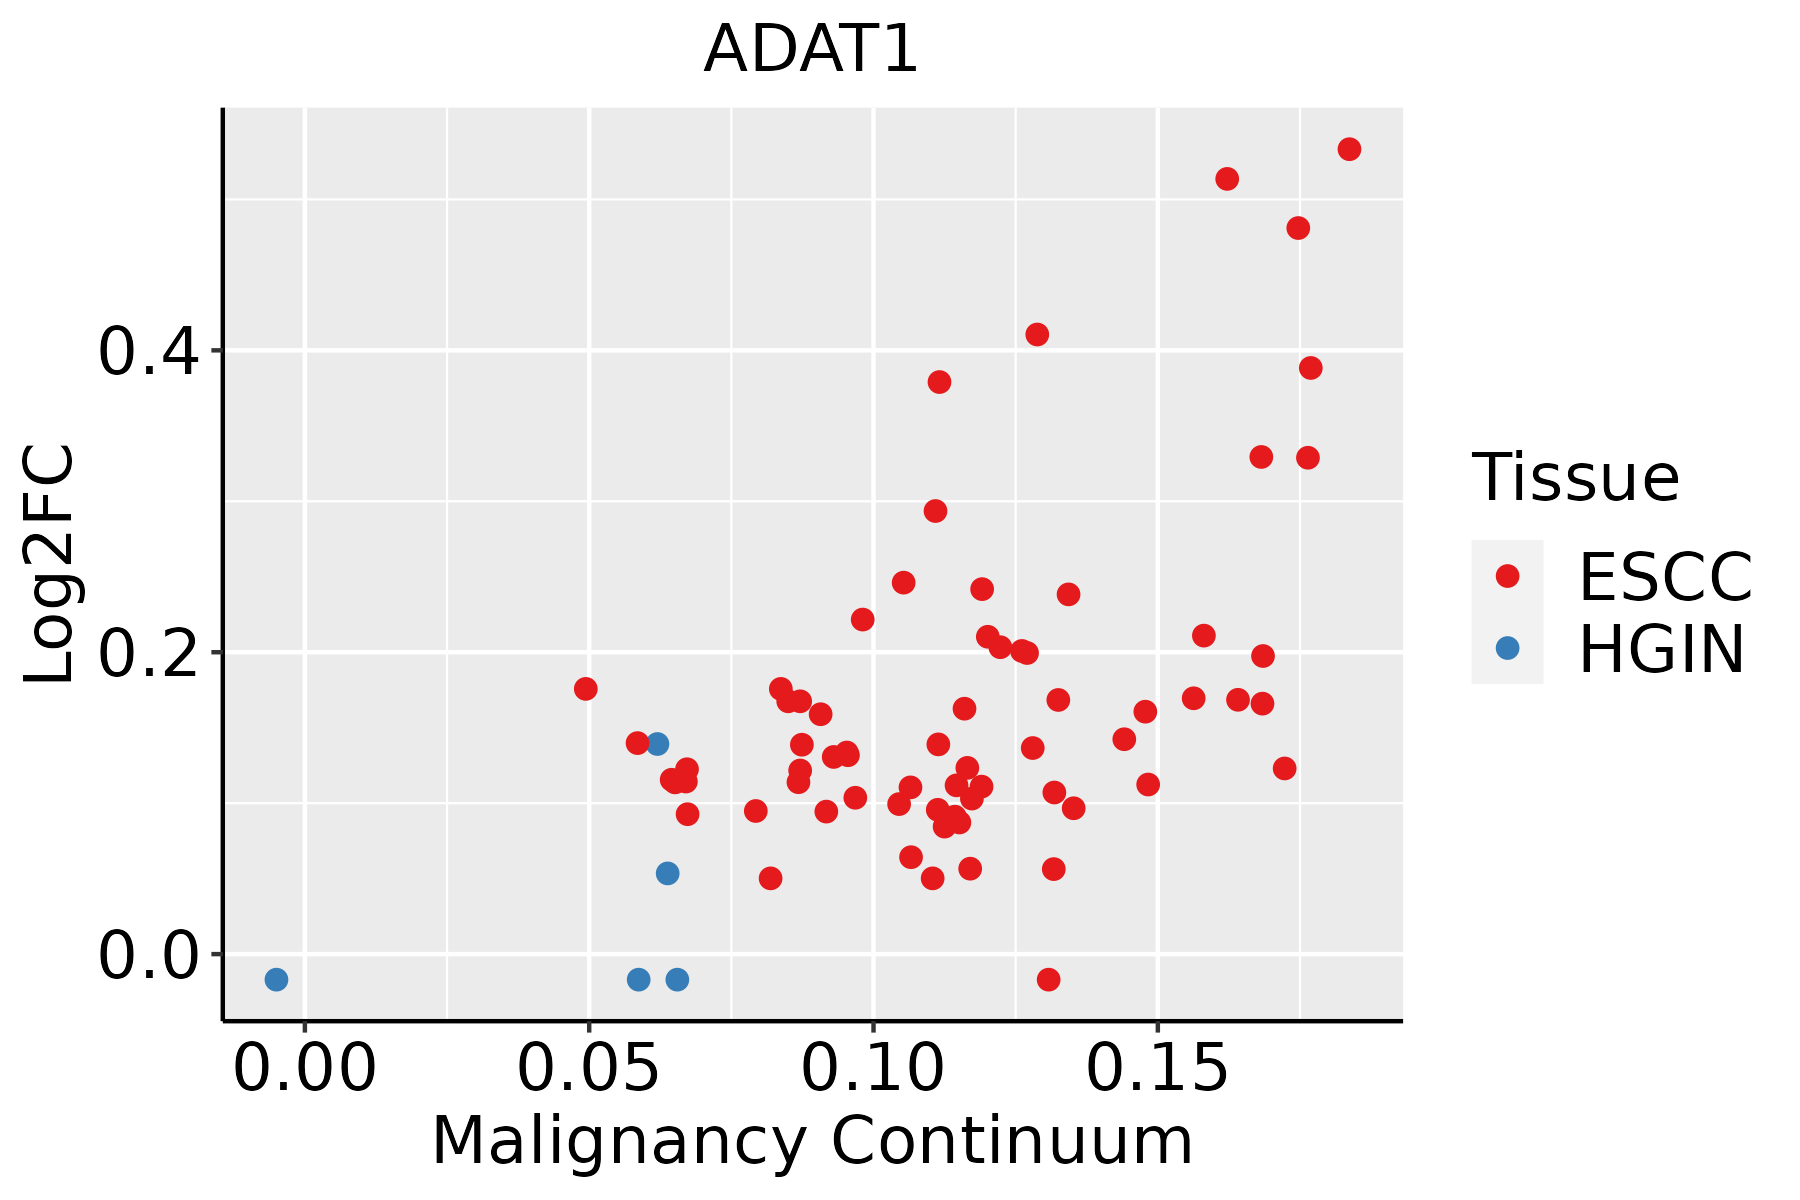 | ESCC: Esophageal squamous cell carcinoma |
| HGIN: High-grade intraepithelial neoplasias | ||
| LGIN: Low-grade intraepithelial neoplasias | ||
| Liver |  | HCC: Hepatocellular carcinoma |
| NAFLD: Non-alcoholic fatty liver disease |
| ∗log2FC in expression of this searched gene in stem-like cells from each diseased tissue sample relative to stem-like cells in normal samples in each tissue plotted against the malignancy continuum. Samples are colored based on if they are from different disease stage. |
Top |
Malignant transformation related pathway analysis |
| Find out the enriched GO biological processes and KEGG pathways involved in transition from healthy to precancer to cancer |
| Tissue | Disease Stage | Enriched GO biological Processes |
| Colorectum | AD |  |
| Colorectum | SER |  |
| Colorectum | MSS |  |
| Colorectum | MSI-H |  |
| Colorectum | FAP |  |
| ∗Top 15 enriched GO BP terms are showed in the bar plot of each disease state in each tissue. Each row represents a significant GO biological process which is colored according to the -log10(p.adjust). |
| Page: 1 2 3 4 5 6 7 8 9 |
| GO ID | Tissue | Disease Stage | Description | Gene Ratio | Bg Ratio | pvalue | p.adjust | Count |
| GO:003447015 | Esophagus | ESCC | ncRNA processing | 300/8552 | 395/18723 | 3.09e-35 | 3.26e-32 | 300 |
| GO:003466012 | Esophagus | ESCC | ncRNA metabolic process | 346/8552 | 485/18723 | 4.35e-31 | 2.51e-28 | 346 |
| GO:00080333 | Esophagus | ESCC | tRNA processing | 92/8552 | 127/18723 | 7.83e-10 | 1.93e-08 | 92 |
| GO:00063992 | Esophagus | ESCC | tRNA metabolic process | 122/8552 | 179/18723 | 9.03e-10 | 2.19e-08 | 122 |
| GO:00344702 | Liver | HCC | ncRNA processing | 293/7958 | 395/18723 | 4.26e-38 | 6.76e-35 | 293 |
| GO:00346601 | Liver | HCC | ncRNA metabolic process | 332/7958 | 485/18723 | 1.48e-31 | 7.80e-29 | 332 |
| GO:0008033 | Liver | HCC | tRNA processing | 87/7958 | 127/18723 | 2.66e-09 | 7.23e-08 | 87 |
| GO:0006399 | Liver | HCC | tRNA metabolic process | 108/7958 | 179/18723 | 1.07e-06 | 1.59e-05 | 108 |
| Page: 1 |
| Pathway ID | Tissue | Disease Stage | Description | Gene Ratio | Bg Ratio | pvalue | p.adjust | qvalue | Count |
| Page: 1 |
Top |
Cell-cell communication analysis |
| Identification of potential cell-cell interactions between two cell types and their ligand-receptor pairs for different disease states |
| Ligand | Receptor | LRpair | Pathway | Tissue | Disease Stage |
| Page: 1 |
Top |
Single-cell gene regulatory network inference analysis |
| Find out the significant the regulons (TFs) and the target genes of each regulon across cell types for different disease states |
| TF | Cell Type | Tissue | Disease Stage | Target Gene | RSS | Regulon Activity |
| ∗The dot plots of a searched regulon are shown for all cell subpopulations in each disease state of each tissue based on the regulon specific score inferred using pySCENIC and by calculating the average expression. |
| Page: 1 |
Top |
Somatic mutation of malignant transformation related genes |
| Annotation of somatic variants for genes involved in malignant transformation |
| Hugo Symbol | Variant Class | Variant Classification | dbSNP RS | HGVSc | HGVSp | HGVSp Short | SWISSPROT | BIOTYPE | SIFT | PolyPhen | Tumor Sample Barcode | Tissue | Histology | Sex | Age | Stage | Therapy Types | Drugs | Outcome |
| ADAT1 | SNV | Missense_Mutation | c.1432N>A | p.Glu478Lys | p.E478K | Q9BUB4 | protein_coding | tolerated(0.19) | probably_damaging(0.913) | TCGA-AC-A23H-01 | Breast | breast invasive carcinoma | Female | >=65 | I/II | Unknown | Unknown | PD | |
| ADAT1 | insertion | Frame_Shift_Ins | novel | c.300_301insTCATCTAAAGAGAAGACAGAGG | p.Leu101SerfsTer21 | p.L101Sfs*21 | Q9BUB4 | protein_coding | TCGA-BH-A0EE-01 | Breast | breast invasive carcinoma | Female | >=65 | I/II | Chemotherapy | docetaxel | SD | ||
| ADAT1 | deletion | Frame_Shift_Del | novel | c.654delT | p.Phe218LeufsTer20 | p.F218Lfs*20 | Q9BUB4 | protein_coding | TCGA-D8-A27V-01 | Breast | breast invasive carcinoma | Female | <65 | I/II | Hormone Therapy | tamoxiphen | SD | ||
| ADAT1 | SNV | Missense_Mutation | c.1156N>C | p.Asp386His | p.D386H | Q9BUB4 | protein_coding | tolerated(0.09) | benign(0.045) | TCGA-C5-A1MK-01 | Cervix | cervical & endocervical cancer | Female | >=65 | III/IV | Chemotherapy | carboplatin | PD | |
| ADAT1 | SNV | Missense_Mutation | rs745716034 | c.1079G>A | p.Gly360Glu | p.G360E | Q9BUB4 | protein_coding | tolerated(1) | benign(0.005) | TCGA-C5-A902-01 | Cervix | cervical & endocervical cancer | Female | <65 | I/II | Chemotherapy | cisplatin | SD |
| ADAT1 | SNV | Missense_Mutation | rs754878846 | c.1418C>T | p.Ala473Val | p.A473V | Q9BUB4 | protein_coding | deleterious(0) | probably_damaging(0.937) | TCGA-AA-3966-01 | Colorectum | colon adenocarcinoma | Female | >=65 | I/II | Unknown | Unknown | SD |
| ADAT1 | SNV | Missense_Mutation | c.91N>C | p.Trp31Arg | p.W31R | Q9BUB4 | protein_coding | deleterious(0.03) | benign(0.172) | TCGA-AY-6197-01 | Colorectum | colon adenocarcinoma | Male | <65 | I/II | Unknown | Unknown | SD | |
| ADAT1 | SNV | Missense_Mutation | c.446C>T | p.Pro149Leu | p.P149L | Q9BUB4 | protein_coding | deleterious(0) | probably_damaging(1) | TCGA-CA-5254-01 | Colorectum | colon adenocarcinoma | Female | <65 | I/II | Chemotherapy | oxaliplatin | CR | |
| ADAT1 | SNV | Missense_Mutation | c.230N>T | p.Arg77Met | p.R77M | Q9BUB4 | protein_coding | deleterious(0) | probably_damaging(0.995) | TCGA-CM-6674-01 | Colorectum | colon adenocarcinoma | Male | <65 | I/II | Unknown | Unknown | SD | |
| ADAT1 | insertion | Frame_Shift_Ins | novel | c.1071dupA | p.Gly358ArgfsTer17 | p.G358Rfs*17 | Q9BUB4 | protein_coding | TCGA-A6-3809-01 | Colorectum | colon adenocarcinoma | Female | >=65 | I/II | Unknown | Unknown | SD |
| Page: 1 2 3 4 5 |
Top |
Related drugs of malignant transformation related genes |
| Identification of chemicals and drugs interact with genes involved in malignant transfromation |
| (DGIdb 4.0) |
| Entrez ID | Symbol | Category | Interaction Types | Drug Claim Name | Drug Name | PMIDs |
| Page: 1 |

Copyright 2023-Present -The University of Texas Health Science Center at Houston |