
|
|||||
|
 | |
| |
| |
| |
| |
| |
|
Gene: ADARB2 |
Gene summary for ADARB2 |
| Gene information | Species | Human | Gene symbol | ADARB2 | Gene ID | 105 |
| Gene name | adenosine deaminase RNA specific B2 (inactive) | |
| Gene Alias | ADAR3 | |
| Cytomap | 10p15.3 | |
| Gene Type | protein-coding | GO ID | GO:0006139 | UniProtAcc | Q9NS39 |
Top |
Malignant transformation analysis |
| Identification of the aberrant gene expression in precancerous and cancerous lesions by comparing the gene expression of stem-like cells in diseased tissues with normal stem cells |
| Entrez ID | Symbol | Replicates | Species | Organ | Tissue | Adj P-value | Log2FC | Malignancy |
| 105 | ADARB2 | CCI_2 | Human | Cervix | CC | 2.23e-25 | 2.66e+00 | 0.5249 |
| 105 | ADARB2 | CCI_3 | Human | Cervix | CC | 3.64e-03 | 7.02e-01 | 0.516 |
| 105 | ADARB2 | CCII_1 | Human | Cervix | CC | 9.25e-04 | 2.22e-01 | 0.3249 |
| 105 | ADARB2 | T1 | Human | Cervix | CC | 1.54e-12 | 2.97e-01 | 0.0918 |
| 105 | ADARB2 | LZE6T | Human | Esophagus | ESCC | 9.61e-05 | 2.35e-01 | 0.0845 |
| 105 | ADARB2 | P2T-E | Human | Esophagus | ESCC | 6.36e-33 | 5.84e-01 | 0.1177 |
| 105 | ADARB2 | P8T-E | Human | Esophagus | ESCC | 9.67e-18 | 3.73e-01 | 0.0889 |
| 105 | ADARB2 | P11T-E | Human | Esophagus | ESCC | 4.74e-03 | 2.22e-01 | 0.1426 |
| 105 | ADARB2 | P16T-E | Human | Esophagus | ESCC | 3.75e-03 | 6.45e-02 | 0.1153 |
| 105 | ADARB2 | P21T-E | Human | Esophagus | ESCC | 3.19e-23 | 5.95e-01 | 0.1617 |
| 105 | ADARB2 | P23T-E | Human | Esophagus | ESCC | 4.42e-05 | 2.07e-01 | 0.108 |
| 105 | ADARB2 | P24T-E | Human | Esophagus | ESCC | 7.90e-03 | 1.39e-01 | 0.1287 |
| 105 | ADARB2 | P26T-E | Human | Esophagus | ESCC | 6.62e-20 | 4.58e-01 | 0.1276 |
| 105 | ADARB2 | P30T-E | Human | Esophagus | ESCC | 4.44e-04 | 2.42e-01 | 0.137 |
| 105 | ADARB2 | P36T-E | Human | Esophagus | ESCC | 7.72e-03 | 2.65e-01 | 0.1187 |
| 105 | ADARB2 | P37T-E | Human | Esophagus | ESCC | 3.40e-10 | 2.70e-01 | 0.1371 |
| 105 | ADARB2 | P40T-E | Human | Esophagus | ESCC | 1.20e-04 | 1.62e-01 | 0.109 |
| 105 | ADARB2 | P47T-E | Human | Esophagus | ESCC | 7.98e-13 | 2.78e-01 | 0.1067 |
| 105 | ADARB2 | P56T-E | Human | Esophagus | ESCC | 2.17e-07 | 8.30e-01 | 0.1613 |
| 105 | ADARB2 | P61T-E | Human | Esophagus | ESCC | 2.11e-11 | 2.86e-01 | 0.099 |
| Page: 1 2 |
| Tissue | Expression Dynamics | Abbreviation |
| Cervix | 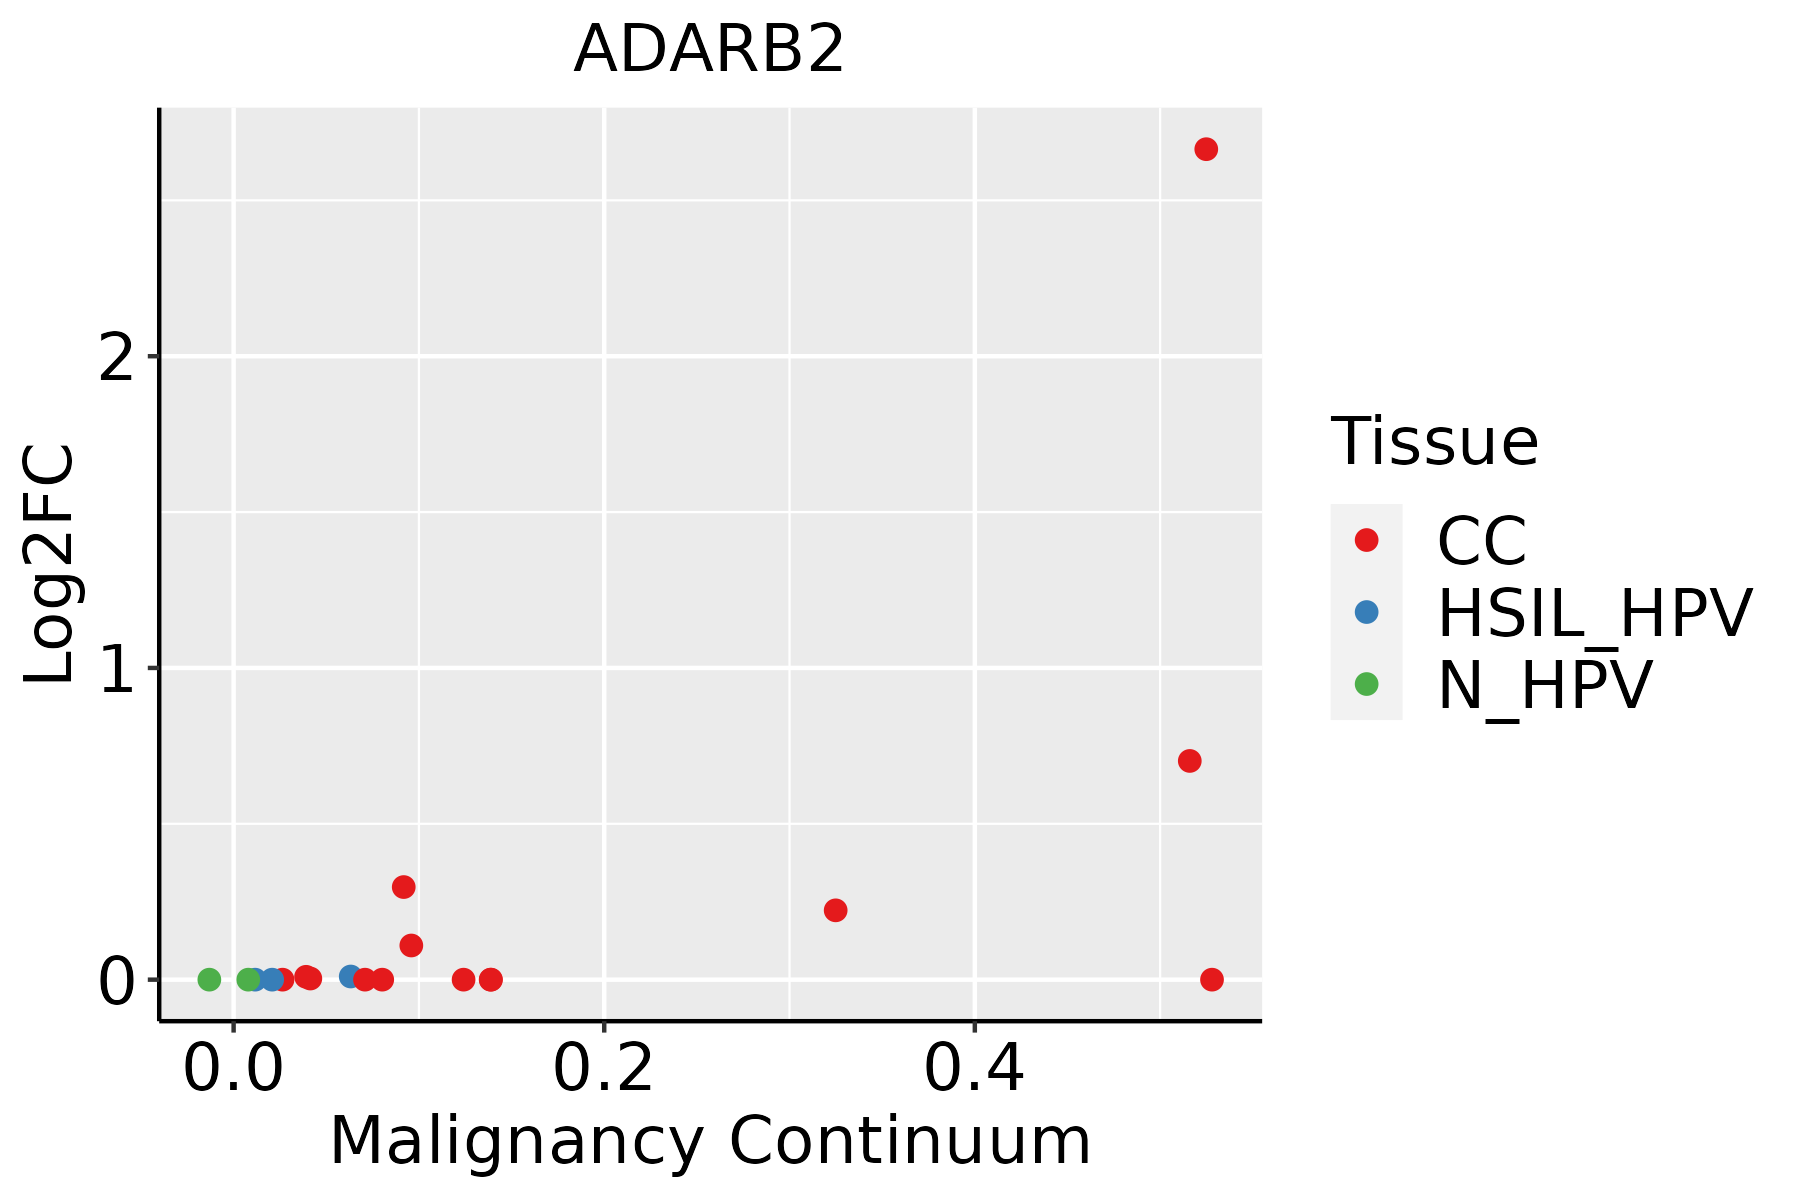 | CC: Cervix cancer |
| HSIL_HPV: HPV-infected high-grade squamous intraepithelial lesions | ||
| N_HPV: HPV-infected normal cervix | ||
| Esophagus | 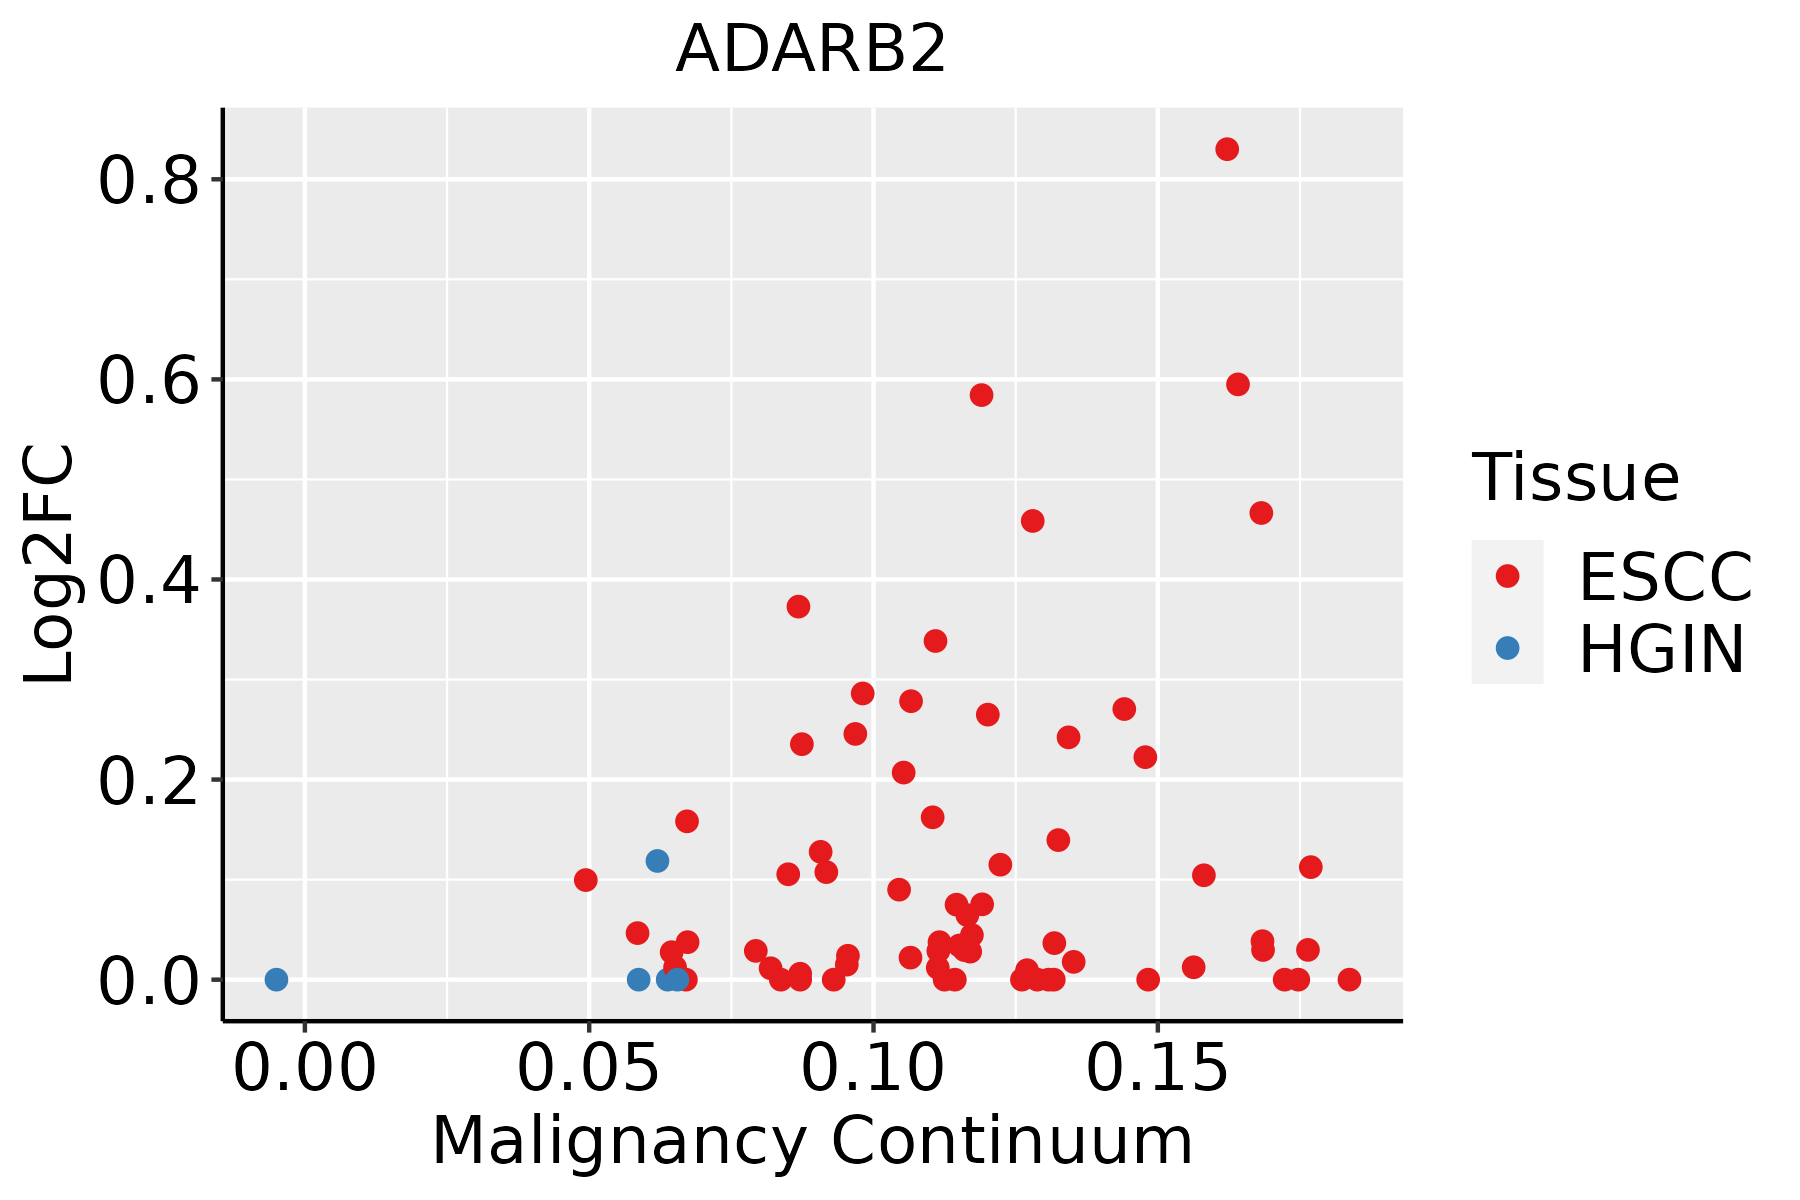 | ESCC: Esophageal squamous cell carcinoma |
| HGIN: High-grade intraepithelial neoplasias | ||
| LGIN: Low-grade intraepithelial neoplasias |
| ∗log2FC in expression of this searched gene in stem-like cells from each diseased tissue sample relative to stem-like cells in normal samples in each tissue plotted against the malignancy continuum. Samples are colored based on if they are from different disease stage. |
Top |
Malignant transformation related pathway analysis |
| Find out the enriched GO biological processes and KEGG pathways involved in transition from healthy to precancer to cancer |
| Tissue | Disease Stage | Enriched GO biological Processes |
| Colorectum | AD |  |
| Colorectum | SER |  |
| Colorectum | MSS |  |
| Colorectum | MSI-H |  |
| Colorectum | FAP |  |
| ∗Top 15 enriched GO BP terms are showed in the bar plot of each disease state in each tissue. Each row represents a significant GO biological process which is colored according to the -log10(p.adjust). |
| Page: 1 2 3 4 5 6 7 8 9 |
| GO ID | Tissue | Disease Stage | Description | Gene Ratio | Bg Ratio | pvalue | p.adjust | Count |
| GO:00094512 | Esophagus | ESCC | RNA modification | 114/8552 | 167/18723 | 2.76e-09 | 6.04e-08 | 114 |
| Page: 1 |
| Pathway ID | Tissue | Disease Stage | Description | Gene Ratio | Bg Ratio | pvalue | p.adjust | qvalue | Count |
| Page: 1 |
Top |
Cell-cell communication analysis |
| Identification of potential cell-cell interactions between two cell types and their ligand-receptor pairs for different disease states |
| Ligand | Receptor | LRpair | Pathway | Tissue | Disease Stage |
| Page: 1 |
Top |
Single-cell gene regulatory network inference analysis |
| Find out the significant the regulons (TFs) and the target genes of each regulon across cell types for different disease states |
| TF | Cell Type | Tissue | Disease Stage | Target Gene | RSS | Regulon Activity |
| ∗The dot plots of a searched regulon are shown for all cell subpopulations in each disease state of each tissue based on the regulon specific score inferred using pySCENIC and by calculating the average expression. |
| Page: 1 |
Top |
Somatic mutation of malignant transformation related genes |
| Annotation of somatic variants for genes involved in malignant transformation |
| Hugo Symbol | Variant Class | Variant Classification | dbSNP RS | HGVSc | HGVSp | HGVSp Short | SWISSPROT | BIOTYPE | SIFT | PolyPhen | Tumor Sample Barcode | Tissue | Histology | Sex | Age | Stage | Therapy Types | Drugs | Outcome |
| ADARB2 | SNV | Missense_Mutation | c.391G>C | p.Val131Leu | p.V131L | Q9NS39 | protein_coding | deleterious(0.01) | possibly_damaging(0.566) | TCGA-A7-A26I-01 | Breast | breast invasive carcinoma | Female | >=65 | I/II | Chemotherapy | cytoxan | SD | |
| ADARB2 | SNV | Missense_Mutation | novel | c.1258C>A | p.His420Asn | p.H420N | Q9NS39 | protein_coding | tolerated(0.07) | benign(0.071) | TCGA-AR-A2LR-01 | Breast | breast invasive carcinoma | Female | <65 | I/II | Chemotherapy | adriamycin | SD |
| ADARB2 | SNV | Missense_Mutation | novel | c.2085N>A | p.Met695Ile | p.M695I | Q9NS39 | protein_coding | tolerated(0.3) | benign(0.038) | TCGA-C8-A27B-01 | Breast | breast invasive carcinoma | Female | <65 | I/II | Chemotherapy | 5-fluorouracil | CR |
| ADARB2 | SNV | Missense_Mutation | novel | c.100N>C | p.Asp34His | p.D34H | Q9NS39 | protein_coding | deleterious_low_confidence(0.01) | benign(0.387) | TCGA-LL-A8F5-01 | Breast | breast invasive carcinoma | Female | <65 | I/II | Chemotherapy | cyclophosphamide | SD |
| ADARB2 | SNV | Missense_Mutation | novel | c.268C>T | p.Arg90Trp | p.R90W | Q9NS39 | protein_coding | deleterious(0.01) | probably_damaging(0.918) | TCGA-PL-A8LV-01 | Breast | breast invasive carcinoma | Female | <65 | III/IV | Unknown | Unknown | SD |
| ADARB2 | insertion | In_Frame_Ins | novel | c.1506_1507insGATGGAGGTGAG | p.Thr502_Thr503insAspGlyGlyGlu | p.T502_T503insDGGE | Q9NS39 | protein_coding | TCGA-A8-A085-01 | Breast | breast invasive carcinoma | Male | <65 | I/II | Hormone Therapy | tamoxiphen | SD | ||
| ADARB2 | insertion | Frame_Shift_Ins | novel | c.1505_1506insTGCAAACCCGCCCTGTGAGCATTTAT | p.Thr503AlafsTer57 | p.T503Afs*57 | Q9NS39 | protein_coding | TCGA-A8-A085-01 | Breast | breast invasive carcinoma | Male | <65 | I/II | Hormone Therapy | tamoxiphen | SD | ||
| ADARB2 | SNV | Missense_Mutation | novel | c.82C>T | p.Arg28Trp | p.R28W | Q9NS39 | protein_coding | deleterious_low_confidence(0.01) | probably_damaging(0.998) | TCGA-2W-A8YY-01 | Cervix | cervical & endocervical cancer | Female | <65 | I/II | Chemotherapy | cisplatin | CR |
| ADARB2 | SNV | Missense_Mutation | novel | c.445N>A | p.Gly149Ser | p.G149S | Q9NS39 | protein_coding | deleterious(0) | probably_damaging(1) | TCGA-DS-A1OB-01 | Cervix | cervical & endocervical cancer | Female | <65 | I/II | Chemotherapy | carboplatin | PD |
| ADARB2 | SNV | Missense_Mutation | novel | c.1802N>G | p.His601Arg | p.H601R | Q9NS39 | protein_coding | tolerated(0.75) | benign(0.003) | TCGA-VS-A9UJ-01 | Cervix | cervical & endocervical cancer | Female | <65 | I/II | Unknown | Unknown | PD |
| Page: 1 2 3 4 5 6 7 8 9 10 11 |
Top |
Related drugs of malignant transformation related genes |
| Identification of chemicals and drugs interact with genes involved in malignant transfromation |
| (DGIdb 4.0) |
| Entrez ID | Symbol | Category | Interaction Types | Drug Claim Name | Drug Name | PMIDs |
| Page: 1 |

Copyright 2023-Present -The University of Texas Health Science Center at Houston |