
|
|||||
|
 | |
| |
| |
| |
| |
| |
|
Gene: ADAMTS4 |
Gene summary for ADAMTS4 |
| Gene information | Species | Human | Gene symbol | ADAMTS4 | Gene ID | 9507 |
| Gene name | ADAM metallopeptidase with thrombospondin type 1 motif 4 | |
| Gene Alias | ADAMTS-2 | |
| Cytomap | 1q23.3 | |
| Gene Type | protein-coding | GO ID | GO:0001501 | UniProtAcc | O75173 |
Top |
Malignant transformation analysis |
| Identification of the aberrant gene expression in precancerous and cancerous lesions by comparing the gene expression of stem-like cells in diseased tissues with normal stem cells |
| Entrez ID | Symbol | Replicates | Species | Organ | Tissue | Adj P-value | Log2FC | Malignancy |
| 9507 | ADAMTS4 | P2T-E | Human | Esophagus | ESCC | 2.28e-09 | 1.51e-01 | 0.1177 |
| 9507 | ADAMTS4 | P8T-E | Human | Esophagus | ESCC | 1.10e-02 | -3.07e-02 | 0.0889 |
| 9507 | ADAMTS4 | P10T-E | Human | Esophagus | ESCC | 2.84e-03 | 3.79e-03 | 0.116 |
| 9507 | ADAMTS4 | P16T-E | Human | Esophagus | ESCC | 1.58e-10 | 1.40e-01 | 0.1153 |
| 9507 | ADAMTS4 | P21T-E | Human | Esophagus | ESCC | 9.18e-05 | 1.41e-02 | 0.1617 |
| 9507 | ADAMTS4 | P24T-E | Human | Esophagus | ESCC | 7.05e-04 | 7.96e-02 | 0.1287 |
| 9507 | ADAMTS4 | P52T-E | Human | Esophagus | ESCC | 6.64e-21 | 5.49e-01 | 0.1555 |
| 9507 | ADAMTS4 | P56T-E | Human | Esophagus | ESCC | 5.22e-09 | 1.81e+00 | 0.1613 |
| 9507 | ADAMTS4 | P76T-E | Human | Esophagus | ESCC | 2.76e-02 | 1.47e-01 | 0.1207 |
| 9507 | ADAMTS4 | P80T-E | Human | Esophagus | ESCC | 4.08e-11 | 8.34e-01 | 0.155 |
| 9507 | ADAMTS4 | P130T-E | Human | Esophagus | ESCC | 5.21e-09 | 1.77e-01 | 0.1676 |
| Page: 1 |
| Tissue | Expression Dynamics | Abbreviation |
| Esophagus | 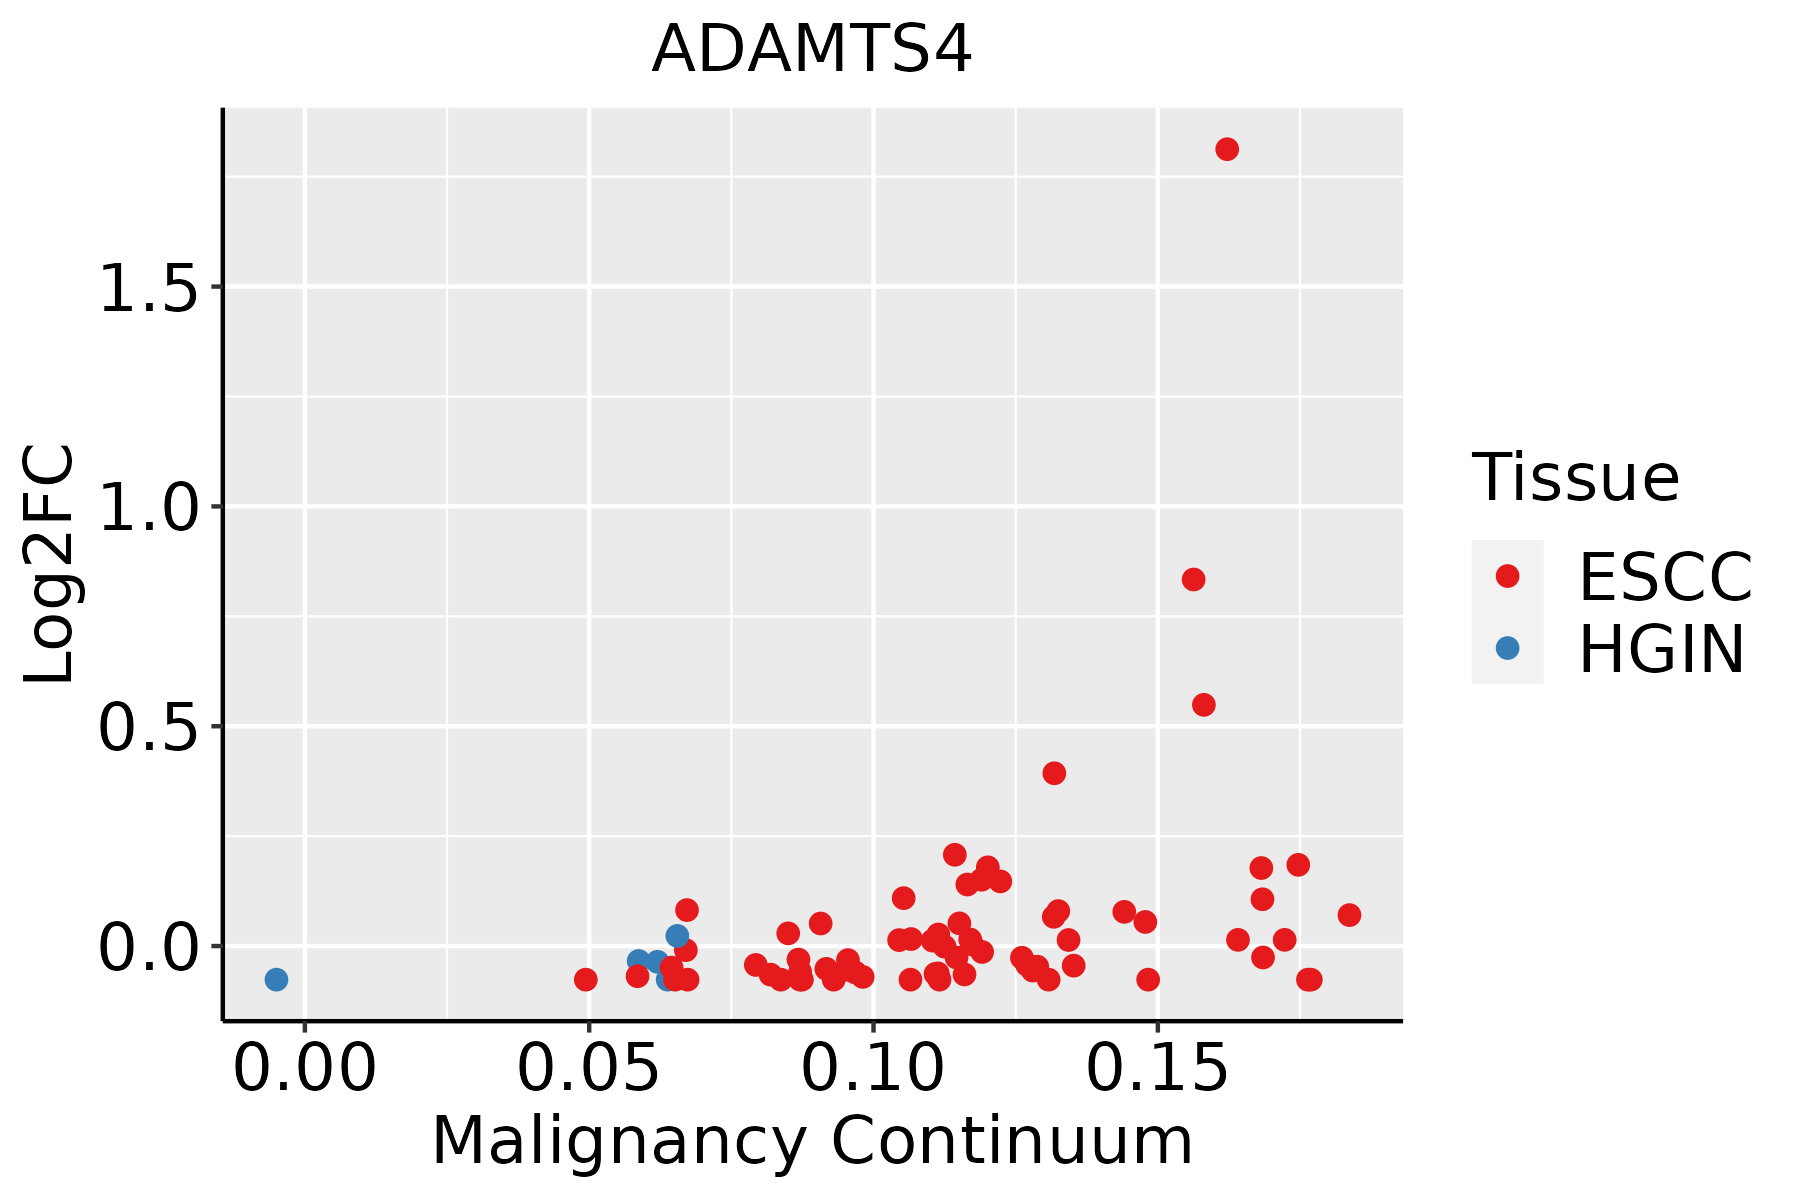 | ESCC: Esophageal squamous cell carcinoma |
| HGIN: High-grade intraepithelial neoplasias | ||
| LGIN: Low-grade intraepithelial neoplasias |
| ∗log2FC in expression of this searched gene in stem-like cells from each diseased tissue sample relative to stem-like cells in normal samples in each tissue plotted against the malignancy continuum. Samples are colored based on if they are from different disease stage. |
Top |
Malignant transformation related pathway analysis |
| Find out the enriched GO biological processes and KEGG pathways involved in transition from healthy to precancer to cancer |
| Tissue | Disease Stage | Enriched GO biological Processes |
| Colorectum | AD |  |
| Colorectum | SER |  |
| Colorectum | MSS |  |
| Colorectum | MSI-H |  |
| Colorectum | FAP |  |
| ∗Top 15 enriched GO BP terms are showed in the bar plot of each disease state in each tissue. Each row represents a significant GO biological process which is colored according to the -log10(p.adjust). |
| Page: 1 2 3 4 5 6 7 8 9 |
| GO ID | Tissue | Disease Stage | Description | Gene Ratio | Bg Ratio | pvalue | p.adjust | Count |
| GO:0022411111 | Esophagus | ESCC | cellular component disassembly | 305/8552 | 443/18723 | 1.94e-23 | 4.57e-21 | 305 |
| GO:00301984 | Esophagus | ESCC | extracellular matrix organization | 171/8552 | 301/18723 | 6.08e-05 | 4.67e-04 | 171 |
| GO:00430624 | Esophagus | ESCC | extracellular structure organization | 171/8552 | 302/18723 | 7.73e-05 | 5.76e-04 | 171 |
| GO:00452294 | Esophagus | ESCC | external encapsulating structure organization | 172/8552 | 304/18723 | 7.80e-05 | 5.80e-04 | 172 |
| GO:00226172 | Esophagus | ESCC | extracellular matrix disassembly | 39/8552 | 63/18723 | 6.92e-03 | 2.52e-02 | 39 |
| Page: 1 |
| Pathway ID | Tissue | Disease Stage | Description | Gene Ratio | Bg Ratio | pvalue | p.adjust | qvalue | Count |
| Page: 1 |
Top |
Cell-cell communication analysis |
| Identification of potential cell-cell interactions between two cell types and their ligand-receptor pairs for different disease states |
| Ligand | Receptor | LRpair | Pathway | Tissue | Disease Stage |
| Page: 1 |
Top |
Single-cell gene regulatory network inference analysis |
| Find out the significant the regulons (TFs) and the target genes of each regulon across cell types for different disease states |
| TF | Cell Type | Tissue | Disease Stage | Target Gene | RSS | Regulon Activity |
| ∗The dot plots of a searched regulon are shown for all cell subpopulations in each disease state of each tissue based on the regulon specific score inferred using pySCENIC and by calculating the average expression. |
| Page: 1 |
Top |
Somatic mutation of malignant transformation related genes |
| Annotation of somatic variants for genes involved in malignant transformation |
| Hugo Symbol | Variant Class | Variant Classification | dbSNP RS | HGVSc | HGVSp | HGVSp Short | SWISSPROT | BIOTYPE | SIFT | PolyPhen | Tumor Sample Barcode | Tissue | Histology | Sex | Age | Stage | Therapy Types | Drugs | Outcome |
| ADAMTS4 | insertion | Frame_Shift_Ins | novel | c.2217_2218insA | p.Gly740ArgfsTer2 | p.G740Rfs*2 | O75173 | protein_coding | TCGA-AN-A04C-01 | Breast | breast invasive carcinoma | Female | <65 | I/II | Unknown | Unknown | SD | ||
| ADAMTS4 | insertion | In_Frame_Ins | novel | c.2215_2216insGTAAAGGTT | p.Asn739delinsSerLysGlyTyr | p.N739delinsSKGY | O75173 | protein_coding | TCGA-AN-A04C-01 | Breast | breast invasive carcinoma | Female | <65 | I/II | Unknown | Unknown | SD | ||
| ADAMTS4 | SNV | Missense_Mutation | c.748N>A | p.Ala250Thr | p.A250T | O75173 | protein_coding | deleterious(0.05) | benign(0.11) | TCGA-4T-AA8H-01 | Colorectum | colon adenocarcinoma | Female | <65 | I/II | Unknown | Unknown | SD | |
| ADAMTS4 | SNV | Missense_Mutation | rs751618429 | c.1991G>A | p.Arg664His | p.R664H | O75173 | protein_coding | tolerated(0.41) | benign(0.006) | TCGA-A6-2686-01 | Colorectum | colon adenocarcinoma | Female | >=65 | I/II | Unknown | Unknown | SD |
| ADAMTS4 | SNV | Missense_Mutation | c.2057G>T | p.Ser686Ile | p.S686I | O75173 | protein_coding | deleterious(0) | benign(0.326) | TCGA-A6-5661-01 | Colorectum | colon adenocarcinoma | Female | >=65 | I/II | Unknown | Unknown | SD | |
| ADAMTS4 | SNV | Missense_Mutation | c.868C>T | p.Arg290Cys | p.R290C | O75173 | protein_coding | deleterious(0) | possibly_damaging(0.882) | TCGA-A6-5665-01 | Colorectum | colon adenocarcinoma | Female | >=65 | I/II | Unknown | Unknown | PD | |
| ADAMTS4 | SNV | Missense_Mutation | c.2206N>C | p.Tyr736His | p.Y736H | O75173 | protein_coding | deleterious(0) | probably_damaging(0.984) | TCGA-A6-6780-01 | Colorectum | colon adenocarcinoma | Male | >=65 | I/II | Unknown | Unknown | SD | |
| ADAMTS4 | SNV | Missense_Mutation | rs200924059 | c.694N>A | p.Ala232Thr | p.A232T | O75173 | protein_coding | tolerated(0.52) | benign(0.053) | TCGA-AA-3660-01 | Colorectum | colon adenocarcinoma | Female | <65 | I/II | Unknown | Unknown | SD |
| ADAMTS4 | SNV | Missense_Mutation | rs746213424 | c.1750N>A | p.Glu584Lys | p.E584K | O75173 | protein_coding | deleterious(0.01) | probably_damaging(0.941) | TCGA-AD-A5EJ-01 | Colorectum | colon adenocarcinoma | Female | >=65 | I/II | Unknown | Unknown | SD |
| ADAMTS4 | SNV | Missense_Mutation | c.634C>T | p.Arg212Cys | p.R212C | O75173 | protein_coding | deleterious(0) | possibly_damaging(0.75) | TCGA-AZ-4315-01 | Colorectum | colon adenocarcinoma | Male | <65 | I/II | Unknown | Unknown | SD |
| Page: 1 2 3 4 5 6 7 8 9 |
Top |
Related drugs of malignant transformation related genes |
| Identification of chemicals and drugs interact with genes involved in malignant transfromation |
| (DGIdb 4.0) |
| Entrez ID | Symbol | Category | Interaction Types | Drug Claim Name | Drug Name | PMIDs |
| 9507 | ADAMTS4 | ENZYME, DRUGGABLE GENOME, NEUTRAL ZINC METALLOPEPTIDASE, PROTEASE | CHONDROITIN SULFATE | 14701864 | ||
| 9507 | ADAMTS4 | ENZYME, DRUGGABLE GENOME, NEUTRAL ZINC METALLOPEPTIDASE, PROTEASE | 1607004-34-1 | |||
| 9507 | ADAMTS4 | ENZYME, DRUGGABLE GENOME, NEUTRAL ZINC METALLOPEPTIDASE, PROTEASE | inhibitor | 252166754 | ||
| 9507 | ADAMTS4 | ENZYME, DRUGGABLE GENOME, NEUTRAL ZINC METALLOPEPTIDASE, PROTEASE | US9206139, 4 | |||
| 9507 | ADAMTS4 | ENZYME, DRUGGABLE GENOME, NEUTRAL ZINC METALLOPEPTIDASE, PROTEASE | US9206139, 5 |
| Page: 1 |

Copyright 2023-Present -The University of Texas Health Science Center at Houston |