
|
|||||
|
 | |
| |
| |
| |
| |
| |
|
Gene: ADAM28 |
Gene summary for ADAM28 |
| Gene information | Species | Human | Gene symbol | ADAM28 | Gene ID | 10863 |
| Gene name | ADAM metallopeptidase domain 28 | |
| Gene Alias | ADAM 28 | |
| Cytomap | 8p21.2 | |
| Gene Type | protein-coding | GO ID | GO:0000003 | UniProtAcc | Q9UKQ2 |
Top |
Malignant transformation analysis |
| Identification of the aberrant gene expression in precancerous and cancerous lesions by comparing the gene expression of stem-like cells in diseased tissues with normal stem cells |
| Entrez ID | Symbol | Replicates | Species | Organ | Tissue | Adj P-value | Log2FC | Malignancy |
| 10863 | ADAM28 | LZE8T | Human | Esophagus | ESCC | 1.12e-03 | 9.10e-02 | 0.067 |
| 10863 | ADAM28 | P2T-E | Human | Esophagus | ESCC | 3.49e-03 | -1.37e-02 | 0.1177 |
| 10863 | ADAM28 | P8T-E | Human | Esophagus | ESCC | 1.79e-15 | 3.00e-01 | 0.0889 |
| 10863 | ADAM28 | P36T-E | Human | Esophagus | ESCC | 3.39e-03 | 1.32e-01 | 0.1187 |
| 10863 | ADAM28 | P37T-E | Human | Esophagus | ESCC | 3.40e-06 | 1.52e-01 | 0.1371 |
| 10863 | ADAM28 | P42T-E | Human | Esophagus | ESCC | 1.90e-02 | 1.50e-01 | 0.1175 |
| 10863 | ADAM28 | P47T-E | Human | Esophagus | ESCC | 4.30e-04 | -2.35e-02 | 0.1067 |
| 10863 | ADAM28 | P57T-E | Human | Esophagus | ESCC | 1.49e-09 | 2.22e-01 | 0.0926 |
| 10863 | ADAM28 | P61T-E | Human | Esophagus | ESCC | 1.11e-03 | 9.10e-02 | 0.099 |
| 10863 | ADAM28 | P62T-E | Human | Esophagus | ESCC | 3.23e-09 | 3.14e-01 | 0.1302 |
| 10863 | ADAM28 | P65T-E | Human | Esophagus | ESCC | 9.21e-04 | 7.91e-02 | 0.0978 |
| 10863 | ADAM28 | P74T-E | Human | Esophagus | ESCC | 4.22e-02 | 1.43e-01 | 0.1479 |
| 10863 | ADAM28 | P82T-E | Human | Esophagus | ESCC | 2.26e-07 | 5.60e-01 | 0.1072 |
| 10863 | ADAM28 | P94T-E | Human | Esophagus | ESCC | 1.28e-03 | 1.02e+00 | 0.0879 |
| 10863 | ADAM28 | P104T-E | Human | Esophagus | ESCC | 1.98e-14 | 8.56e-01 | 0.0931 |
| 10863 | ADAM28 | P128T-E | Human | Esophagus | ESCC | 2.19e-07 | 2.76e-01 | 0.1241 |
| 10863 | ADAM28 | Pat01-B | Human | Stomach | GC | 1.42e-18 | -7.23e-01 | 0.5754 |
| 10863 | ADAM28 | Pat02-B | Human | Stomach | GC | 2.21e-32 | -6.00e-01 | 0.0368 |
| 10863 | ADAM28 | Pat03-B | Human | Stomach | GC | 4.78e-19 | -6.88e-01 | 0.3693 |
| 10863 | ADAM28 | Pat04-B | Human | Stomach | GC | 1.40e-19 | -2.87e-01 | -0.1483 |
| Page: 1 2 3 |
| Tissue | Expression Dynamics | Abbreviation |
| Esophagus | 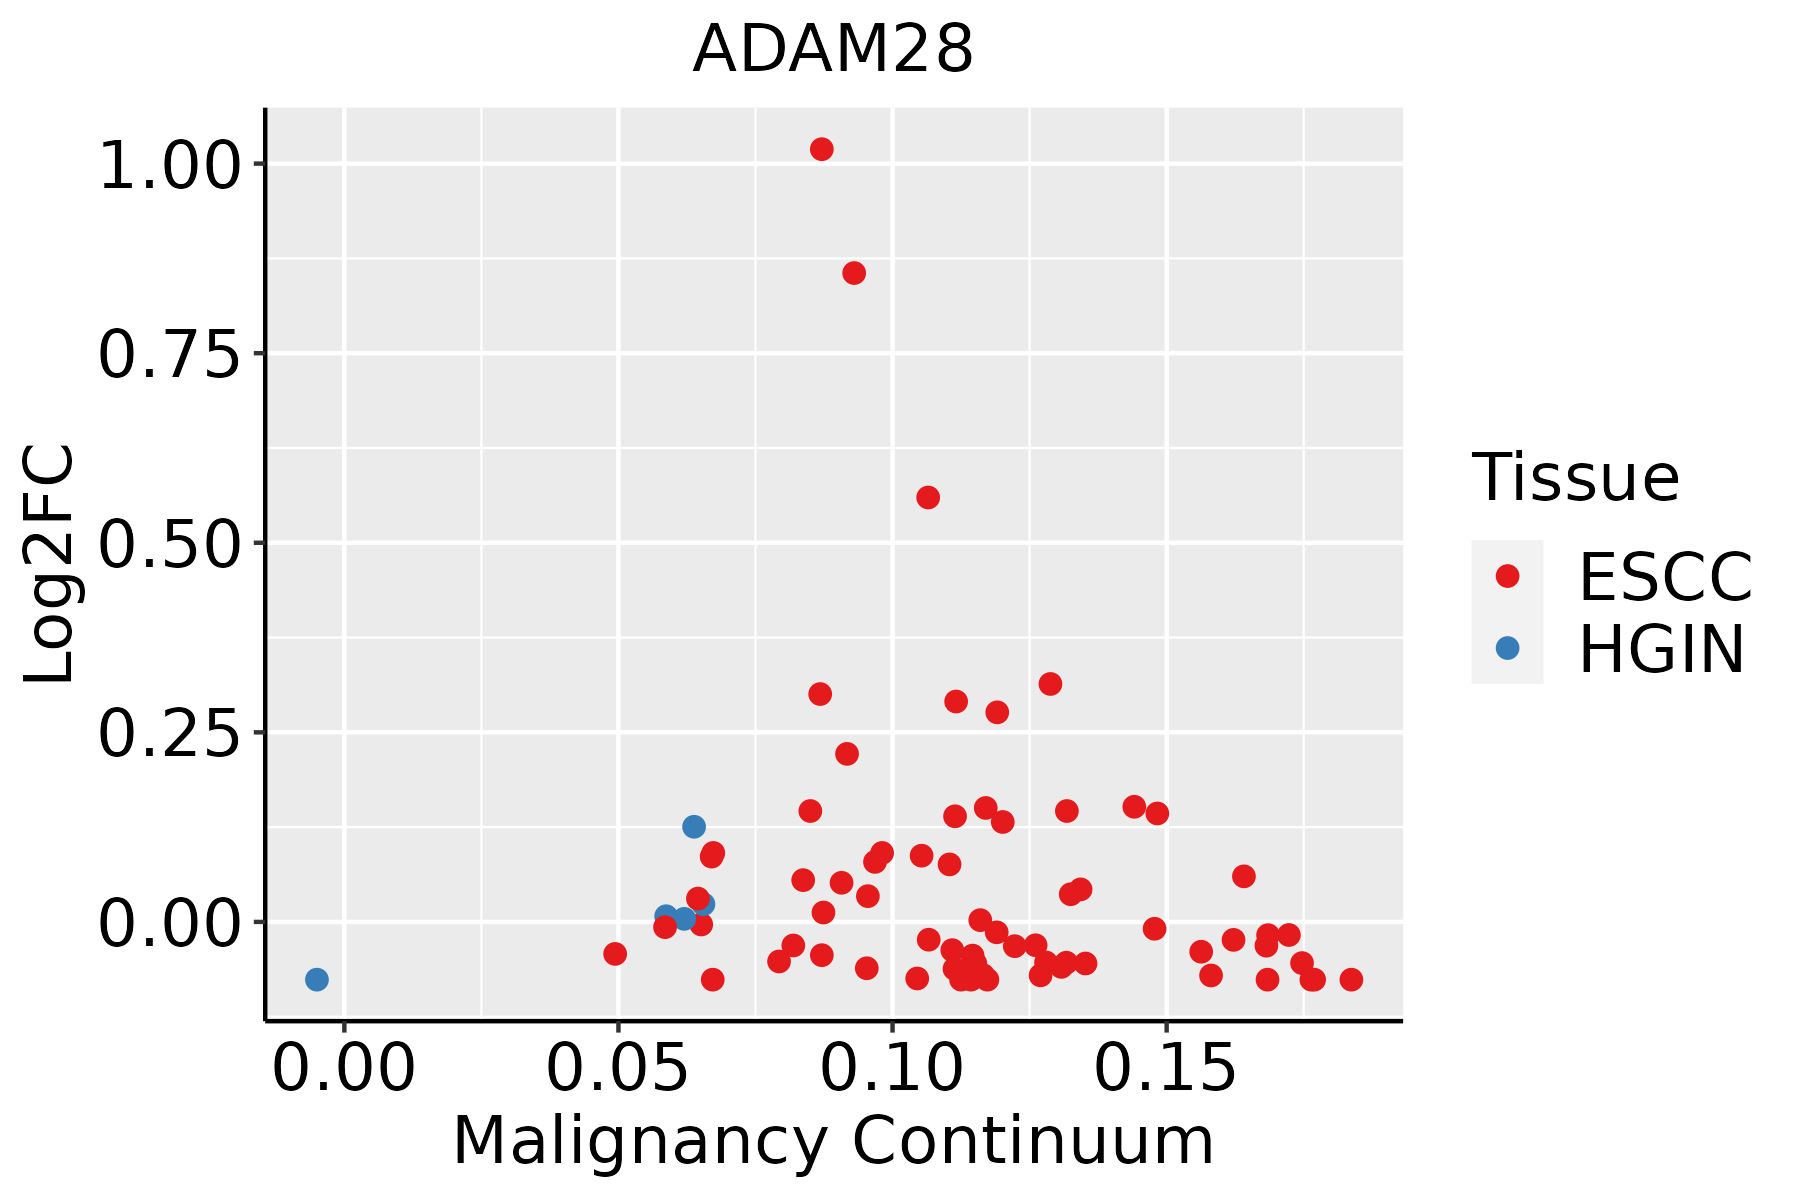 | ESCC: Esophageal squamous cell carcinoma |
| HGIN: High-grade intraepithelial neoplasias | ||
| LGIN: Low-grade intraepithelial neoplasias | ||
| GC | 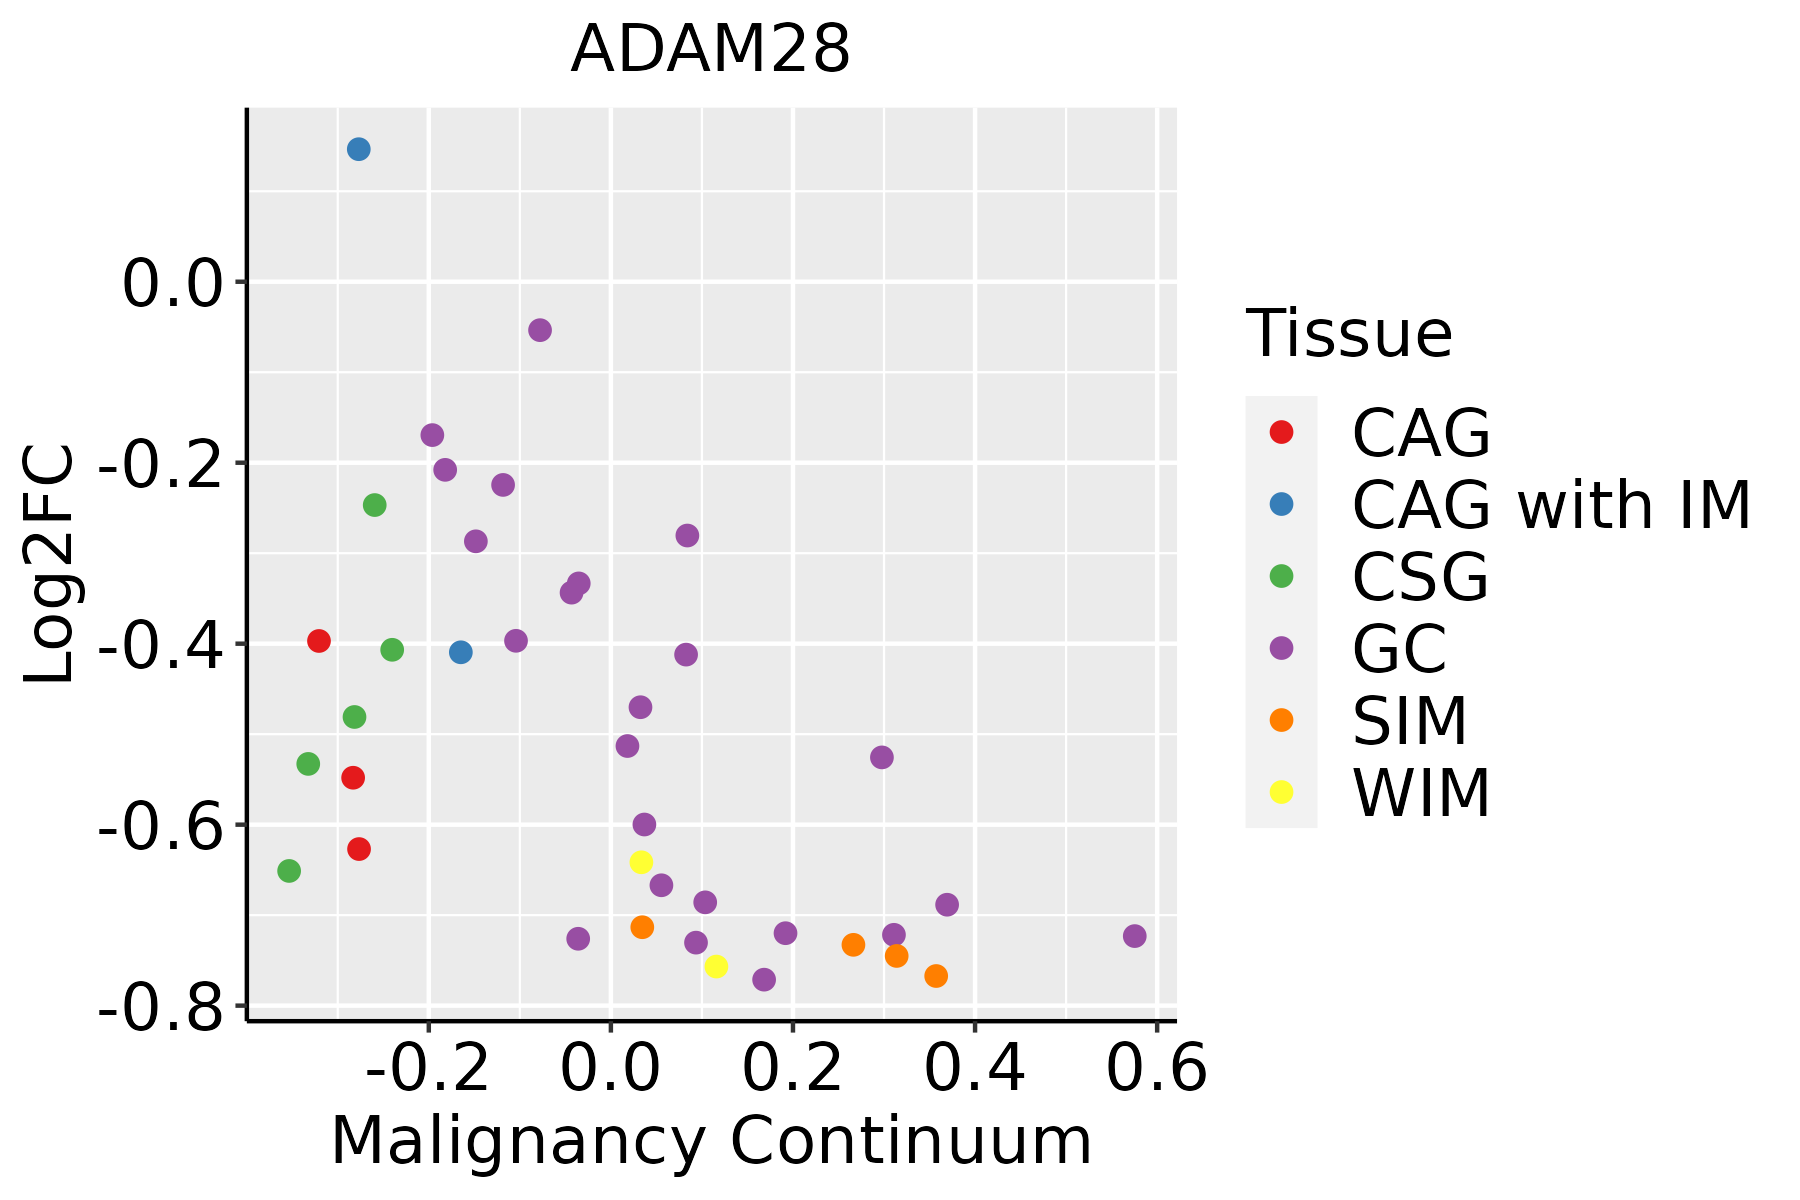 | CAG: Chronic atrophic gastritis |
| CAG with IM: Chronic atrophic gastritis with intestinal metaplasia | ||
| CSG: Chronic superficial gastritis | ||
| GC: Gastric cancer | ||
| SIM: Severe intestinal metaplasia | ||
| WIM: Wild intestinal metaplasia |
| ∗log2FC in expression of this searched gene in stem-like cells from each diseased tissue sample relative to stem-like cells in normal samples in each tissue plotted against the malignancy continuum. Samples are colored based on if they are from different disease stage. |
Top |
Malignant transformation related pathway analysis |
| Find out the enriched GO biological processes and KEGG pathways involved in transition from healthy to precancer to cancer |
| Tissue | Disease Stage | Enriched GO biological Processes |
| Colorectum | AD |  |
| Colorectum | SER |  |
| Colorectum | MSS |  |
| Colorectum | MSI-H |  |
| Colorectum | FAP |  |
| ∗Top 15 enriched GO BP terms are showed in the bar plot of each disease state in each tissue. Each row represents a significant GO biological process which is colored according to the -log10(p.adjust). |
| Page: 1 2 3 4 5 6 7 8 9 |
| GO ID | Tissue | Disease Stage | Description | Gene Ratio | Bg Ratio | pvalue | p.adjust | Count |
| Page: 1 |
| Pathway ID | Tissue | Disease Stage | Description | Gene Ratio | Bg Ratio | pvalue | p.adjust | qvalue | Count |
| Page: 1 |
Top |
Cell-cell communication analysis |
| Identification of potential cell-cell interactions between two cell types and their ligand-receptor pairs for different disease states |
| Ligand | Receptor | LRpair | Pathway | Tissue | Disease Stage |
| Page: 1 |
Top |
Single-cell gene regulatory network inference analysis |
| Find out the significant the regulons (TFs) and the target genes of each regulon across cell types for different disease states |
| TF | Cell Type | Tissue | Disease Stage | Target Gene | RSS | Regulon Activity |
| ∗The dot plots of a searched regulon are shown for all cell subpopulations in each disease state of each tissue based on the regulon specific score inferred using pySCENIC and by calculating the average expression. |
| Page: 1 |
Top |
Somatic mutation of malignant transformation related genes |
| Annotation of somatic variants for genes involved in malignant transformation |
| Hugo Symbol | Variant Class | Variant Classification | dbSNP RS | HGVSc | HGVSp | HGVSp Short | SWISSPROT | BIOTYPE | SIFT | PolyPhen | Tumor Sample Barcode | Tissue | Histology | Sex | Age | Stage | Therapy Types | Drugs | Outcome |
| ADAM28 | SNV | Missense_Mutation | novel | c.1018N>C | p.Glu340Gln | p.E340Q | Q9UKQ2 | protein_coding | deleterious(0) | probably_damaging(0.999) | TCGA-BH-A2L8-01 | Breast | breast invasive carcinoma | Female | <65 | I/II | Chemotherapy | cytoxan | CR |
| ADAM28 | SNV | Missense_Mutation | c.2206N>T | p.Asp736Tyr | p.D736Y | Q9UKQ2 | protein_coding | deleterious(0.05) | benign(0.365) | TCGA-C8-A274-01 | Breast | breast invasive carcinoma | Female | <65 | I/II | Hormone Therapy | tamoxiphen | SD | |
| ADAM28 | SNV | Missense_Mutation | rs777149299 | c.1048N>A | p.Asp350Asn | p.D350N | Q9UKQ2 | protein_coding | deleterious(0.03) | probably_damaging(0.999) | TCGA-D8-A1JA-01 | Breast | breast invasive carcinoma | Female | <65 | III/IV | Chemotherapy | adriamycin | PD |
| ADAM28 | SNV | Missense_Mutation | c.1976N>G | p.Ser659Cys | p.S659C | Q9UKQ2 | protein_coding | deleterious(0) | possibly_damaging(0.781) | TCGA-D8-A1JA-01 | Breast | breast invasive carcinoma | Female | <65 | III/IV | Chemotherapy | adriamycin | PD | |
| ADAM28 | SNV | Missense_Mutation | c.1462N>C | p.Asp488His | p.D488H | Q9UKQ2 | protein_coding | deleterious(0) | probably_damaging(0.964) | TCGA-IR-A3LK-01 | Cervix | cervical & endocervical cancer | Female | >=65 | I/II | Chemotherapy | cisplatin | PD | |
| ADAM28 | SNV | Missense_Mutation | novel | c.1319N>G | p.Lys440Arg | p.K440R | Q9UKQ2 | protein_coding | tolerated(0.08) | probably_damaging(0.999) | TCGA-AA-3984-01 | Colorectum | colon adenocarcinoma | Female | <65 | I/II | Unknown | Unknown | SD |
| ADAM28 | SNV | Missense_Mutation | c.586G>T | p.Asp196Tyr | p.D196Y | Q9UKQ2 | protein_coding | deleterious(0.01) | possibly_damaging(0.87) | TCGA-AA-A00N-01 | Colorectum | colon adenocarcinoma | Male | >=65 | I/II | Unknown | Unknown | PD | |
| ADAM28 | SNV | Missense_Mutation | c.806C>T | p.Ala269Val | p.A269V | Q9UKQ2 | protein_coding | deleterious(0.04) | possibly_damaging(0.554) | TCGA-AA-A00N-01 | Colorectum | colon adenocarcinoma | Male | >=65 | I/II | Unknown | Unknown | PD | |
| ADAM28 | SNV | Missense_Mutation | rs762484740 | c.1288N>G | p.Thr430Ala | p.T430A | Q9UKQ2 | protein_coding | deleterious(0.03) | benign(0.06) | TCGA-CK-5913-01 | Colorectum | colon adenocarcinoma | Female | <65 | I/II | Unknown | Unknown | SD |
| ADAM28 | SNV | Missense_Mutation | c.1423N>T | p.Pro475Ser | p.P475S | Q9UKQ2 | protein_coding | deleterious(0.05) | benign(0.021) | TCGA-D5-6928-01 | Colorectum | colon adenocarcinoma | Male | >=65 | I/II | Unknown | Unknown | SD |
| Page: 1 2 3 4 5 6 7 8 9 10 11 |
Top |
Related drugs of malignant transformation related genes |
| Identification of chemicals and drugs interact with genes involved in malignant transfromation |
| (DGIdb 4.0) |
| Entrez ID | Symbol | Category | Interaction Types | Drug Claim Name | Drug Name | PMIDs |
| Page: 1 |

Copyright 2023-Present -The University of Texas Health Science Center at Houston |