
|
|||||
|
 | |
| |
| |
| |
| |
| |
|
Gene: ADAM23 |
Gene summary for ADAM23 |
| Gene information | Species | Human | Gene symbol | ADAM23 | Gene ID | 8745 |
| Gene name | ADAM metallopeptidase domain 23 | |
| Gene Alias | MDC-3 | |
| Cytomap | 2q33.3 | |
| Gene Type | protein-coding | GO ID | GO:0006508 | UniProtAcc | A0A024R3W8 |
Top |
Malignant transformation analysis |
| Identification of the aberrant gene expression in precancerous and cancerous lesions by comparing the gene expression of stem-like cells in diseased tissues with normal stem cells |
| Entrez ID | Symbol | Replicates | Species | Organ | Tissue | Adj P-value | Log2FC | Malignancy |
| 8745 | ADAM23 | LZE4T | Human | Esophagus | ESCC | 5.19e-16 | 4.61e-01 | 0.0811 |
| 8745 | ADAM23 | LZE7T | Human | Esophagus | ESCC | 2.41e-03 | 2.71e-01 | 0.0667 |
| 8745 | ADAM23 | LZE21T | Human | Esophagus | ESCC | 1.12e-03 | 3.31e-01 | 0.0655 |
| 8745 | ADAM23 | P2T-E | Human | Esophagus | ESCC | 1.41e-13 | 3.25e-01 | 0.1177 |
| 8745 | ADAM23 | P4T-E | Human | Esophagus | ESCC | 3.03e-23 | 6.55e-01 | 0.1323 |
| 8745 | ADAM23 | P9T-E | Human | Esophagus | ESCC | 1.64e-08 | 2.71e-01 | 0.1131 |
| 8745 | ADAM23 | P11T-E | Human | Esophagus | ESCC | 1.08e-04 | 2.53e-01 | 0.1426 |
| 8745 | ADAM23 | P12T-E | Human | Esophagus | ESCC | 1.11e-04 | 2.00e-01 | 0.1122 |
| 8745 | ADAM23 | P15T-E | Human | Esophagus | ESCC | 1.63e-25 | 7.32e-01 | 0.1149 |
| 8745 | ADAM23 | P22T-E | Human | Esophagus | ESCC | 4.44e-15 | 2.78e-01 | 0.1236 |
| 8745 | ADAM23 | P26T-E | Human | Esophagus | ESCC | 1.21e-15 | 4.15e-01 | 0.1276 |
| 8745 | ADAM23 | P27T-E | Human | Esophagus | ESCC | 1.49e-07 | 1.97e-01 | 0.1055 |
| 8745 | ADAM23 | P30T-E | Human | Esophagus | ESCC | 4.22e-34 | 1.11e+00 | 0.137 |
| 8745 | ADAM23 | P31T-E | Human | Esophagus | ESCC | 1.25e-02 | 8.61e-02 | 0.1251 |
| 8745 | ADAM23 | P32T-E | Human | Esophagus | ESCC | 1.18e-10 | 2.80e-01 | 0.1666 |
| 8745 | ADAM23 | P37T-E | Human | Esophagus | ESCC | 3.28e-02 | 1.36e-01 | 0.1371 |
| 8745 | ADAM23 | P39T-E | Human | Esophagus | ESCC | 4.74e-07 | 1.28e-01 | 0.0894 |
| 8745 | ADAM23 | P40T-E | Human | Esophagus | ESCC | 7.95e-18 | 6.10e-01 | 0.109 |
| 8745 | ADAM23 | P42T-E | Human | Esophagus | ESCC | 1.24e-03 | 3.07e-01 | 0.1175 |
| 8745 | ADAM23 | P48T-E | Human | Esophagus | ESCC | 1.42e-17 | 6.42e-01 | 0.0959 |
| Page: 1 2 |
| Tissue | Expression Dynamics | Abbreviation |
| Esophagus | 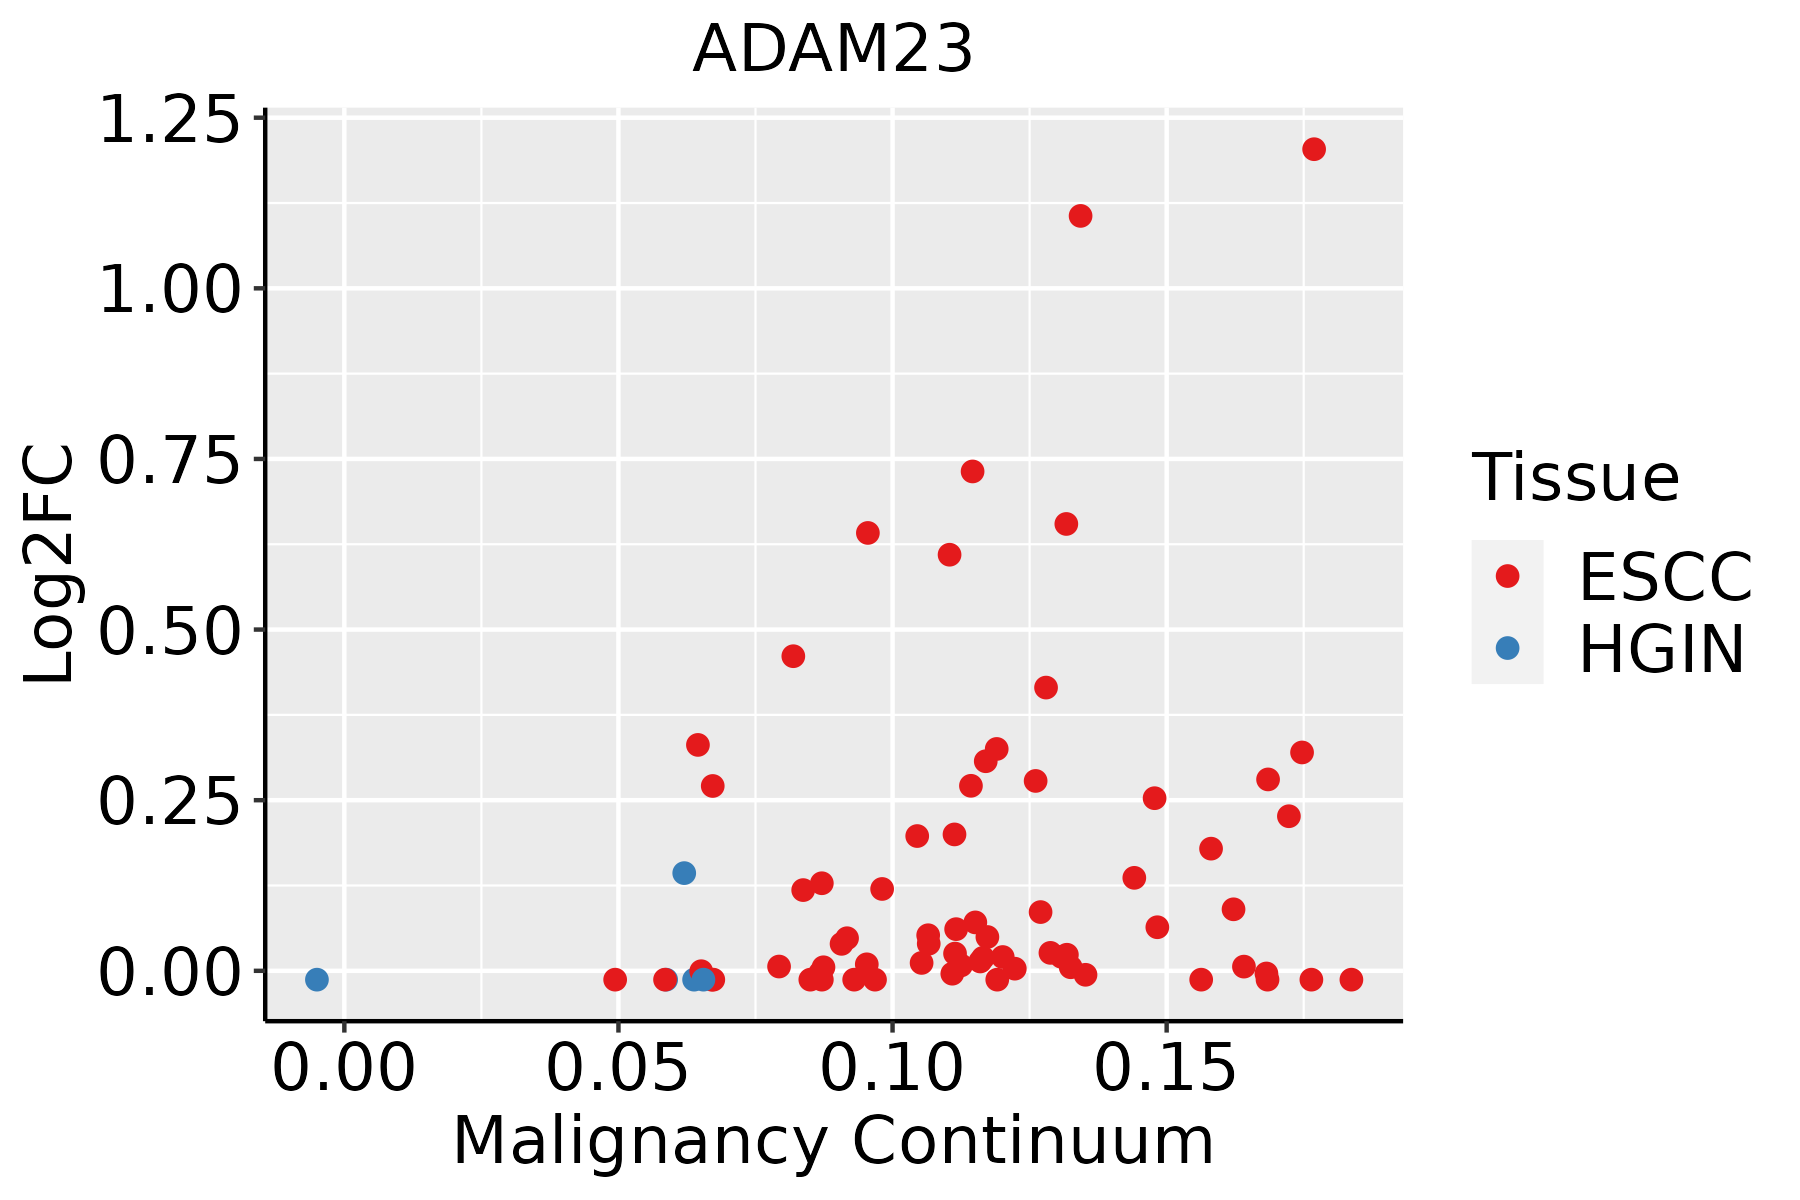 | ESCC: Esophageal squamous cell carcinoma |
| HGIN: High-grade intraepithelial neoplasias | ||
| LGIN: Low-grade intraepithelial neoplasias | ||
| Oral Cavity | 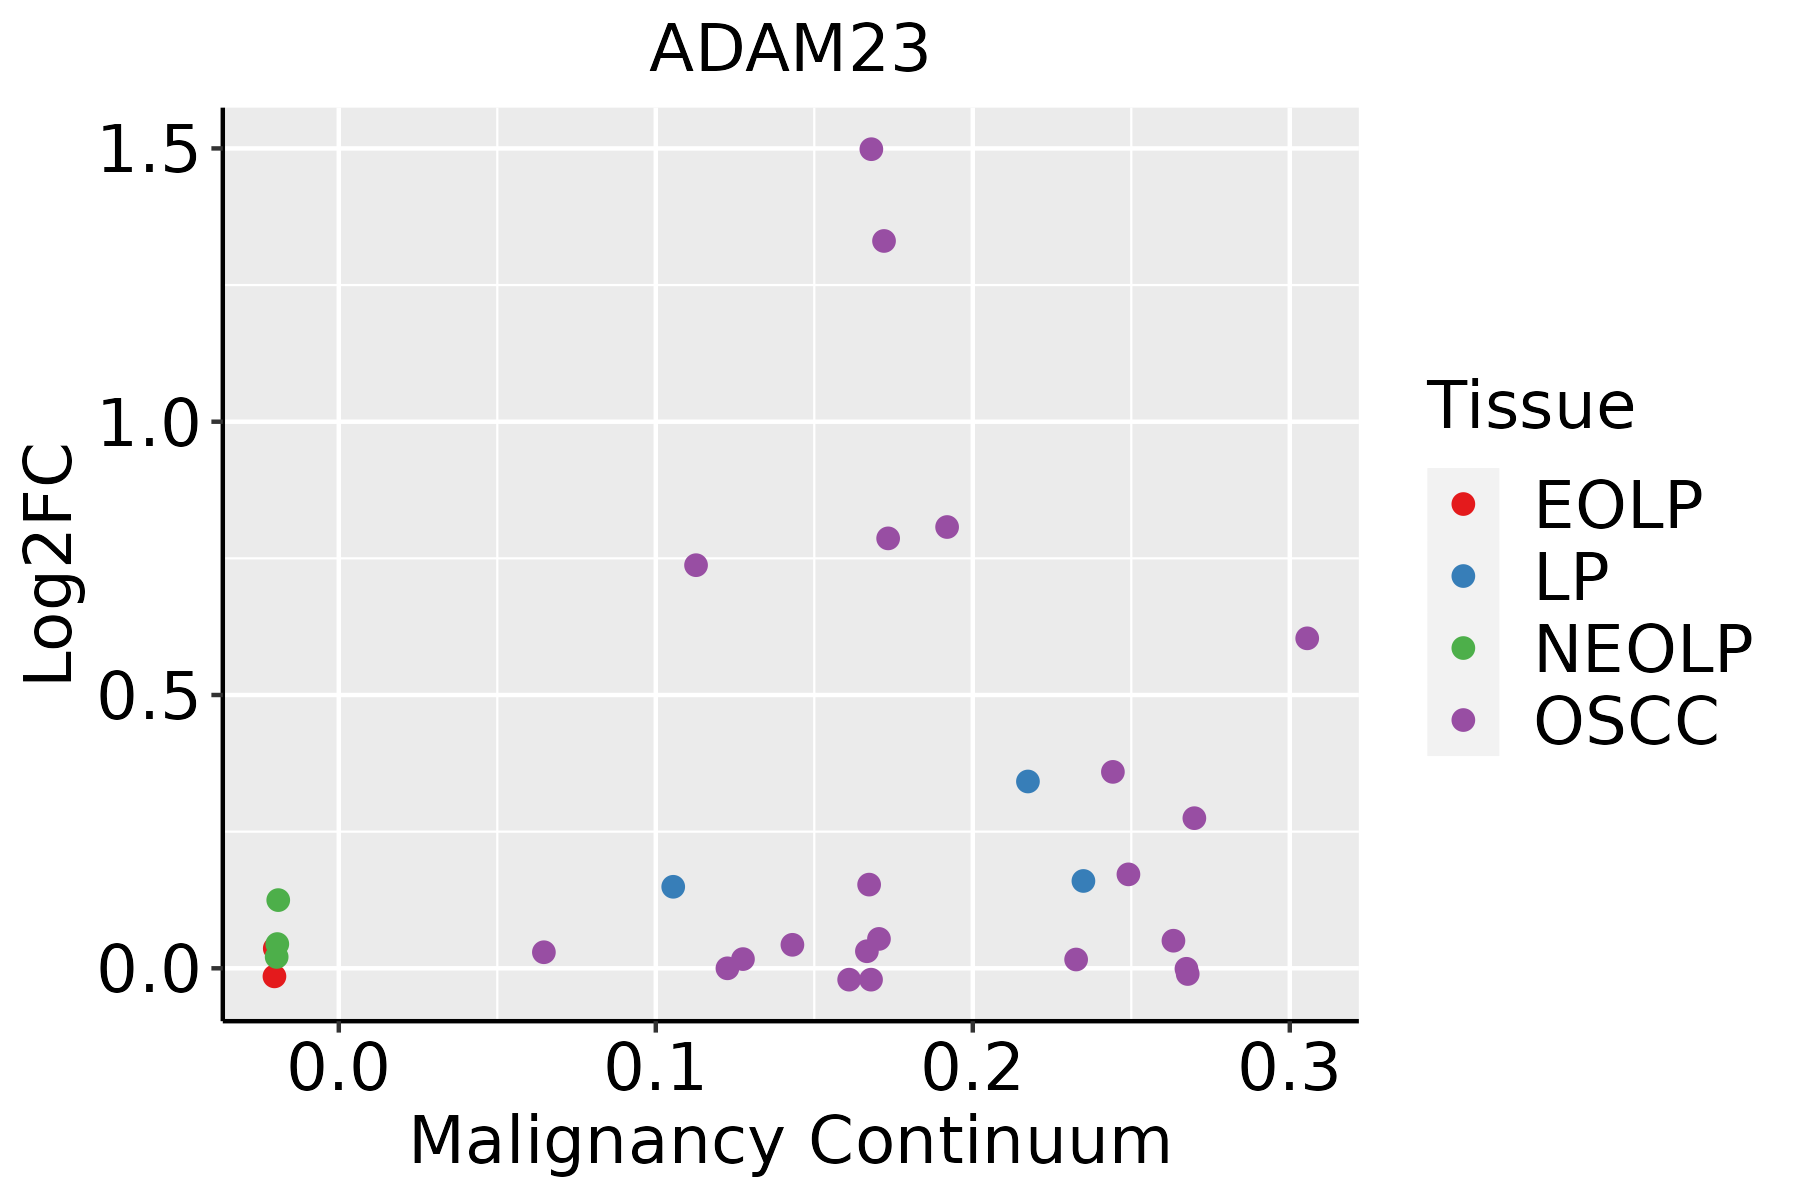 | EOLP: Erosive Oral lichen planus |
| LP: leukoplakia | ||
| NEOLP: Non-erosive oral lichen planus | ||
| OSCC: Oral squamous cell carcinoma |
| ∗log2FC in expression of this searched gene in stem-like cells from each diseased tissue sample relative to stem-like cells in normal samples in each tissue plotted against the malignancy continuum. Samples are colored based on if they are from different disease stage. |
Top |
Malignant transformation related pathway analysis |
| Find out the enriched GO biological processes and KEGG pathways involved in transition from healthy to precancer to cancer |
| Tissue | Disease Stage | Enriched GO biological Processes |
| Colorectum | AD |  |
| Colorectum | SER |  |
| Colorectum | MSS |  |
| Colorectum | MSI-H |  |
| Colorectum | FAP |  |
| ∗Top 15 enriched GO BP terms are showed in the bar plot of each disease state in each tissue. Each row represents a significant GO biological process which is colored according to the -log10(p.adjust). |
| Page: 1 2 3 4 5 6 7 8 9 |
| GO ID | Tissue | Disease Stage | Description | Gene Ratio | Bg Ratio | pvalue | p.adjust | Count |
| GO:199082316 | Esophagus | ESCC | response to leukemia inhibitory factor | 60/8552 | 95/18723 | 4.41e-04 | 2.48e-03 | 60 |
| GO:199083015 | Esophagus | ESCC | cellular response to leukemia inhibitory factor | 59/8552 | 94/18723 | 6.19e-04 | 3.32e-03 | 59 |
| GO:19908237 | Oral cavity | OSCC | response to leukemia inhibitory factor | 58/7305 | 95/18723 | 1.10e-05 | 1.14e-04 | 58 |
| GO:19908307 | Oral cavity | OSCC | cellular response to leukemia inhibitory factor | 57/7305 | 94/18723 | 1.75e-05 | 1.71e-04 | 57 |
| Page: 1 |
| Pathway ID | Tissue | Disease Stage | Description | Gene Ratio | Bg Ratio | pvalue | p.adjust | qvalue | Count |
| Page: 1 |
Top |
Cell-cell communication analysis |
| Identification of potential cell-cell interactions between two cell types and their ligand-receptor pairs for different disease states |
| Ligand | Receptor | LRpair | Pathway | Tissue | Disease Stage |
| Page: 1 |
Top |
Single-cell gene regulatory network inference analysis |
| Find out the significant the regulons (TFs) and the target genes of each regulon across cell types for different disease states |
| TF | Cell Type | Tissue | Disease Stage | Target Gene | RSS | Regulon Activity |
| ∗The dot plots of a searched regulon are shown for all cell subpopulations in each disease state of each tissue based on the regulon specific score inferred using pySCENIC and by calculating the average expression. |
| Page: 1 |
Top |
Somatic mutation of malignant transformation related genes |
| Annotation of somatic variants for genes involved in malignant transformation |
| Hugo Symbol | Variant Class | Variant Classification | dbSNP RS | HGVSc | HGVSp | HGVSp Short | SWISSPROT | BIOTYPE | SIFT | PolyPhen | Tumor Sample Barcode | Tissue | Histology | Sex | Age | Stage | Therapy Types | Drugs | Outcome |
| ADAM23 | SNV | Missense_Mutation | c.1418N>T | p.Ser473Leu | p.S473L | O75077 | protein_coding | deleterious(0) | probably_damaging(0.997) | TCGA-D8-A1XU-01 | Breast | breast invasive carcinoma | Female | <65 | I/II | Unknown | Unknown | SD | |
| ADAM23 | SNV | Missense_Mutation | novel | c.245A>T | p.Asn82Ile | p.N82I | O75077 | protein_coding | tolerated_low_confidence(0.19) | benign(0) | TCGA-E2-A576-01 | Breast | breast invasive carcinoma | Female | >=65 | I/II | Chemotherapy | taxotere | SD |
| ADAM23 | SNV | Missense_Mutation | c.2482C>A | p.Gln828Lys | p.Q828K | O75077 | protein_coding | deleterious(0.03) | benign(0.072) | TCGA-E9-A1R4-01 | Breast | breast invasive carcinoma | Female | >=65 | I/II | Chemotherapy | 5-fluorouracil | SD | |
| ADAM23 | insertion | Frame_Shift_Ins | rs767549806 | c.2333_2334insC | p.Lys781GlnfsTer3 | p.K781Qfs*3 | O75077 | protein_coding | TCGA-AR-A0TY-01 | Breast | breast invasive carcinoma | Female | <65 | I/II | Unspecific | Paclitaxel | PD | ||
| ADAM23 | deletion | Frame_Shift_Del | c.2334delN | p.Lys781ArgfsTer14 | p.K781Rfs*14 | O75077 | protein_coding | TCGA-D8-A1XK-01 | Breast | breast invasive carcinoma | Female | <65 | I/II | Chemotherapy | doxorubicine+cyclophosphamide | SD | |||
| ADAM23 | SNV | Missense_Mutation | rs768532736 | c.1289C>T | p.Ser430Leu | p.S430L | O75077 | protein_coding | deleterious(0) | benign(0.053) | TCGA-2W-A8YY-01 | Cervix | cervical & endocervical cancer | Female | <65 | I/II | Chemotherapy | cisplatin | CR |
| ADAM23 | SNV | Missense_Mutation | novel | c.1201C>G | p.Leu401Val | p.L401V | O75077 | protein_coding | tolerated(0.37) | benign(0.034) | TCGA-EA-A43B-01 | Cervix | cervical & endocervical cancer | Female | <65 | I/II | Chemotherapy | cisplatin | CR |
| ADAM23 | SNV | Missense_Mutation | c.1519N>C | p.Asn507His | p.N507H | O75077 | protein_coding | deleterious(0) | probably_damaging(1) | TCGA-FU-A3HZ-01 | Cervix | cervical & endocervical cancer | Female | <65 | I/II | Chemotherapy | cisplatin | CR | |
| ADAM23 | SNV | Missense_Mutation | c.803N>T | p.Arg268Ile | p.R268I | O75077 | protein_coding | tolerated(0.17) | benign(0) | TCGA-JX-A3Q0-01 | Cervix | cervical & endocervical cancer | Female | <65 | III/IV | Unknown | Unknown | SD | |
| ADAM23 | deletion | Frame_Shift_Del | c.2334delN | p.Lys781ArgfsTer14 | p.K781Rfs*14 | O75077 | protein_coding | TCGA-VS-A94Z-01 | Cervix | cervical & endocervical cancer | Female | <65 | I/II | Chemotherapy | cisplatin | CR |
| Page: 1 2 3 4 5 6 7 8 9 10 11 12 13 14 |
Top |
Related drugs of malignant transformation related genes |
| Identification of chemicals and drugs interact with genes involved in malignant transfromation |
| (DGIdb 4.0) |
| Entrez ID | Symbol | Category | Interaction Types | Drug Claim Name | Drug Name | PMIDs |
| Page: 1 |

Copyright 2023-Present -The University of Texas Health Science Center at Houston |