
|
|||||
|
 | |
| |
| |
| |
| |
| |
|
Gene: ADAM19 |
Gene summary for ADAM19 |
| Gene information | Species | Human | Gene symbol | ADAM19 | Gene ID | 8728 |
| Gene name | ADAM metallopeptidase domain 19 | |
| Gene Alias | FKSG34 | |
| Cytomap | 5q33.3 | |
| Gene Type | protein-coding | GO ID | GO:0000003 | UniProtAcc | Q8TBU7 |
Top |
Malignant transformation analysis |
| Identification of the aberrant gene expression in precancerous and cancerous lesions by comparing the gene expression of stem-like cells in diseased tissues with normal stem cells |
| Entrez ID | Symbol | Replicates | Species | Organ | Tissue | Adj P-value | Log2FC | Malignancy |
| 8728 | ADAM19 | C30 | Human | Oral cavity | OSCC | 1.10e-05 | 7.01e-01 | 0.3055 |
| 8728 | ADAM19 | C43 | Human | Oral cavity | OSCC | 1.90e-10 | 2.05e-01 | 0.1704 |
| 8728 | ADAM19 | C46 | Human | Oral cavity | OSCC | 6.95e-03 | 7.40e-02 | 0.1673 |
| 8728 | ADAM19 | EOLP-1 | Human | Oral cavity | EOLP | 8.81e-25 | 6.02e-01 | -0.0202 |
| 8728 | ADAM19 | EOLP-2 | Human | Oral cavity | EOLP | 1.86e-04 | 1.42e-01 | -0.0203 |
| 8728 | ADAM19 | NEOLP-3 | Human | Oral cavity | NEOLP | 1.98e-06 | 1.72e-01 | -0.0191 |
| 8728 | ADAM19 | ATC09 | Human | Thyroid | ATC | 9.00e-08 | 3.42e-01 | 0.2871 |
| 8728 | ADAM19 | ATC11 | Human | Thyroid | ATC | 3.34e-11 | 7.72e-01 | 0.3386 |
| 8728 | ADAM19 | ATC12 | Human | Thyroid | ATC | 8.51e-03 | 5.98e-02 | 0.34 |
| 8728 | ADAM19 | ATC13 | Human | Thyroid | ATC | 1.38e-08 | 1.66e-01 | 0.34 |
| 8728 | ADAM19 | ATC1 | Human | Thyroid | ATC | 8.73e-06 | 3.09e-01 | 0.2878 |
| 8728 | ADAM19 | ATC2 | Human | Thyroid | ATC | 4.17e-22 | 1.91e+00 | 0.34 |
| 8728 | ADAM19 | ATC3 | Human | Thyroid | ATC | 3.03e-13 | 7.87e-01 | 0.338 |
| 8728 | ADAM19 | ATC5 | Human | Thyroid | ATC | 1.05e-07 | 1.80e-01 | 0.34 |
| Page: 1 |
| Tissue | Expression Dynamics | Abbreviation |
| Oral Cavity |  | EOLP: Erosive Oral lichen planus |
| LP: leukoplakia | ||
| NEOLP: Non-erosive oral lichen planus | ||
| OSCC: Oral squamous cell carcinoma | ||
| Thyroid | 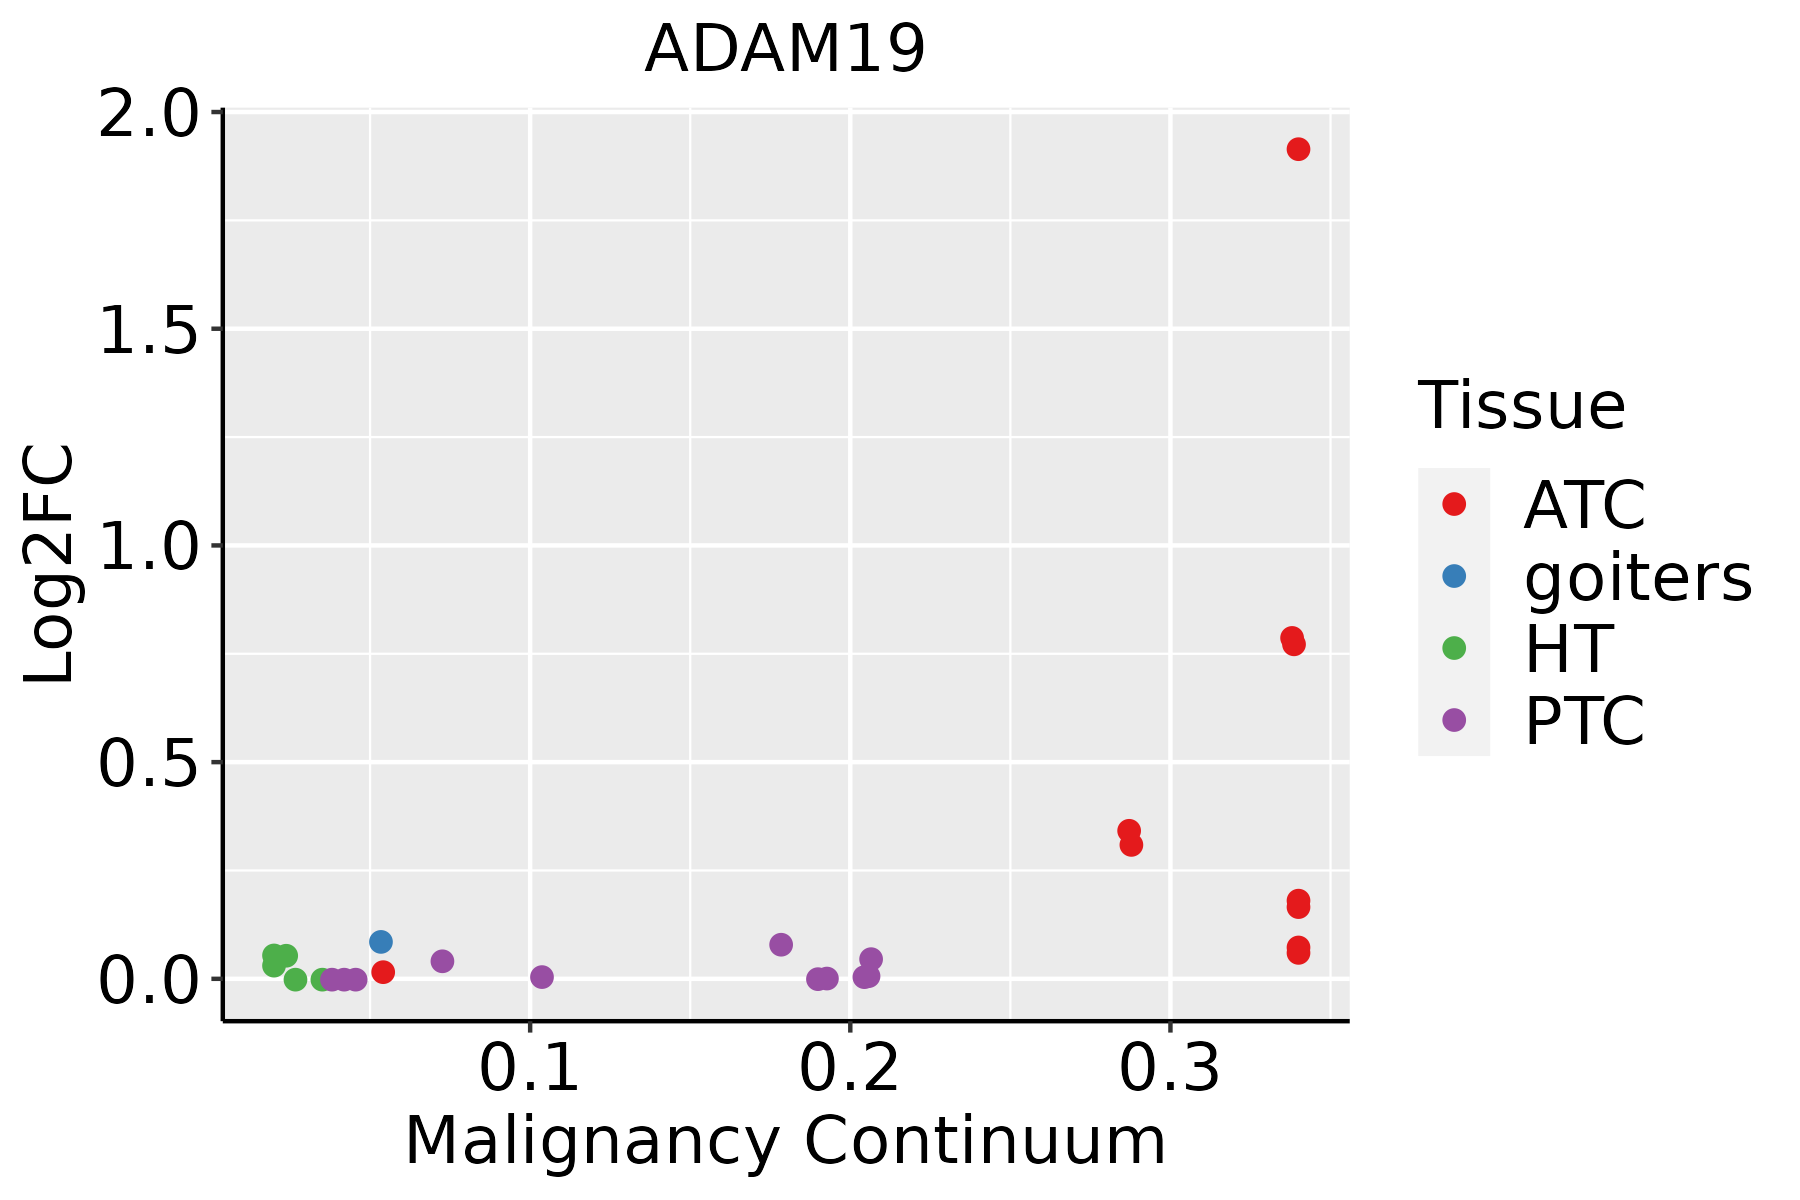 | ATC: Anaplastic thyroid cancer |
| HT: Hashimoto's thyroiditis | ||
| PTC: Papillary thyroid cancer |
| ∗log2FC in expression of this searched gene in stem-like cells from each diseased tissue sample relative to stem-like cells in normal samples in each tissue plotted against the malignancy continuum. Samples are colored based on if they are from different disease stage. |
Top |
Malignant transformation related pathway analysis |
| Find out the enriched GO biological processes and KEGG pathways involved in transition from healthy to precancer to cancer |
| Tissue | Disease Stage | Enriched GO biological Processes |
| Colorectum | AD |  |
| Colorectum | SER |  |
| Colorectum | MSS |  |
| Colorectum | MSI-H |  |
| Colorectum | FAP |  |
| ∗Top 15 enriched GO BP terms are showed in the bar plot of each disease state in each tissue. Each row represents a significant GO biological process which is colored according to the -log10(p.adjust). |
| Page: 1 2 3 4 5 6 7 8 9 |
| GO ID | Tissue | Disease Stage | Description | Gene Ratio | Bg Ratio | pvalue | p.adjust | Count |
| GO:005160410 | Oral cavity | OSCC | protein maturation | 170/7305 | 294/18723 | 3.97e-11 | 1.28e-09 | 170 |
| GO:004578520 | Oral cavity | OSCC | positive regulation of cell adhesion | 225/7305 | 437/18723 | 6.06e-08 | 1.09e-06 | 225 |
| GO:000189017 | Oral cavity | OSCC | placenta development | 87/7305 | 144/18723 | 1.54e-07 | 2.56e-06 | 87 |
| GO:006145817 | Oral cavity | OSCC | reproductive system development | 217/7305 | 427/18723 | 3.75e-07 | 5.63e-06 | 217 |
| GO:004860816 | Oral cavity | OSCC | reproductive structure development | 214/7305 | 424/18723 | 8.58e-07 | 1.18e-05 | 214 |
| GO:00164856 | Oral cavity | OSCC | protein processing | 121/7305 | 225/18723 | 4.56e-06 | 5.23e-05 | 121 |
| GO:002240718 | Oral cavity | OSCC | regulation of cell-cell adhesion | 218/7305 | 448/18723 | 1.71e-05 | 1.68e-04 | 218 |
| GO:00336194 | Oral cavity | OSCC | membrane protein proteolysis | 37/7305 | 57/18723 | 6.66e-05 | 5.38e-04 | 37 |
| GO:00065094 | Oral cavity | OSCC | membrane protein ectodomain proteolysis | 29/7305 | 43/18723 | 1.49e-04 | 1.05e-03 | 29 |
| GO:00429873 | Oral cavity | OSCC | amyloid precursor protein catabolic process | 40/7305 | 68/18723 | 7.28e-04 | 3.98e-03 | 40 |
| GO:00429823 | Oral cavity | OSCC | amyloid precursor protein metabolic process | 52/7305 | 95/18723 | 1.33e-03 | 6.62e-03 | 52 |
| GO:002240917 | Oral cavity | OSCC | positive regulation of cell-cell adhesion | 136/7305 | 284/18723 | 1.35e-03 | 6.62e-03 | 136 |
| GO:004578526 | Oral cavity | EOLP | positive regulation of cell adhesion | 95/2218 | 437/18723 | 2.30e-09 | 1.47e-07 | 95 |
| GO:002240719 | Oral cavity | EOLP | regulation of cell-cell adhesion | 93/2218 | 448/18723 | 3.65e-08 | 1.41e-06 | 93 |
| GO:000189023 | Oral cavity | EOLP | placenta development | 39/2218 | 144/18723 | 4.49e-07 | 1.25e-05 | 39 |
| GO:006145824 | Oral cavity | EOLP | reproductive system development | 81/2218 | 427/18723 | 1.09e-05 | 1.93e-04 | 81 |
| GO:004860823 | Oral cavity | EOLP | reproductive structure development | 80/2218 | 424/18723 | 1.51e-05 | 2.50e-04 | 80 |
| GO:002240918 | Oral cavity | EOLP | positive regulation of cell-cell adhesion | 57/2218 | 284/18723 | 4.23e-05 | 5.77e-04 | 57 |
| GO:003361921 | Oral cavity | EOLP | membrane protein proteolysis | 16/2218 | 57/18723 | 7.07e-04 | 5.78e-03 | 16 |
| GO:000650912 | Oral cavity | EOLP | membrane protein ectodomain proteolysis | 13/2218 | 43/18723 | 1.03e-03 | 7.63e-03 | 13 |
| Page: 1 2 3 |
| Pathway ID | Tissue | Disease Stage | Description | Gene Ratio | Bg Ratio | pvalue | p.adjust | qvalue | Count |
| Page: 1 |
Top |
Cell-cell communication analysis |
| Identification of potential cell-cell interactions between two cell types and their ligand-receptor pairs for different disease states |
| Ligand | Receptor | LRpair | Pathway | Tissue | Disease Stage |
| Page: 1 |
Top |
Single-cell gene regulatory network inference analysis |
| Find out the significant the regulons (TFs) and the target genes of each regulon across cell types for different disease states |
| TF | Cell Type | Tissue | Disease Stage | Target Gene | RSS | Regulon Activity |
| ∗The dot plots of a searched regulon are shown for all cell subpopulations in each disease state of each tissue based on the regulon specific score inferred using pySCENIC and by calculating the average expression. |
| Page: 1 |
Top |
Somatic mutation of malignant transformation related genes |
| Annotation of somatic variants for genes involved in malignant transformation |
| Hugo Symbol | Variant Class | Variant Classification | dbSNP RS | HGVSc | HGVSp | HGVSp Short | SWISSPROT | BIOTYPE | SIFT | PolyPhen | Tumor Sample Barcode | Tissue | Histology | Sex | Age | Stage | Therapy Types | Drugs | Outcome |
| ADAM19 | SNV | Missense_Mutation | c.2739N>A | p.Met913Ile | p.M913I | Q9H013 | protein_coding | tolerated_low_confidence(0.24) | benign(0.001) | TCGA-A7-A4SD-01 | Breast | breast invasive carcinoma | Female | <65 | I/II | Chemotherapy | taxotere | CR | |
| ADAM19 | SNV | Missense_Mutation | c.842N>G | p.Ser281Cys | p.S281C | Q9H013 | protein_coding | deleterious(0) | probably_damaging(0.974) | TCGA-BH-A18P-01 | Breast | breast invasive carcinoma | Female | <65 | I/II | Unknown | Unknown | PD | |
| ADAM19 | SNV | Missense_Mutation | novel | c.613G>T | p.Asp205Tyr | p.D205Y | Q9H013 | protein_coding | deleterious(0.04) | possibly_damaging(0.875) | TCGA-C8-A8HP-01 | Breast | breast invasive carcinoma | Female | <65 | III/IV | Chemotherapy | 5-fluorouracil | CR |
| ADAM19 | SNV | Missense_Mutation | c.655N>C | p.Asp219His | p.D219H | Q9H013 | protein_coding | deleterious(0) | probably_damaging(1) | TCGA-E2-A156-01 | Breast | breast invasive carcinoma | Female | <65 | I/II | Hormone Therapy | arimidex | SD | |
| ADAM19 | SNV | Missense_Mutation | c.404N>C | p.Ile135Thr | p.I135T | Q9H013 | protein_coding | deleterious(0) | benign(0.107) | TCGA-GI-A2C8-01 | Breast | breast invasive carcinoma | Female | <65 | III/IV | Unspecific | Adriamycin | SD | |
| ADAM19 | SNV | Missense_Mutation | novel | c.913N>C | p.Ser305Pro | p.S305P | Q9H013 | protein_coding | tolerated(0.2) | benign(0.006) | TCGA-PE-A5DC-01 | Breast | breast invasive carcinoma | Female | >=65 | III/IV | Unknown | Unknown | SD |
| ADAM19 | insertion | Nonsense_Mutation | novel | c.538_539insTGGTGTTTCGAGGTTTCGAGGTTCTGTGGGAACGTGGTGGTT | p.Lys180delinsMetValPheArgGlyPheGluValLeuTrpGluArgGlyGlyTer | p.K180delinsMVFRGFEVLWERGG* | Q9H013 | protein_coding | TCGA-A8-A07R-01 | Breast | breast invasive carcinoma | Female | >=65 | III/IV | Ancillary | zoledronic | SD | ||
| ADAM19 | insertion | Frame_Shift_Ins | novel | c.1786_1787insAAAGTGATTTATTATTTTGGATATGGAAGACGTACAG | p.Ile596LysfsTer32 | p.I596Kfs*32 | Q9H013 | protein_coding | TCGA-AN-A0FN-01 | Breast | breast invasive carcinoma | Female | <65 | I/II | Unknown | Unknown | SD | ||
| ADAM19 | insertion | In_Frame_Ins | novel | c.801_802insTTCAAACCATTTTTCTTCTGTTCCCTAAATATAGCT | p.Asn267_Met268insPheLysProPhePhePheCysSerLeuAsnIleAla | p.N267_M268insFKPFFFCSLNIA | Q9H013 | protein_coding | TCGA-B6-A0I8-01 | Breast | breast invasive carcinoma | Female | <65 | I/II | Unknown | Unknown | PD | ||
| ADAM19 | deletion | Frame_Shift_Del | novel | c.1113delN | p.Met372TrpfsTer79 | p.M372Wfs*79 | Q9H013 | protein_coding | TCGA-EW-A2FV-01 | Breast | breast invasive carcinoma | Female | <65 | III/IV | Chemotherapy | docetaxel | SD |
| Page: 1 2 3 4 5 6 7 8 9 10 11 12 13 14 |
Top |
Related drugs of malignant transformation related genes |
| Identification of chemicals and drugs interact with genes involved in malignant transfromation |
| (DGIdb 4.0) |
| Entrez ID | Symbol | Category | Interaction Types | Drug Claim Name | Drug Name | PMIDs |
| Page: 1 |

Copyright 2023-Present -The University of Texas Health Science Center at Houston |