
|
|||||
|
 | |
| |
| |
| |
| |
| |
|
Gene: ADAM15 |
Gene summary for ADAM15 |
| Gene information | Species | Human | Gene symbol | ADAM15 | Gene ID | 8751 |
| Gene name | ADAM metallopeptidase domain 15 | |
| Gene Alias | MDC15 | |
| Cytomap | 1q21.3 | |
| Gene Type | protein-coding | GO ID | GO:0000003 | UniProtAcc | Q13444 |
Top |
Malignant transformation analysis |
| Identification of the aberrant gene expression in precancerous and cancerous lesions by comparing the gene expression of stem-like cells in diseased tissues with normal stem cells |
| Entrez ID | Symbol | Replicates | Species | Organ | Tissue | Adj P-value | Log2FC | Malignancy |
| 8751 | ADAM15 | LZE2T | Human | Esophagus | ESCC | 6.19e-05 | 8.92e-01 | 0.082 |
| 8751 | ADAM15 | LZE4T | Human | Esophagus | ESCC | 1.49e-09 | 1.84e-01 | 0.0811 |
| 8751 | ADAM15 | LZE5T | Human | Esophagus | ESCC | 2.39e-08 | 2.20e-01 | 0.0514 |
| 8751 | ADAM15 | LZE7T | Human | Esophagus | ESCC | 3.92e-11 | 3.93e-01 | 0.0667 |
| 8751 | ADAM15 | LZE8T | Human | Esophagus | ESCC | 1.51e-08 | 1.12e-01 | 0.067 |
| 8751 | ADAM15 | LZE20T | Human | Esophagus | ESCC | 2.05e-04 | 3.22e-01 | 0.0662 |
| 8751 | ADAM15 | LZE22D1 | Human | Esophagus | HGIN | 2.76e-04 | 1.32e-01 | 0.0595 |
| 8751 | ADAM15 | LZE22T | Human | Esophagus | ESCC | 2.18e-03 | 5.32e-01 | 0.068 |
| 8751 | ADAM15 | LZE24T | Human | Esophagus | ESCC | 2.88e-31 | 7.43e-01 | 0.0596 |
| 8751 | ADAM15 | LZE21T | Human | Esophagus | ESCC | 1.64e-07 | 5.67e-01 | 0.0655 |
| 8751 | ADAM15 | P1T-E | Human | Esophagus | ESCC | 1.65e-24 | 1.11e+00 | 0.0875 |
| 8751 | ADAM15 | P2T-E | Human | Esophagus | ESCC | 9.70e-33 | 7.43e-01 | 0.1177 |
| 8751 | ADAM15 | P4T-E | Human | Esophagus | ESCC | 3.59e-22 | 4.17e-01 | 0.1323 |
| 8751 | ADAM15 | P5T-E | Human | Esophagus | ESCC | 4.04e-32 | 6.99e-01 | 0.1327 |
| 8751 | ADAM15 | P8T-E | Human | Esophagus | ESCC | 1.54e-16 | 4.70e-01 | 0.0889 |
| 8751 | ADAM15 | P9T-E | Human | Esophagus | ESCC | 1.82e-20 | 4.89e-01 | 0.1131 |
| 8751 | ADAM15 | P10T-E | Human | Esophagus | ESCC | 1.97e-13 | 1.77e-01 | 0.116 |
| 8751 | ADAM15 | P11T-E | Human | Esophagus | ESCC | 8.50e-26 | 8.83e-01 | 0.1426 |
| 8751 | ADAM15 | P12T-E | Human | Esophagus | ESCC | 8.80e-19 | 4.90e-01 | 0.1122 |
| 8751 | ADAM15 | P15T-E | Human | Esophagus | ESCC | 2.37e-46 | 1.03e+00 | 0.1149 |
| Page: 1 2 3 4 5 6 7 |
| Tissue | Expression Dynamics | Abbreviation |
| Esophagus | 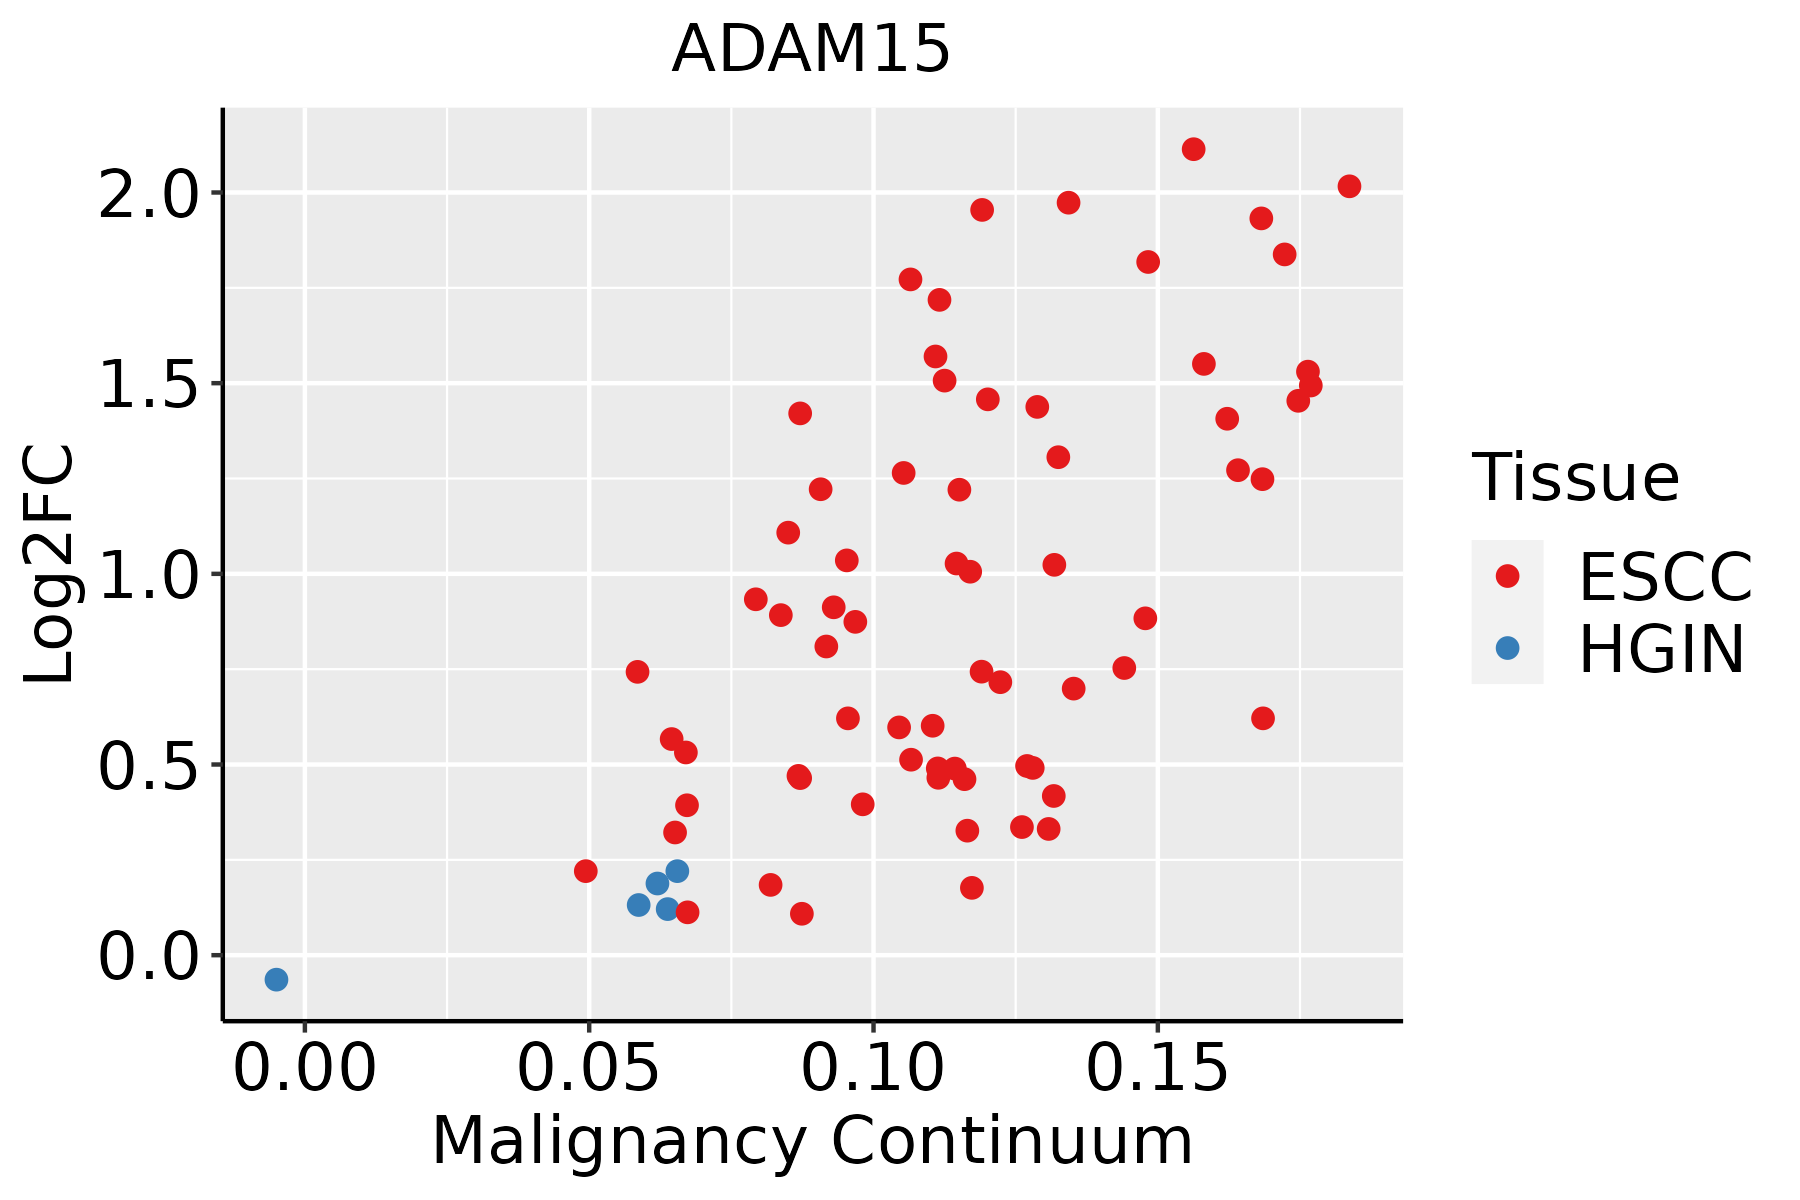 | ESCC: Esophageal squamous cell carcinoma |
| HGIN: High-grade intraepithelial neoplasias | ||
| LGIN: Low-grade intraepithelial neoplasias | ||
| Liver | 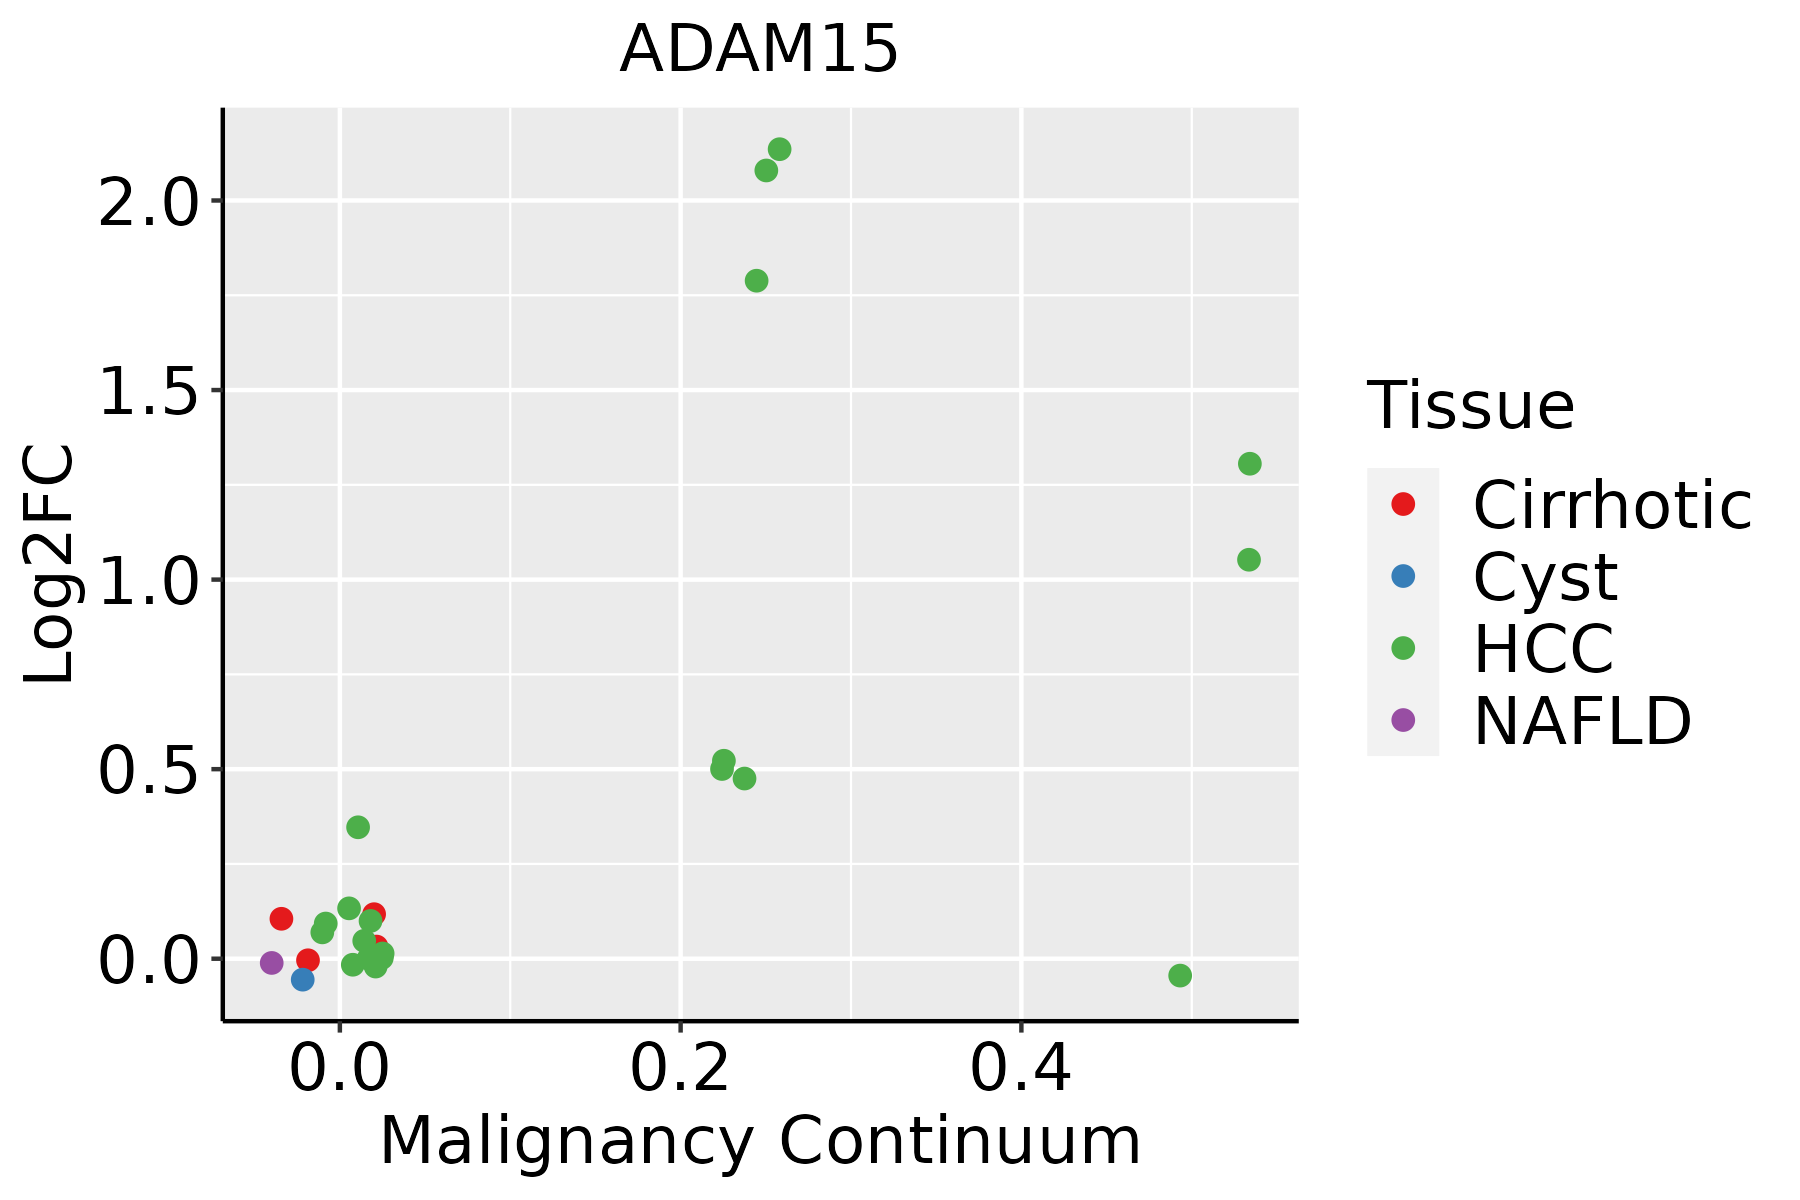 | HCC: Hepatocellular carcinoma |
| NAFLD: Non-alcoholic fatty liver disease | ||
| Oral Cavity | 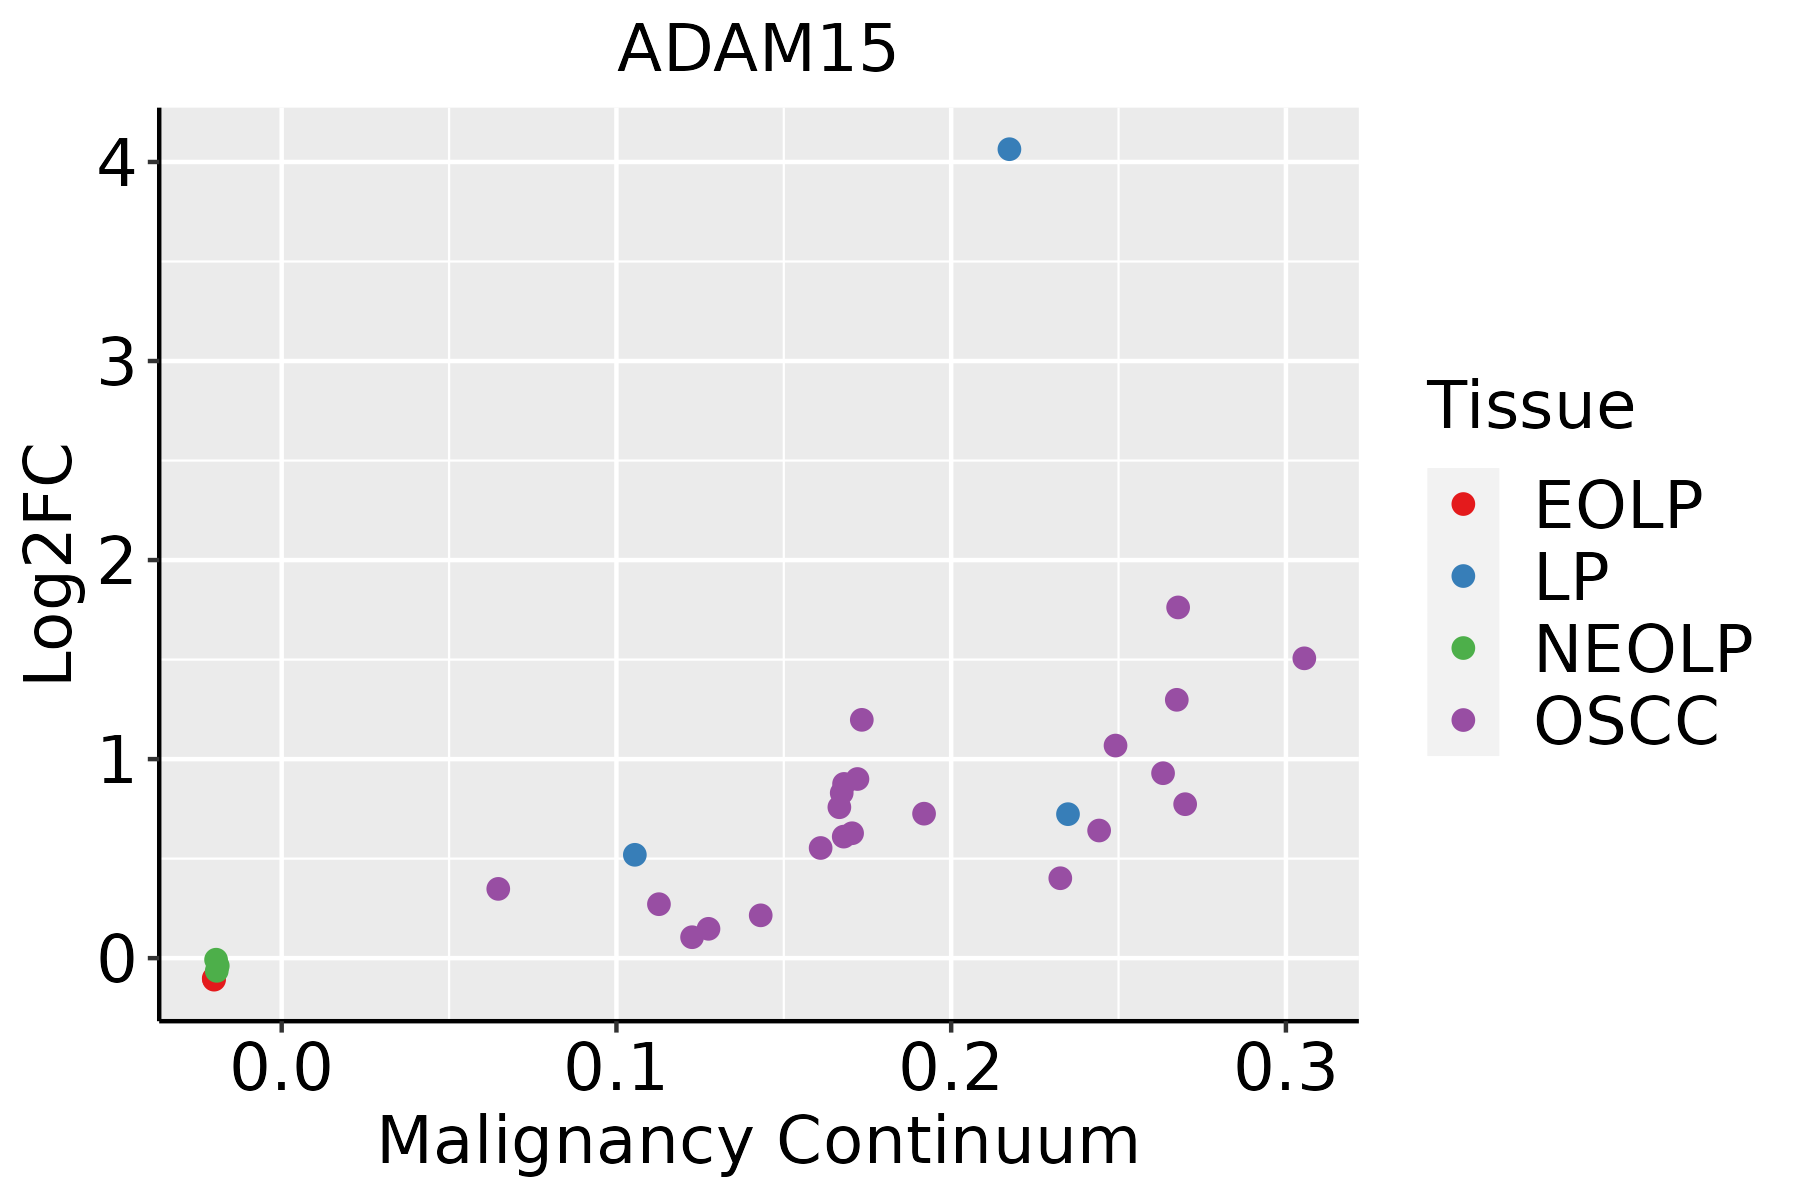 | EOLP: Erosive Oral lichen planus |
| LP: leukoplakia | ||
| NEOLP: Non-erosive oral lichen planus | ||
| OSCC: Oral squamous cell carcinoma | ||
| Skin |  | AK: Actinic keratosis |
| cSCC: Cutaneous squamous cell carcinoma | ||
| SCCIS:squamous cell carcinoma in situ | ||
| Thyroid |  | ATC: Anaplastic thyroid cancer |
| HT: Hashimoto's thyroiditis | ||
| PTC: Papillary thyroid cancer |
| ∗log2FC in expression of this searched gene in stem-like cells from each diseased tissue sample relative to stem-like cells in normal samples in each tissue plotted against the malignancy continuum. Samples are colored based on if they are from different disease stage. |
Top |
Malignant transformation related pathway analysis |
| Find out the enriched GO biological processes and KEGG pathways involved in transition from healthy to precancer to cancer |
| Tissue | Disease Stage | Enriched GO biological Processes |
| Colorectum | AD |  |
| Colorectum | SER |  |
| Colorectum | MSS |  |
| Colorectum | MSI-H |  |
| Colorectum | FAP |  |
| ∗Top 15 enriched GO BP terms are showed in the bar plot of each disease state in each tissue. Each row represents a significant GO biological process which is colored according to the -log10(p.adjust). |
| Page: 1 2 3 4 5 6 7 8 9 |
| GO ID | Tissue | Disease Stage | Description | Gene Ratio | Bg Ratio | pvalue | p.adjust | Count |
| GO:002241120 | Esophagus | HGIN | cellular component disassembly | 102/2587 | 443/18723 | 8.31e-08 | 4.33e-06 | 102 |
| GO:007048220 | Esophagus | HGIN | response to oxygen levels | 76/2587 | 347/18723 | 2.36e-05 | 6.25e-04 | 76 |
| GO:190165420 | Esophagus | HGIN | response to ketone | 48/2587 | 194/18723 | 3.17e-05 | 8.12e-04 | 48 |
| GO:005109825 | Esophagus | HGIN | regulation of binding | 78/2587 | 363/18723 | 3.73e-05 | 9.30e-04 | 78 |
| GO:003629320 | Esophagus | HGIN | response to decreased oxygen levels | 70/2587 | 322/18723 | 6.23e-05 | 1.44e-03 | 70 |
| GO:000166620 | Esophagus | HGIN | response to hypoxia | 67/2587 | 307/18723 | 7.82e-05 | 1.75e-03 | 67 |
| GO:001604919 | Esophagus | HGIN | cell growth | 93/2587 | 482/18723 | 4.49e-04 | 6.62e-03 | 93 |
| GO:009730520 | Esophagus | HGIN | response to alcohol | 54/2587 | 253/18723 | 6.46e-04 | 8.87e-03 | 54 |
| GO:003209110 | Esophagus | HGIN | negative regulation of protein binding | 23/2587 | 94/18723 | 3.92e-03 | 3.54e-02 | 23 |
| GO:005110020 | Esophagus | HGIN | negative regulation of binding | 35/2587 | 162/18723 | 4.32e-03 | 3.84e-02 | 35 |
| GO:000155818 | Esophagus | HGIN | regulation of cell growth | 76/2587 | 414/18723 | 5.40e-03 | 4.42e-02 | 76 |
| GO:006145819 | Esophagus | HGIN | reproductive system development | 78/2587 | 427/18723 | 5.53e-03 | 4.52e-02 | 78 |
| GO:0022411111 | Esophagus | ESCC | cellular component disassembly | 305/8552 | 443/18723 | 1.94e-23 | 4.57e-21 | 305 |
| GO:0051098111 | Esophagus | ESCC | regulation of binding | 251/8552 | 363/18723 | 6.73e-20 | 8.46e-18 | 251 |
| GO:004339320 | Esophagus | ESCC | regulation of protein binding | 135/8552 | 196/18723 | 3.69e-11 | 1.22e-09 | 135 |
| GO:0070482111 | Esophagus | ESCC | response to oxygen levels | 218/8552 | 347/18723 | 6.91e-11 | 2.17e-09 | 218 |
| GO:0016049110 | Esophagus | ESCC | cell growth | 289/8552 | 482/18723 | 1.29e-10 | 3.77e-09 | 289 |
| GO:0036293111 | Esophagus | ESCC | response to decreased oxygen levels | 201/8552 | 322/18723 | 8.37e-10 | 2.04e-08 | 201 |
| GO:0001666111 | Esophagus | ESCC | response to hypoxia | 192/8552 | 307/18723 | 1.59e-09 | 3.69e-08 | 192 |
| GO:000155819 | Esophagus | ESCC | regulation of cell growth | 248/8552 | 414/18723 | 2.97e-09 | 6.45e-08 | 248 |
| Page: 1 2 3 4 5 6 7 8 9 10 11 |
| Pathway ID | Tissue | Disease Stage | Description | Gene Ratio | Bg Ratio | pvalue | p.adjust | qvalue | Count |
| Page: 1 |
Top |
Cell-cell communication analysis |
| Identification of potential cell-cell interactions between two cell types and their ligand-receptor pairs for different disease states |
| Ligand | Receptor | LRpair | Pathway | Tissue | Disease Stage |
| Page: 1 |
Top |
Single-cell gene regulatory network inference analysis |
| Find out the significant the regulons (TFs) and the target genes of each regulon across cell types for different disease states |
| TF | Cell Type | Tissue | Disease Stage | Target Gene | RSS | Regulon Activity |
| ∗The dot plots of a searched regulon are shown for all cell subpopulations in each disease state of each tissue based on the regulon specific score inferred using pySCENIC and by calculating the average expression. |
| Page: 1 |
Top |
Somatic mutation of malignant transformation related genes |
| Annotation of somatic variants for genes involved in malignant transformation |
| Hugo Symbol | Variant Class | Variant Classification | dbSNP RS | HGVSc | HGVSp | HGVSp Short | SWISSPROT | BIOTYPE | SIFT | PolyPhen | Tumor Sample Barcode | Tissue | Histology | Sex | Age | Stage | Therapy Types | Drugs | Outcome |
| ADAM15 | SNV | Missense_Mutation | novel | c.481N>A | p.Gln161Lys | p.Q161K | Q13444 | protein_coding | tolerated(0.2) | benign(0.282) | TCGA-A2-A04V-01 | Breast | breast invasive carcinoma | Female | <65 | I/II | Chemotherapy | cytoxan | PD |
| ADAM15 | SNV | Missense_Mutation | novel | c.743N>T | p.Thr248Ile | p.T248I | Q13444 | protein_coding | tolerated(0.11) | benign(0.41) | TCGA-A2-A3Y0-01 | Breast | breast invasive carcinoma | Female | <65 | I/II | Chemotherapy | adriamycin | CR |
| ADAM15 | SNV | Missense_Mutation | novel | c.1792N>G | p.Leu598Val | p.L598V | Q13444 | protein_coding | tolerated(0.31) | possibly_damaging(0.506) | TCGA-AR-A2LE-01 | Breast | breast invasive carcinoma | Female | >=65 | I/II | Hormone Therapy | tamoxiphen | PD |
| ADAM15 | SNV | Missense_Mutation | c.1057A>C | p.Ser353Arg | p.S353R | Q13444 | protein_coding | deleterious(0) | probably_damaging(0.992) | TCGA-BH-A0BZ-01 | Breast | breast invasive carcinoma | Female | <65 | III/IV | Chemotherapy | doxorubicin | CR | |
| ADAM15 | SNV | Missense_Mutation | c.2134N>A | p.Gly712Ser | p.G712S | Q13444 | protein_coding | deleterious(0.04) | probably_damaging(0.999) | TCGA-BH-A0HF-01 | Breast | breast invasive carcinoma | Female | >=65 | I/II | Hormone Therapy | arimidex | SD | |
| ADAM15 | SNV | Missense_Mutation | novel | c.213N>G | p.Ile71Met | p.I71M | Q13444 | protein_coding | tolerated(0.09) | probably_damaging(0.949) | TCGA-BH-A5IZ-01 | Breast | breast invasive carcinoma | Female | <65 | I/II | Chemotherapy | adriamycin | CR |
| ADAM15 | insertion | Frame_Shift_Ins | novel | c.479_480insCATAACAGCCCTA | p.Gln161IlefsTer66 | p.Q161Ifs*66 | Q13444 | protein_coding | TCGA-A2-A04V-01 | Breast | breast invasive carcinoma | Female | <65 | I/II | Chemotherapy | cytoxan | PD | ||
| ADAM15 | insertion | Nonsense_Mutation | novel | c.686_687insGTGGCATGATCTCGGCTCACTGCAAGCTCCGCCT | p.Tyr229Ter | p.Y229* | Q13444 | protein_coding | TCGA-A2-A0ER-01 | Breast | breast invasive carcinoma | Female | <65 | I/II | Chemotherapy | cytoxan | SD | ||
| ADAM15 | deletion | In_Frame_Del | novel | c.1223_1225delNNN | p.Cys409del | p.C409del | Q13444 | protein_coding | TCGA-B6-A0RE-01 | Breast | breast invasive carcinoma | Female | <65 | I/II | Unknown | Unknown | SD | ||
| ADAM15 | deletion | Frame_Shift_Del | novel | c.505delA | p.Ile169SerfsTer13 | p.I169Sfs*13 | Q13444 | protein_coding | TCGA-D8-A27V-01 | Breast | breast invasive carcinoma | Female | <65 | I/II | Hormone Therapy | tamoxiphen | SD |
| Page: 1 2 3 4 5 6 7 |
Top |
Related drugs of malignant transformation related genes |
| Identification of chemicals and drugs interact with genes involved in malignant transfromation |
| (DGIdb 4.0) |
| Entrez ID | Symbol | Category | Interaction Types | Drug Claim Name | Drug Name | PMIDs |
| Page: 1 |

Copyright 2023-Present -The University of Texas Health Science Center at Houston |