
|
|||||
|
 | |
| |
| |
| |
| |
| |
|
Gene: ADAM12 |
Gene summary for ADAM12 |
| Gene information | Species | Human | Gene symbol | ADAM12 | Gene ID | 8038 |
| Gene name | ADAM metallopeptidase domain 12 | |
| Gene Alias | ADAM12-OT1 | |
| Cytomap | 10q26.2 | |
| Gene Type | protein-coding | GO ID | GO:0000768 | UniProtAcc | U5NE98 |
Top |
Malignant transformation analysis |
| Identification of the aberrant gene expression in precancerous and cancerous lesions by comparing the gene expression of stem-like cells in diseased tissues with normal stem cells |
| Entrez ID | Symbol | Replicates | Species | Organ | Tissue | Adj P-value | Log2FC | Malignancy |
| 8038 | ADAM12 | PTC06 | Human | Thyroid | PTC | 1.21e-02 | 1.08e-01 | 0.2057 |
| 8038 | ADAM12 | PTC07 | Human | Thyroid | PTC | 2.29e-02 | 6.69e-02 | 0.2044 |
| 8038 | ADAM12 | ATC11 | Human | Thyroid | ATC | 7.49e-03 | 4.71e-01 | 0.3386 |
| 8038 | ADAM12 | ATC12 | Human | Thyroid | ATC | 3.80e-36 | 7.43e-01 | 0.34 |
| 8038 | ADAM12 | ATC13 | Human | Thyroid | ATC | 7.40e-31 | 6.66e-01 | 0.34 |
| 8038 | ADAM12 | ATC2 | Human | Thyroid | ATC | 4.44e-15 | 1.27e+00 | 0.34 |
| 8038 | ADAM12 | ATC3 | Human | Thyroid | ATC | 5.97e-08 | 5.39e-01 | 0.338 |
| 8038 | ADAM12 | ATC4 | Human | Thyroid | ATC | 6.18e-45 | 9.12e-01 | 0.34 |
| 8038 | ADAM12 | ATC5 | Human | Thyroid | ATC | 6.03e-40 | 7.33e-01 | 0.34 |
| Page: 1 |
| Tissue | Expression Dynamics | Abbreviation |
| Thyroid | 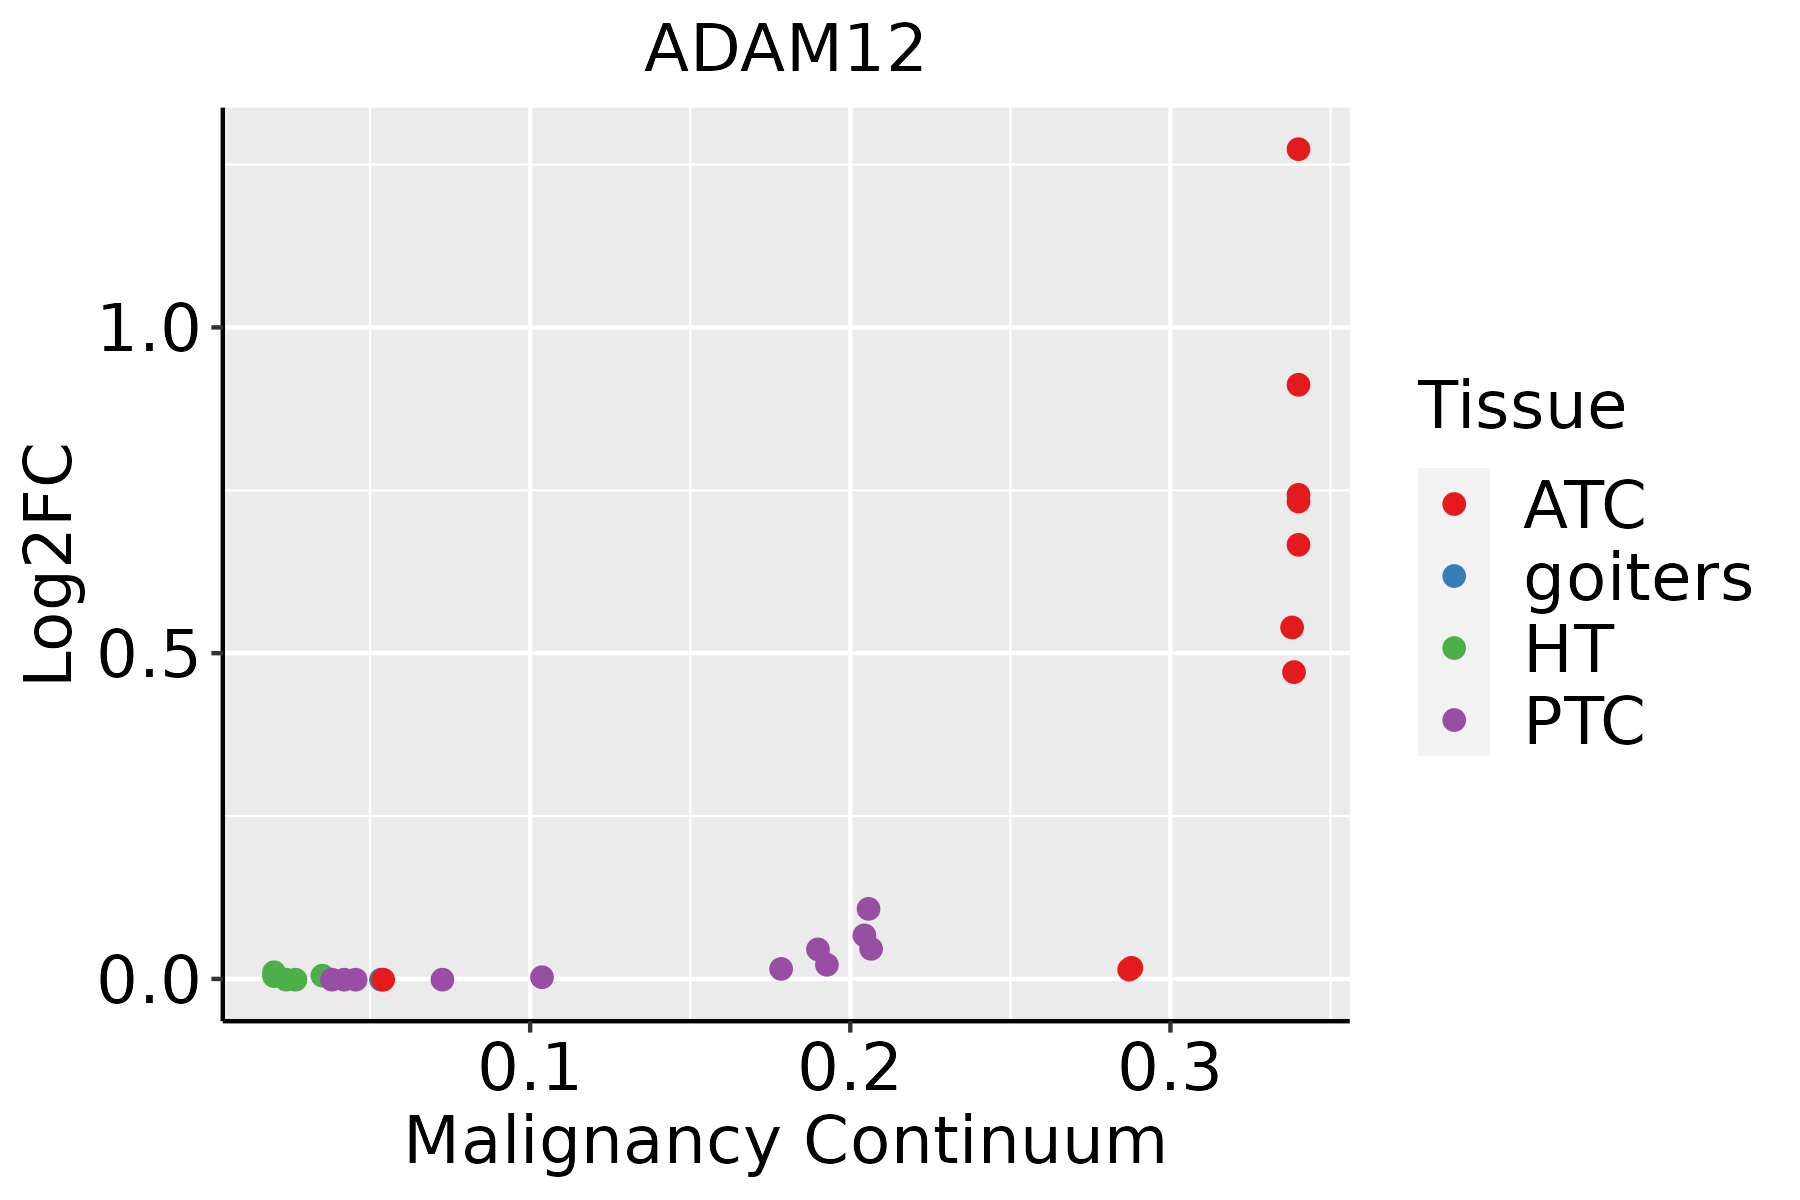 | ATC: Anaplastic thyroid cancer |
| HT: Hashimoto's thyroiditis | ||
| PTC: Papillary thyroid cancer |
| ∗log2FC in expression of this searched gene in stem-like cells from each diseased tissue sample relative to stem-like cells in normal samples in each tissue plotted against the malignancy continuum. Samples are colored based on if they are from different disease stage. |
Top |
Malignant transformation related pathway analysis |
| Find out the enriched GO biological processes and KEGG pathways involved in transition from healthy to precancer to cancer |
| Tissue | Disease Stage | Enriched GO biological Processes |
| Colorectum | AD |  |
| Colorectum | SER |  |
| Colorectum | MSS |  |
| Colorectum | MSI-H |  |
| Colorectum | FAP |  |
| ∗Top 15 enriched GO BP terms are showed in the bar plot of each disease state in each tissue. Each row represents a significant GO biological process which is colored according to the -log10(p.adjust). |
| Page: 1 2 3 4 5 6 7 8 9 |
| GO ID | Tissue | Disease Stage | Description | Gene Ratio | Bg Ratio | pvalue | p.adjust | Count |
| GO:004576612 | Thyroid | PTC | positive regulation of angiogenesis | 75/5968 | 181/18723 | 4.09e-03 | 1.95e-02 | 75 |
| GO:190401812 | Thyroid | PTC | positive regulation of vasculature development | 75/5968 | 181/18723 | 4.09e-03 | 1.95e-02 | 75 |
| GO:004269216 | Thyroid | ATC | muscle cell differentiation | 165/6293 | 384/18723 | 7.17e-05 | 5.46e-04 | 165 |
| GO:004576621 | Thyroid | ATC | positive regulation of angiogenesis | 82/6293 | 181/18723 | 6.79e-04 | 3.83e-03 | 82 |
| GO:190401821 | Thyroid | ATC | positive regulation of vasculature development | 82/6293 | 181/18723 | 6.79e-04 | 3.83e-03 | 82 |
| GO:005114617 | Thyroid | ATC | striated muscle cell differentiation | 119/6293 | 283/18723 | 1.74e-03 | 8.70e-03 | 119 |
| GO:00457657 | Thyroid | ATC | regulation of angiogenesis | 141/6293 | 342/18723 | 1.80e-03 | 8.85e-03 | 141 |
| GO:19013427 | Thyroid | ATC | regulation of vasculature development | 143/6293 | 348/18723 | 1.95e-03 | 9.44e-03 | 143 |
| Page: 1 |
| Pathway ID | Tissue | Disease Stage | Description | Gene Ratio | Bg Ratio | pvalue | p.adjust | qvalue | Count |
| Page: 1 |
Top |
Cell-cell communication analysis |
| Identification of potential cell-cell interactions between two cell types and their ligand-receptor pairs for different disease states |
| Ligand | Receptor | LRpair | Pathway | Tissue | Disease Stage |
| Page: 1 |
Top |
Single-cell gene regulatory network inference analysis |
| Find out the significant the regulons (TFs) and the target genes of each regulon across cell types for different disease states |
| TF | Cell Type | Tissue | Disease Stage | Target Gene | RSS | Regulon Activity |
| ∗The dot plots of a searched regulon are shown for all cell subpopulations in each disease state of each tissue based on the regulon specific score inferred using pySCENIC and by calculating the average expression. |
| Page: 1 |
Top |
Somatic mutation of malignant transformation related genes |
| Annotation of somatic variants for genes involved in malignant transformation |
| Hugo Symbol | Variant Class | Variant Classification | dbSNP RS | HGVSc | HGVSp | HGVSp Short | SWISSPROT | BIOTYPE | SIFT | PolyPhen | Tumor Sample Barcode | Tissue | Histology | Sex | Age | Stage | Therapy Types | Drugs | Outcome |
| ADAM12 | SNV | Missense_Mutation | c.697G>C | p.Asp233His | p.D233H | O43184 | protein_coding | deleterious(0.01) | probably_damaging(1) | TCGA-AC-A23H-01 | Breast | breast invasive carcinoma | Female | >=65 | I/II | Unknown | Unknown | PD | |
| ADAM12 | SNV | Missense_Mutation | c.676G>C | p.Glu226Gln | p.E226Q | O43184 | protein_coding | deleterious(0.05) | probably_damaging(0.936) | TCGA-AC-A23H-01 | Breast | breast invasive carcinoma | Female | >=65 | I/II | Unknown | Unknown | PD | |
| ADAM12 | SNV | Missense_Mutation | rs200657108 | c.674G>A | p.Arg225Gln | p.R225Q | O43184 | protein_coding | tolerated(0.16) | probably_damaging(0.996) | TCGA-AC-A23H-01 | Breast | breast invasive carcinoma | Female | >=65 | I/II | Unknown | Unknown | PD |
| ADAM12 | SNV | Missense_Mutation | c.608G>T | p.Arg203Ile | p.R203I | O43184 | protein_coding | tolerated(0.07) | benign(0.007) | TCGA-AC-A3W6-01 | Breast | breast invasive carcinoma | Female | >=65 | III/IV | Unknown | Unknown | SD | |
| ADAM12 | SNV | Missense_Mutation | novel | c.110N>A | p.Gly37Glu | p.G37E | O43184 | protein_coding | tolerated_low_confidence(0.24) | benign(0) | TCGA-BH-A0DE-01 | Breast | breast invasive carcinoma | Female | <65 | I/II | Unknown | Unknown | SD |
| ADAM12 | SNV | Missense_Mutation | rs745765822 | c.329N>A | p.Arg110Gln | p.R110Q | O43184 | protein_coding | tolerated(0.31) | benign(0.053) | TCGA-BH-A0H7-01 | Breast | breast invasive carcinoma | Female | >=65 | III/IV | Chemotherapy | doxorubicin | SD |
| ADAM12 | SNV | Missense_Mutation | c.860N>C | p.Leu287Pro | p.L287P | O43184 | protein_coding | deleterious(0) | probably_damaging(1) | TCGA-BH-A1FN-01 | Breast | breast invasive carcinoma | Female | <65 | I/II | Unknown | Unknown | PD | |
| ADAM12 | SNV | Missense_Mutation | c.2328N>A | p.Met776Ile | p.M776I | O43184 | protein_coding | tolerated(0.44) | benign(0) | TCGA-C8-A275-01 | Breast | breast invasive carcinoma | Female | <65 | I/II | Unknown | Unknown | SD | |
| ADAM12 | SNV | Missense_Mutation | rs767462610 | c.2003N>A | p.Gly668Glu | p.G668E | O43184 | protein_coding | deleterious(0) | probably_damaging(1) | TCGA-D8-A1XG-01 | Breast | breast invasive carcinoma | Female | >=65 | III/IV | Unknown | Unknown | SD |
| ADAM12 | SNV | Missense_Mutation | novel | c.263N>A | p.Gly88Asp | p.G88D | O43184 | protein_coding | tolerated(0.17) | probably_damaging(0.99) | TCGA-OL-A66P-01 | Breast | breast invasive carcinoma | Female | >=65 | I/II | Chemotherapy | cytoxan | CR |
| Page: 1 2 3 4 5 6 7 8 9 10 11 |
Top |
Related drugs of malignant transformation related genes |
| Identification of chemicals and drugs interact with genes involved in malignant transfromation |
| (DGIdb 4.0) |
| Entrez ID | Symbol | Category | Interaction Types | Drug Claim Name | Drug Name | PMIDs |
| 8038 | ADAM12 | NEUTRAL ZINC METALLOPEPTIDASE, PROTEASE, DRUGGABLE GENOME, ENZYME | inhibitor | 178103981 | ILOMASTAT |
| Page: 1 |

Copyright 2023-Present -The University of Texas Health Science Center at Houston |