
|
|||||
|
 | |
| |
| |
| |
| |
| |
|
Gene: ADAM10 |
Gene summary for ADAM10 |
| Gene information | Species | Human | Gene symbol | ADAM10 | Gene ID | 102 |
| Gene name | ADAM metallopeptidase domain 10 | |
| Gene Alias | AD10 | |
| Cytomap | 15q21.3 | |
| Gene Type | protein-coding | GO ID | GO:0000003 | UniProtAcc | A0A024R5U5 |
Top |
Malignant transformation analysis |
| Identification of the aberrant gene expression in precancerous and cancerous lesions by comparing the gene expression of stem-like cells in diseased tissues with normal stem cells |
| Entrez ID | Symbol | Replicates | Species | Organ | Tissue | Adj P-value | Log2FC | Malignancy |
| 102 | ADAM10 | HTA11_3410_2000001011 | Human | Colorectum | AD | 1.03e-14 | -5.32e-01 | 0.0155 |
| 102 | ADAM10 | HTA11_3361_2000001011 | Human | Colorectum | AD | 1.21e-06 | -5.43e-01 | -0.1207 |
| 102 | ADAM10 | HTA11_546_2000001011 | Human | Colorectum | AD | 8.68e-05 | -4.60e-01 | -0.0842 |
| 102 | ADAM10 | HTA11_866_3004761011 | Human | Colorectum | AD | 1.32e-07 | -4.23e-01 | 0.096 |
| 102 | ADAM10 | HTA11_8622_2000001021 | Human | Colorectum | SER | 2.39e-02 | -4.91e-01 | 0.0528 |
| 102 | ADAM10 | HTA11_10623_2000001011 | Human | Colorectum | AD | 4.85e-03 | -4.43e-01 | -0.0177 |
| 102 | ADAM10 | HTA11_10711_2000001011 | Human | Colorectum | AD | 6.20e-05 | -3.99e-01 | 0.0338 |
| 102 | ADAM10 | HTA11_7696_3000711011 | Human | Colorectum | AD | 1.27e-11 | -4.83e-01 | 0.0674 |
| 102 | ADAM10 | HTA11_6818_2000001021 | Human | Colorectum | AD | 7.92e-04 | -4.24e-01 | 0.0588 |
| 102 | ADAM10 | HTA11_99999970781_79442 | Human | Colorectum | MSS | 9.31e-07 | -3.72e-01 | 0.294 |
| 102 | ADAM10 | HTA11_99999971662_82457 | Human | Colorectum | MSS | 5.17e-10 | -4.85e-01 | 0.3859 |
| 102 | ADAM10 | HTA11_99999973899_84307 | Human | Colorectum | MSS | 2.34e-03 | -5.24e-01 | 0.2585 |
| 102 | ADAM10 | HTA11_99999974143_84620 | Human | Colorectum | MSS | 2.11e-06 | -4.49e-01 | 0.3005 |
| 102 | ADAM10 | A001-C-207 | Human | Colorectum | FAP | 8.24e-04 | -1.67e-01 | 0.1278 |
| 102 | ADAM10 | A015-C-203 | Human | Colorectum | FAP | 1.86e-24 | -2.98e-01 | -0.1294 |
| 102 | ADAM10 | A015-C-204 | Human | Colorectum | FAP | 1.00e-05 | -2.00e-01 | -0.0228 |
| 102 | ADAM10 | A014-C-040 | Human | Colorectum | FAP | 4.12e-03 | -1.66e-01 | -0.1184 |
| 102 | ADAM10 | A002-C-201 | Human | Colorectum | FAP | 6.65e-14 | -1.81e-01 | 0.0324 |
| 102 | ADAM10 | A002-C-203 | Human | Colorectum | FAP | 3.01e-05 | -1.33e-01 | 0.2786 |
| 102 | ADAM10 | A001-C-119 | Human | Colorectum | FAP | 8.50e-06 | -1.14e-01 | -0.1557 |
| Page: 1 2 3 4 5 6 7 8 9 |
| Tissue | Expression Dynamics | Abbreviation |
| Colorectum (GSE201348) | 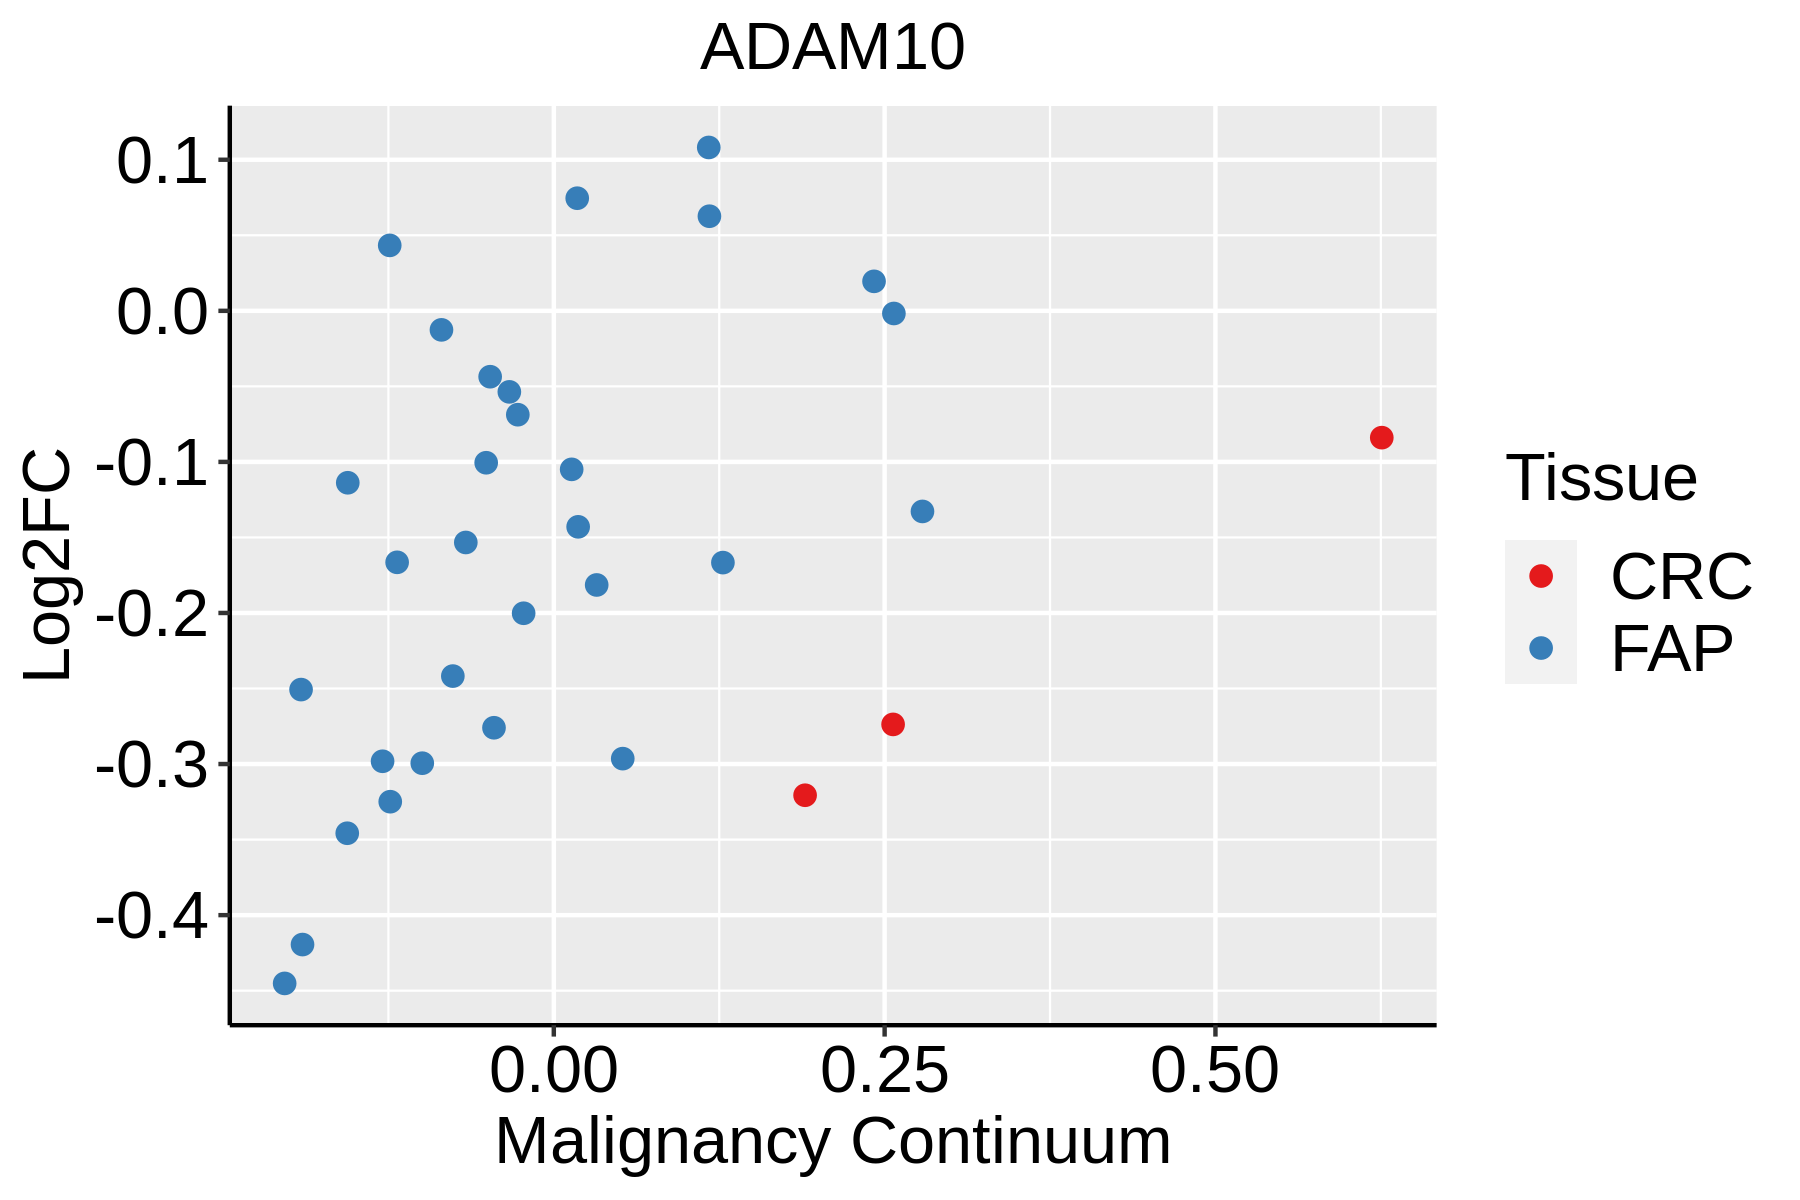 | FAP: Familial adenomatous polyposis |
| CRC: Colorectal cancer | ||
| Colorectum (HTA11) |  | AD: Adenomas |
| SER: Sessile serrated lesions | ||
| MSI-H: Microsatellite-high colorectal cancer | ||
| MSS: Microsatellite stable colorectal cancer | ||
| Esophagus |  | ESCC: Esophageal squamous cell carcinoma |
| HGIN: High-grade intraepithelial neoplasias | ||
| LGIN: Low-grade intraepithelial neoplasias | ||
| Liver |  | HCC: Hepatocellular carcinoma |
| NAFLD: Non-alcoholic fatty liver disease | ||
| Oral Cavity | 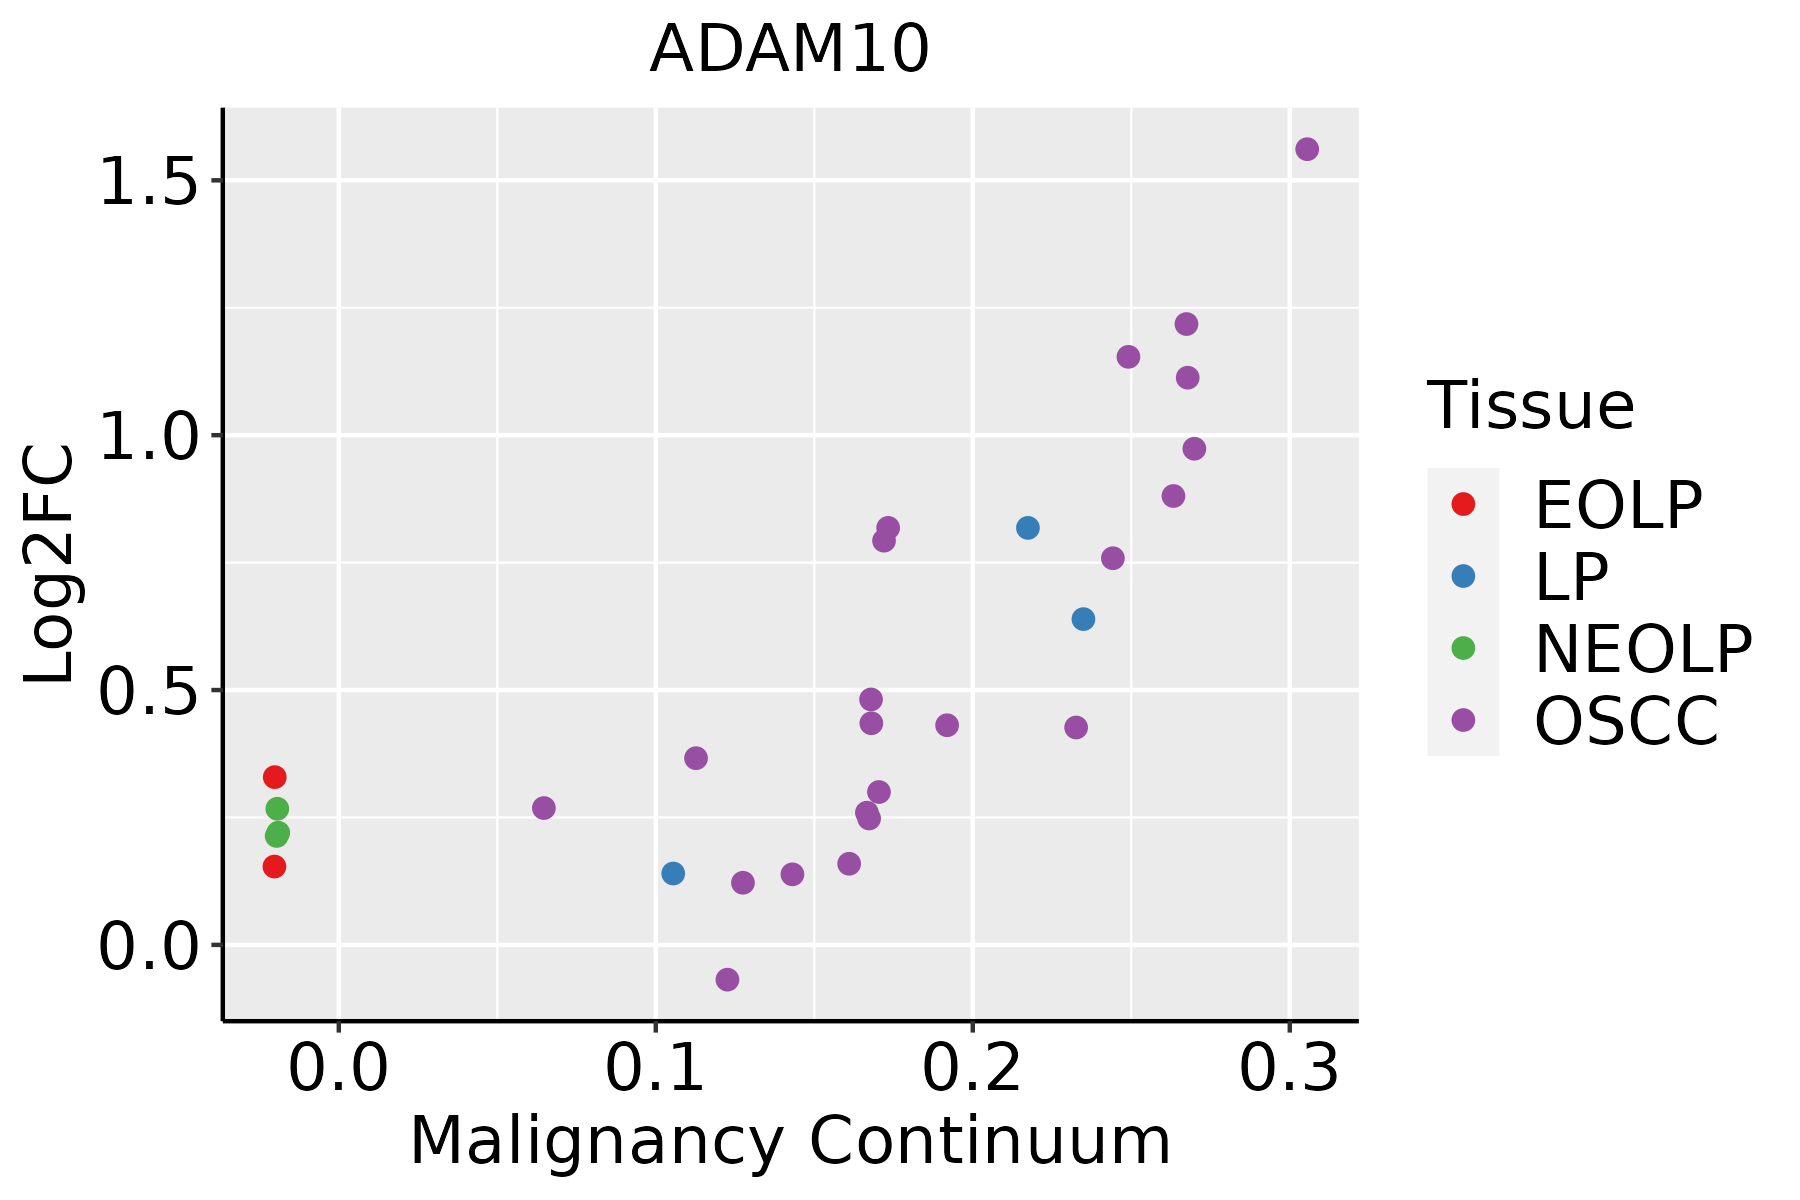 | EOLP: Erosive Oral lichen planus |
| LP: leukoplakia | ||
| NEOLP: Non-erosive oral lichen planus | ||
| OSCC: Oral squamous cell carcinoma | ||
| Prostate | 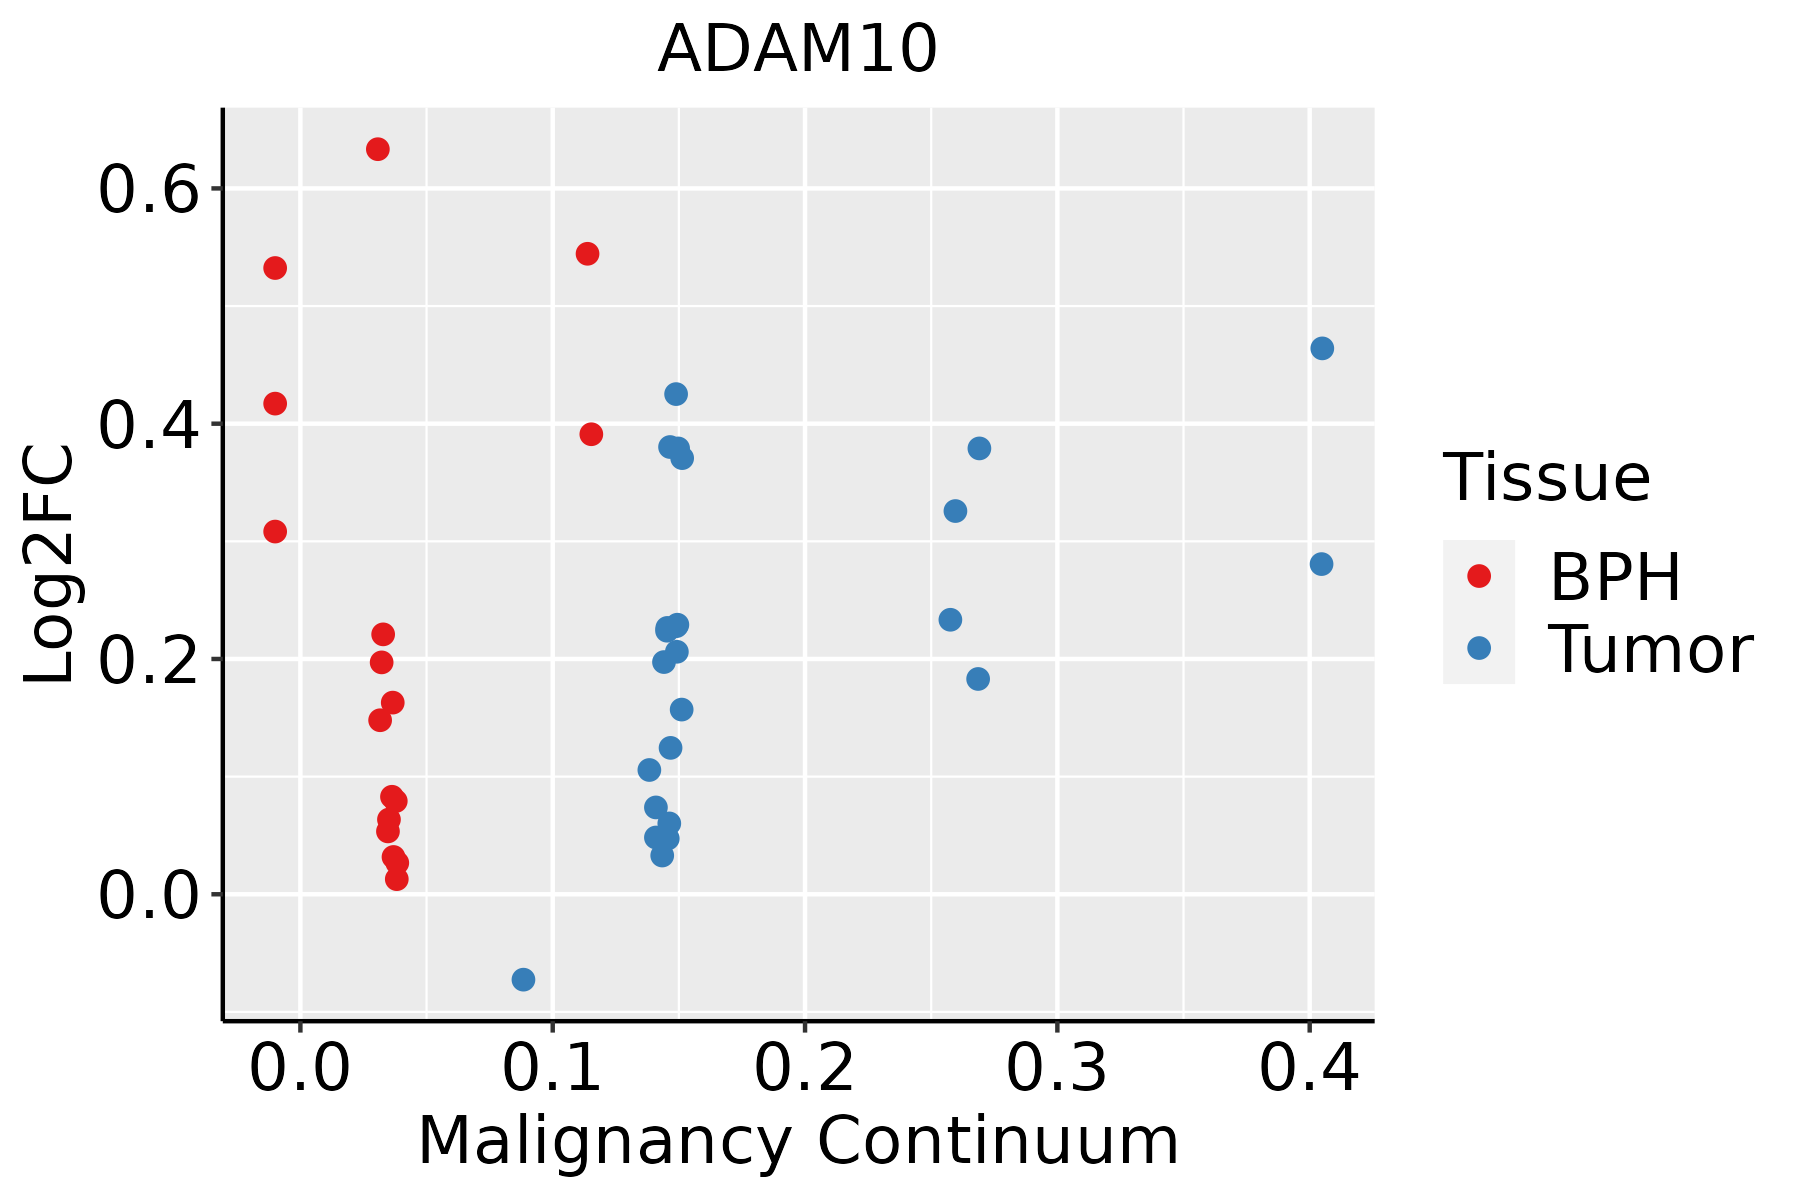 | BPH: Benign Prostatic Hyperplasia |
| Skin | 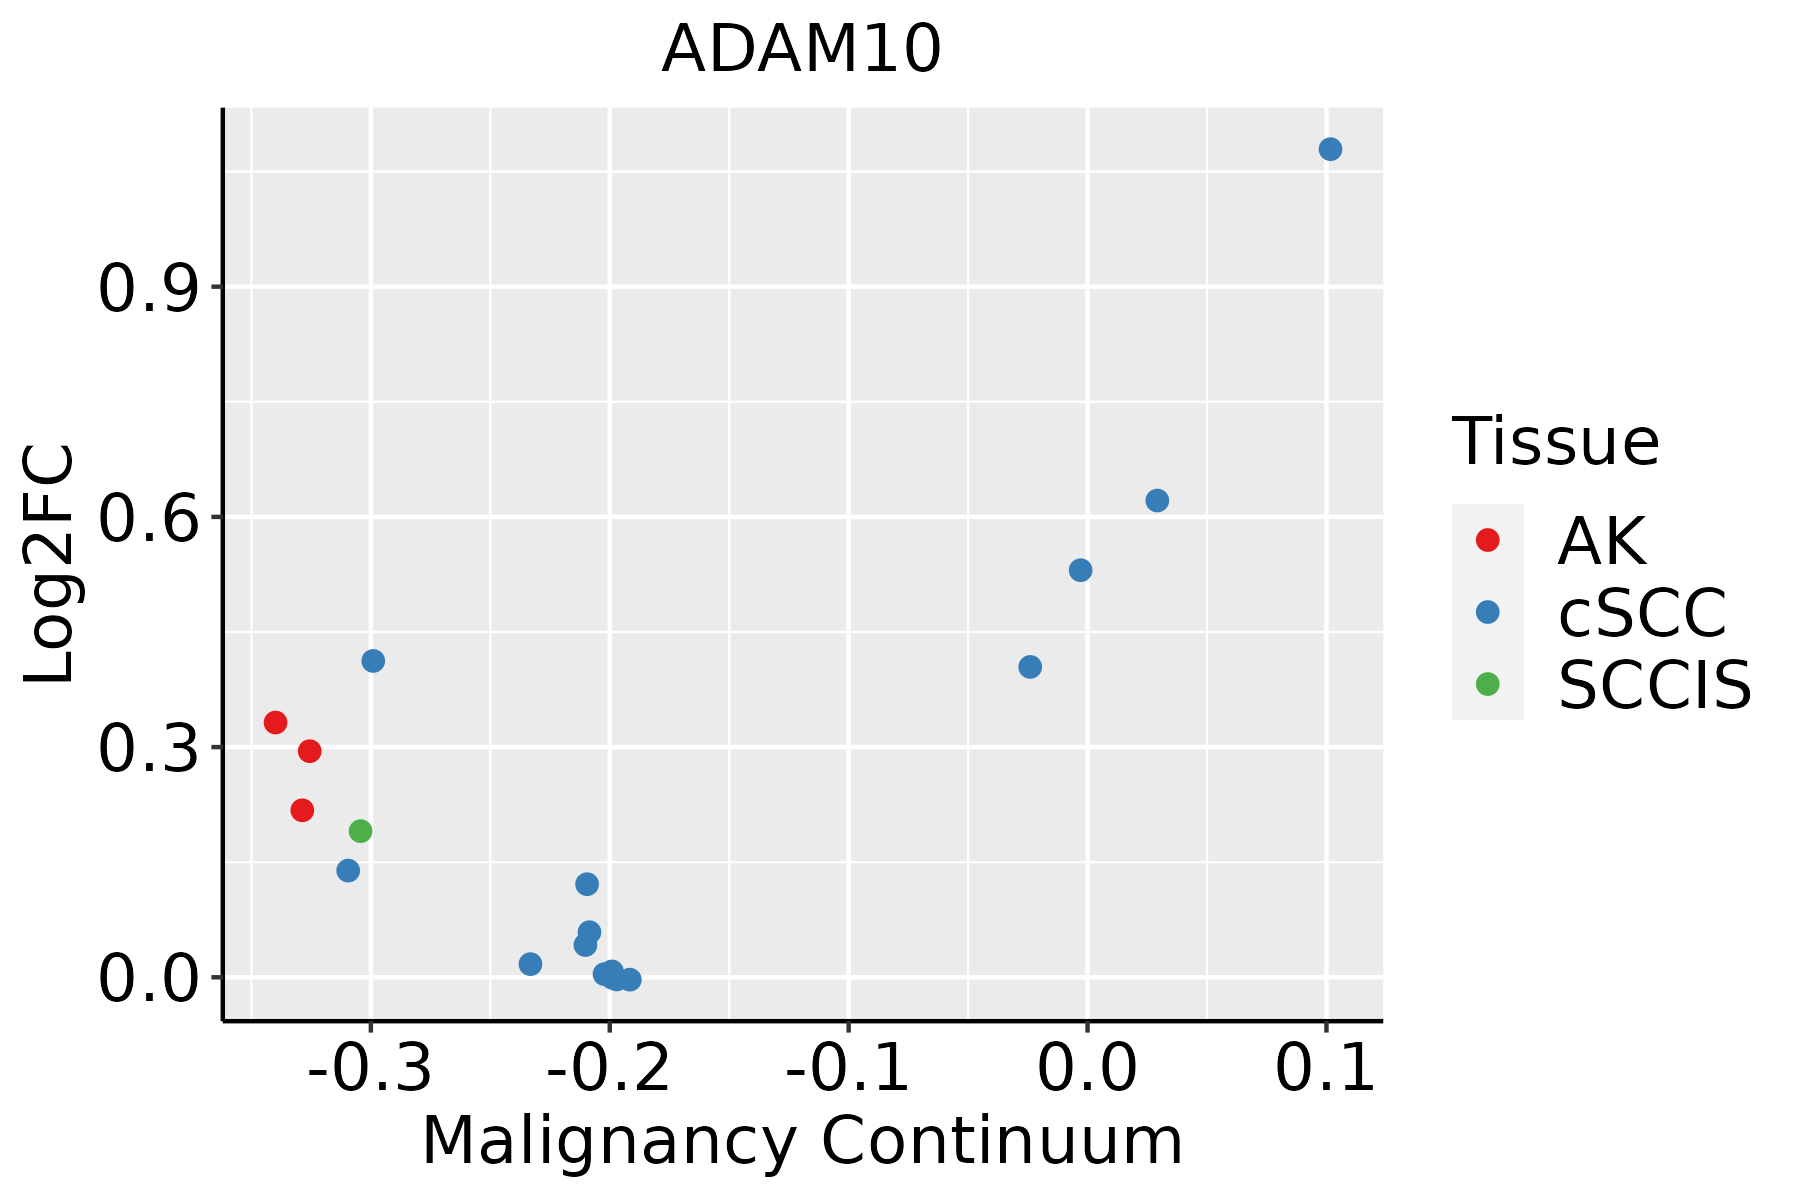 | AK: Actinic keratosis |
| cSCC: Cutaneous squamous cell carcinoma | ||
| SCCIS:squamous cell carcinoma in situ | ||
| Thyroid | 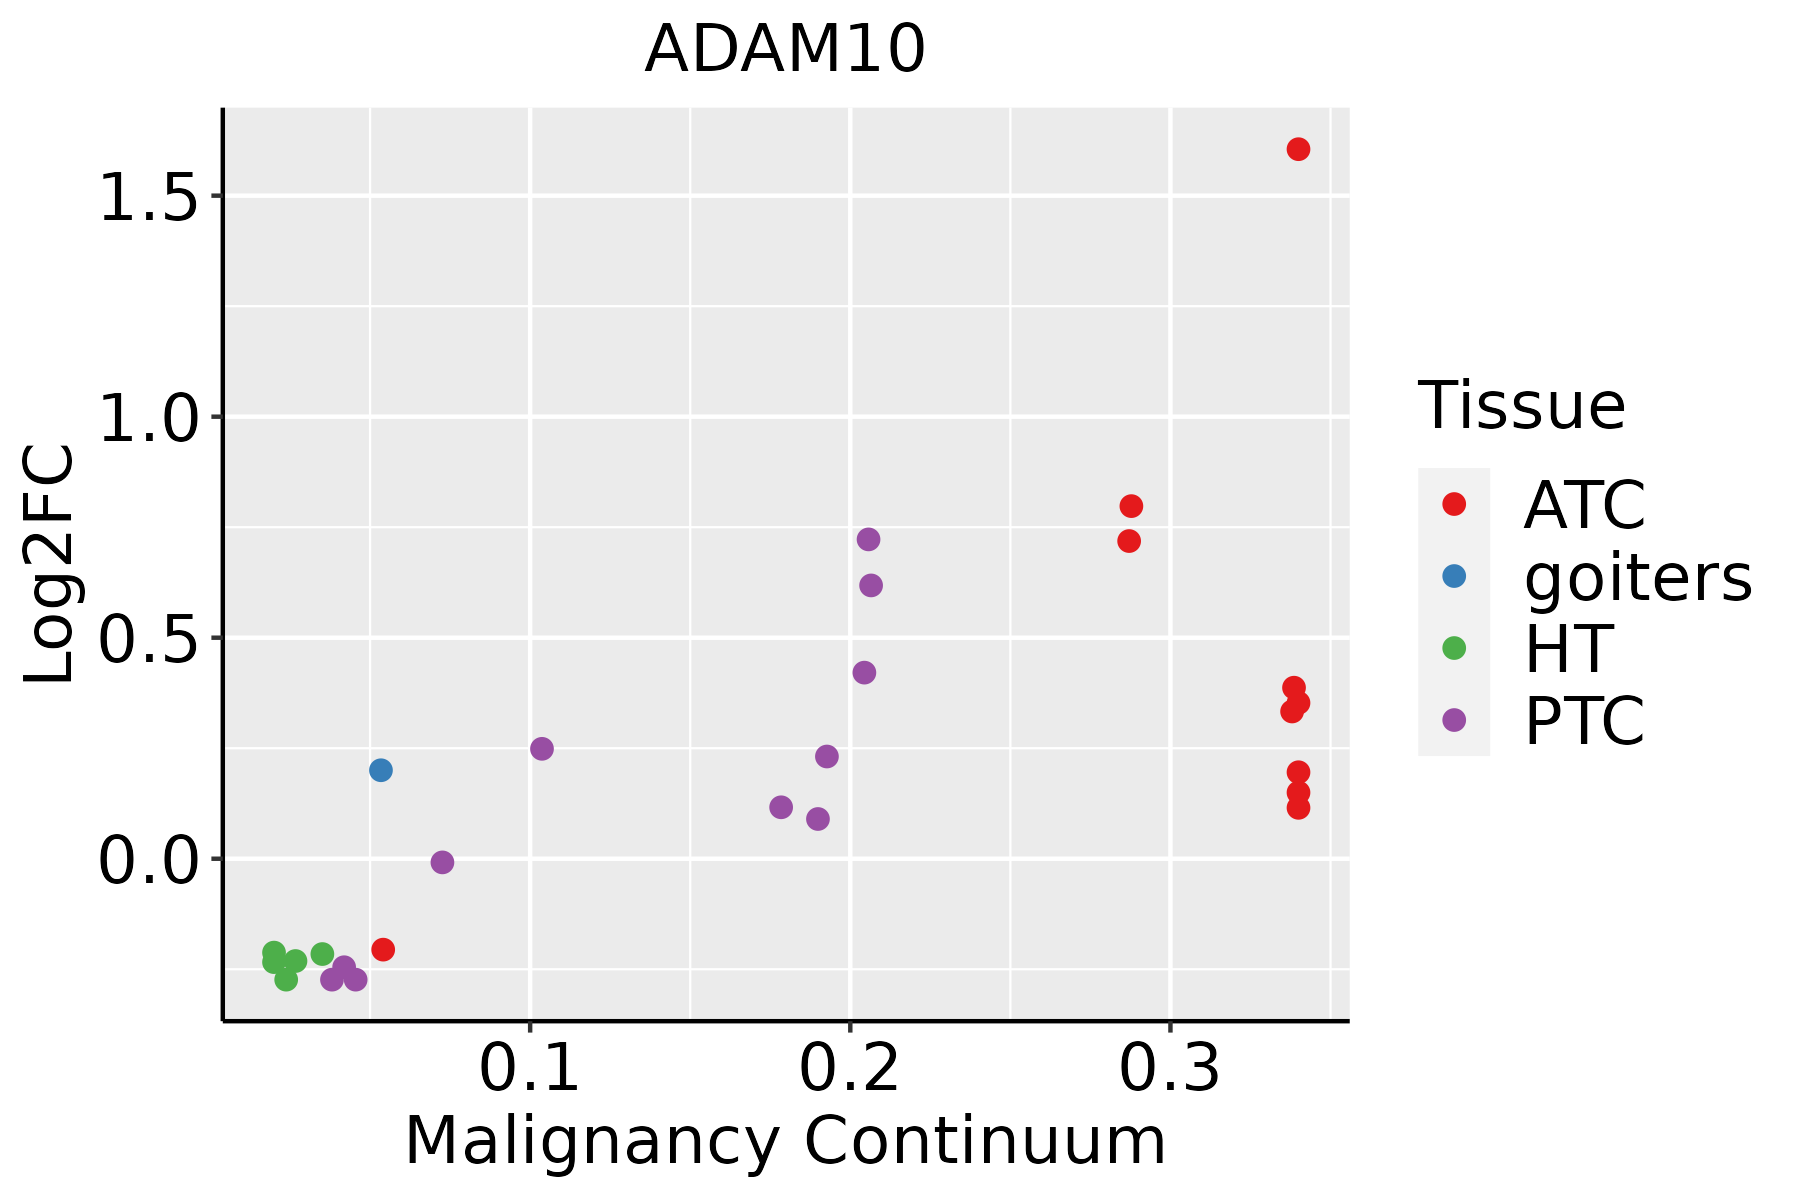 | ATC: Anaplastic thyroid cancer |
| HT: Hashimoto's thyroiditis | ||
| PTC: Papillary thyroid cancer |
| ∗log2FC in expression of this searched gene in stem-like cells from each diseased tissue sample relative to stem-like cells in normal samples in each tissue plotted against the malignancy continuum. Samples are colored based on if they are from different disease stage. |
Top |
Malignant transformation related pathway analysis |
| Find out the enriched GO biological processes and KEGG pathways involved in transition from healthy to precancer to cancer |
| Tissue | Disease Stage | Enriched GO biological Processes |
| Colorectum | AD |  |
| Colorectum | SER |  |
| Colorectum | MSS |  |
| Colorectum | MSI-H |  |
| Colorectum | FAP |  |
| ∗Top 15 enriched GO BP terms are showed in the bar plot of each disease state in each tissue. Each row represents a significant GO biological process which is colored according to the -log10(p.adjust). |
| Page: 1 2 3 4 5 6 7 8 9 |
| GO ID | Tissue | Disease Stage | Description | Gene Ratio | Bg Ratio | pvalue | p.adjust | Count |
| GO:1990778 | Colorectum | AD | protein localization to cell periphery | 129/3918 | 333/18723 | 5.51e-14 | 1.15e-11 | 129 |
| GO:1905475 | Colorectum | AD | regulation of protein localization to membrane | 73/3918 | 175/18723 | 3.37e-10 | 2.93e-08 | 73 |
| GO:0045216 | Colorectum | AD | cell-cell junction organization | 80/3918 | 200/18723 | 5.57e-10 | 4.58e-08 | 80 |
| GO:0022411 | Colorectum | AD | cellular component disassembly | 147/3918 | 443/18723 | 8.53e-10 | 6.76e-08 | 147 |
| GO:1904375 | Colorectum | AD | regulation of protein localization to cell periphery | 54/3918 | 125/18723 | 1.52e-08 | 9.00e-07 | 54 |
| GO:0016049 | Colorectum | AD | cell growth | 143/3918 | 482/18723 | 2.83e-06 | 8.09e-05 | 143 |
| GO:0001558 | Colorectum | AD | regulation of cell growth | 124/3918 | 414/18723 | 7.67e-06 | 1.86e-04 | 124 |
| GO:0001701 | Colorectum | AD | in utero embryonic development | 110/3918 | 367/18723 | 2.36e-05 | 4.62e-04 | 110 |
| GO:0010975 | Colorectum | AD | regulation of neuron projection development | 129/3918 | 445/18723 | 2.88e-05 | 5.37e-04 | 129 |
| GO:0106027 | Colorectum | AD | neuron projection organization | 36/3918 | 93/18723 | 6.58e-05 | 1.07e-03 | 36 |
| GO:0030307 | Colorectum | AD | positive regulation of cell growth | 54/3918 | 166/18723 | 3.08e-04 | 3.69e-03 | 54 |
| GO:0045927 | Colorectum | AD | positive regulation of growth | 77/3918 | 259/18723 | 4.82e-04 | 5.27e-03 | 77 |
| GO:0097061 | Colorectum | AD | dendritic spine organization | 31/3918 | 84/18723 | 5.48e-04 | 5.83e-03 | 31 |
| GO:0051604 | Colorectum | AD | protein maturation | 85/3918 | 294/18723 | 6.73e-04 | 6.91e-03 | 85 |
| GO:0034332 | Colorectum | AD | adherens junction organization | 20/3918 | 49/18723 | 1.23e-03 | 1.09e-02 | 20 |
| GO:0099173 | Colorectum | AD | postsynapse organization | 51/3918 | 168/18723 | 2.47e-03 | 1.90e-02 | 51 |
| GO:0016358 | Colorectum | AD | dendrite development | 69/3918 | 243/18723 | 3.32e-03 | 2.42e-02 | 69 |
| GO:0033619 | Colorectum | AD | membrane protein proteolysis | 21/3918 | 57/18723 | 4.16e-03 | 2.88e-02 | 21 |
| GO:0050808 | Colorectum | AD | synapse organization | 112/3918 | 426/18723 | 4.25e-03 | 2.92e-02 | 112 |
| GO:1902414 | Colorectum | AD | protein localization to cell junction | 31/3918 | 94/18723 | 4.30e-03 | 2.95e-02 | 31 |
| Page: 1 2 3 4 5 6 7 8 9 10 11 12 13 14 15 16 17 18 19 20 21 22 23 24 25 26 27 28 29 30 31 |
| Pathway ID | Tissue | Disease Stage | Description | Gene Ratio | Bg Ratio | pvalue | p.adjust | qvalue | Count |
| hsa050102 | Colorectum | SER | Alzheimer disease | 146/1580 | 384/8465 | 6.52e-20 | 2.40e-18 | 1.75e-18 | 146 |
| hsa050103 | Colorectum | SER | Alzheimer disease | 146/1580 | 384/8465 | 6.52e-20 | 2.40e-18 | 1.75e-18 | 146 |
| hsa050108 | Colorectum | FAP | Alzheimer disease | 105/1404 | 384/8465 | 3.74e-08 | 1.04e-06 | 6.33e-07 | 105 |
| hsa050109 | Colorectum | FAP | Alzheimer disease | 105/1404 | 384/8465 | 3.74e-08 | 1.04e-06 | 6.33e-07 | 105 |
| hsa0501014 | Liver | Cirrhotic | Alzheimer disease | 180/2530 | 384/8465 | 5.52e-13 | 1.36e-11 | 8.36e-12 | 180 |
| hsa051204 | Liver | Cirrhotic | Epithelial cell signaling in Helicobacter pylori infection | 34/2530 | 70/8465 | 7.42e-04 | 4.33e-03 | 2.67e-03 | 34 |
| hsa0501015 | Liver | Cirrhotic | Alzheimer disease | 180/2530 | 384/8465 | 5.52e-13 | 1.36e-11 | 8.36e-12 | 180 |
| hsa0512011 | Liver | Cirrhotic | Epithelial cell signaling in Helicobacter pylori infection | 34/2530 | 70/8465 | 7.42e-04 | 4.33e-03 | 2.67e-03 | 34 |
| hsa0501022 | Liver | HCC | Alzheimer disease | 254/4020 | 384/8465 | 3.75e-14 | 8.97e-13 | 4.99e-13 | 254 |
| hsa051202 | Liver | HCC | Epithelial cell signaling in Helicobacter pylori infection | 50/4020 | 70/8465 | 3.96e-05 | 2.16e-04 | 1.20e-04 | 50 |
| hsa0501032 | Liver | HCC | Alzheimer disease | 254/4020 | 384/8465 | 3.75e-14 | 8.97e-13 | 4.99e-13 | 254 |
| hsa051203 | Liver | HCC | Epithelial cell signaling in Helicobacter pylori infection | 50/4020 | 70/8465 | 3.96e-05 | 2.16e-04 | 1.20e-04 | 50 |
| hsa0501062 | Oral cavity | NEOLP | Alzheimer disease | 97/1112 | 384/8465 | 3.97e-11 | 1.57e-09 | 9.89e-10 | 97 |
| hsa0501072 | Oral cavity | NEOLP | Alzheimer disease | 97/1112 | 384/8465 | 3.97e-11 | 1.57e-09 | 9.89e-10 | 97 |
| hsa0501026 | Prostate | BPH | Alzheimer disease | 165/1718 | 384/8465 | 4.03e-25 | 1.66e-23 | 1.03e-23 | 165 |
| hsa051209 | Prostate | BPH | Epithelial cell signaling in Helicobacter pylori infection | 29/1718 | 70/8465 | 4.25e-05 | 2.98e-04 | 1.85e-04 | 29 |
| hsa05010111 | Prostate | BPH | Alzheimer disease | 165/1718 | 384/8465 | 4.03e-25 | 1.66e-23 | 1.03e-23 | 165 |
| hsa0512016 | Prostate | BPH | Epithelial cell signaling in Helicobacter pylori infection | 29/1718 | 70/8465 | 4.25e-05 | 2.98e-04 | 1.85e-04 | 29 |
| Page: 1 |
Top |
Cell-cell communication analysis |
| Identification of potential cell-cell interactions between two cell types and their ligand-receptor pairs for different disease states |
| Ligand | Receptor | LRpair | Pathway | Tissue | Disease Stage |
| Page: 1 |
Top |
Single-cell gene regulatory network inference analysis |
| Find out the significant the regulons (TFs) and the target genes of each regulon across cell types for different disease states |
| TF | Cell Type | Tissue | Disease Stage | Target Gene | RSS | Regulon Activity |
| ∗The dot plots of a searched regulon are shown for all cell subpopulations in each disease state of each tissue based on the regulon specific score inferred using pySCENIC and by calculating the average expression. |
| Page: 1 |
Top |
Somatic mutation of malignant transformation related genes |
| Annotation of somatic variants for genes involved in malignant transformation |
| Hugo Symbol | Variant Class | Variant Classification | dbSNP RS | HGVSc | HGVSp | HGVSp Short | SWISSPROT | BIOTYPE | SIFT | PolyPhen | Tumor Sample Barcode | Tissue | Histology | Sex | Age | Stage | Therapy Types | Drugs | Outcome |
| ADAM10 | SNV | Missense_Mutation | novel | c.1712N>G | p.Ile571Ser | p.I571S | O14672 | protein_coding | deleterious(0) | possibly_damaging(0.864) | TCGA-AC-A3W5-01 | Breast | breast invasive carcinoma | Female | >=65 | I/II | Chemotherapy | docetaxel | CR |
| ADAM10 | SNV | Missense_Mutation | c.292G>C | p.Asp98His | p.D98H | O14672 | protein_coding | deleterious(0.01) | probably_damaging(0.948) | TCGA-AN-A0FS-01 | Breast | breast invasive carcinoma | Female | <65 | I/II | Unknown | Unknown | SD | |
| ADAM10 | SNV | Missense_Mutation | novel | c.1564N>A | p.Glu522Lys | p.E522K | O14672 | protein_coding | tolerated(0.49) | benign(0.01) | TCGA-AR-A2LE-01 | Breast | breast invasive carcinoma | Female | >=65 | I/II | Hormone Therapy | tamoxiphen | PD |
| ADAM10 | SNV | Missense_Mutation | c.313G>A | p.Gly105Arg | p.G105R | O14672 | protein_coding | deleterious(0) | probably_damaging(1) | TCGA-BH-A0HF-01 | Breast | breast invasive carcinoma | Female | >=65 | I/II | Hormone Therapy | arimidex | SD | |
| ADAM10 | SNV | Missense_Mutation | rs371036827 | c.523G>A | p.Asp175Asn | p.D175N | O14672 | protein_coding | tolerated(0.09) | benign(0.097) | TCGA-GM-A2D9-01 | Breast | breast invasive carcinoma | Female | >=65 | I/II | Hormone Therapy | arimidex | SD |
| ADAM10 | SNV | Missense_Mutation | novel | c.740N>T | p.Ser247Phe | p.S247F | O14672 | protein_coding | deleterious(0) | possibly_damaging(0.593) | TCGA-2W-A8YY-01 | Cervix | cervical & endocervical cancer | Female | <65 | I/II | Chemotherapy | cisplatin | CR |
| ADAM10 | SNV | Missense_Mutation | c.166N>A | p.Glu56Lys | p.E56K | O14672 | protein_coding | tolerated(0.57) | benign(0.216) | TCGA-C5-A1MK-01 | Cervix | cervical & endocervical cancer | Female | >=65 | III/IV | Chemotherapy | carboplatin | PD | |
| ADAM10 | SNV | Missense_Mutation | c.1207N>C | p.Glu403Gln | p.E403Q | O14672 | protein_coding | tolerated(0.07) | probably_damaging(0.925) | TCGA-IR-A3LL-01 | Cervix | cervical & endocervical cancer | Female | <65 | I/II | Chemotherapy | cisplatin | CR | |
| ADAM10 | SNV | Missense_Mutation | c.779N>T | p.Thr260Ile | p.T260I | O14672 | protein_coding | deleterious(0.01) | possibly_damaging(0.517) | TCGA-A6-2680-01 | Colorectum | colon adenocarcinoma | Female | >=65 | I/II | Unknown | Unknown | SD | |
| ADAM10 | SNV | Missense_Mutation | c.883N>G | p.Ile295Val | p.I295V | O14672 | protein_coding | tolerated(0.1) | benign(0.206) | TCGA-A6-6653-01 | Colorectum | colon adenocarcinoma | Male | >=65 | I/II | Unknown | Unknown | SD |
| Page: 1 2 3 4 5 6 7 8 |
Top |
Related drugs of malignant transformation related genes |
| Identification of chemicals and drugs interact with genes involved in malignant transfromation |
| (DGIdb 4.0) |
| Entrez ID | Symbol | Category | Interaction Types | Drug Claim Name | Drug Name | PMIDs |
| 102 | ADAM10 | ENZYME, CELL SURFACE, TRANSPORTER, NEUTRAL ZINC METALLOPEPTIDASE, DRUGGABLE GENOME, PROTEASE | inhibitor | 348353646 | ||
| 102 | ADAM10 | ENZYME, CELL SURFACE, TRANSPORTER, NEUTRAL ZINC METALLOPEPTIDASE, DRUGGABLE GENOME, PROTEASE | inhibitor | 178103981 | ILOMASTAT | |
| 102 | ADAM10 | ENZYME, CELL SURFACE, TRANSPORTER, NEUTRAL ZINC METALLOPEPTIDASE, DRUGGABLE GENOME, PROTEASE | INCB7839 | |||
| 102 | ADAM10 | ENZYME, CELL SURFACE, TRANSPORTER, NEUTRAL ZINC METALLOPEPTIDASE, DRUGGABLE GENOME, PROTEASE | inhibitor | 252166769 | ||
| 102 | ADAM10 | ENZYME, CELL SURFACE, TRANSPORTER, NEUTRAL ZINC METALLOPEPTIDASE, DRUGGABLE GENOME, PROTEASE | MARIMASTAT | MARIMASTAT | 26192023 | |
| 102 | ADAM10 | ENZYME, CELL SURFACE, TRANSPORTER, NEUTRAL ZINC METALLOPEPTIDASE, DRUGGABLE GENOME, PROTEASE | Aderbasib | ADERBASIB |
| Page: 1 |

Copyright 2023-Present -The University of Texas Health Science Center at Houston |