
|
|||||
|
 | |
| |
| |
| |
| |
| |
|
Gene: ACY1 |
Gene summary for ACY1 |
| Gene information | Species | Human | Gene symbol | ACY1 | Gene ID | 95 |
| Gene name | aminoacylase 1 | |
| Gene Alias | ACY-1 | |
| Cytomap | 3p21.2 | |
| Gene Type | protein-coding | GO ID | GO:0006082 | UniProtAcc | Q03154 |
Top |
Malignant transformation analysis |
| Identification of the aberrant gene expression in precancerous and cancerous lesions by comparing the gene expression of stem-like cells in diseased tissues with normal stem cells |
| Entrez ID | Symbol | Replicates | Species | Organ | Tissue | Adj P-value | Log2FC | Malignancy |
| 95 | ACY1 | HTA11_3410_2000001011 | Human | Colorectum | AD | 1.92e-09 | 2.27e-01 | 0.0155 |
| 95 | ACY1 | HTA11_2487_2000001011 | Human | Colorectum | SER | 2.53e-34 | 1.03e+00 | -0.1808 |
| 95 | ACY1 | HTA11_2951_2000001011 | Human | Colorectum | AD | 3.40e-03 | 2.52e-01 | 0.0216 |
| 95 | ACY1 | HTA11_1938_2000001011 | Human | Colorectum | AD | 1.06e-19 | 5.63e-01 | -0.0811 |
| 95 | ACY1 | HTA11_78_2000001011 | Human | Colorectum | AD | 2.42e-13 | 4.30e-01 | -0.1088 |
| 95 | ACY1 | HTA11_347_2000001011 | Human | Colorectum | AD | 3.41e-19 | 4.11e-01 | -0.1954 |
| 95 | ACY1 | HTA11_411_2000001011 | Human | Colorectum | SER | 6.89e-14 | 1.55e+00 | -0.2602 |
| 95 | ACY1 | HTA11_2112_2000001011 | Human | Colorectum | SER | 3.88e-11 | 8.40e-01 | -0.2196 |
| 95 | ACY1 | HTA11_3361_2000001011 | Human | Colorectum | AD | 5.46e-22 | 5.20e-01 | -0.1207 |
| 95 | ACY1 | HTA11_83_2000001011 | Human | Colorectum | SER | 1.47e-06 | 2.71e-01 | -0.1526 |
| 95 | ACY1 | HTA11_696_2000001011 | Human | Colorectum | AD | 1.89e-27 | 4.92e-01 | -0.1464 |
| 95 | ACY1 | HTA11_866_2000001011 | Human | Colorectum | AD | 7.82e-13 | 2.93e-01 | -0.1001 |
| 95 | ACY1 | HTA11_1391_2000001011 | Human | Colorectum | AD | 2.44e-39 | 8.76e-01 | -0.059 |
| 95 | ACY1 | HTA11_2992_2000001011 | Human | Colorectum | SER | 2.50e-12 | 5.46e-01 | -0.1706 |
| 95 | ACY1 | HTA11_5212_2000001011 | Human | Colorectum | AD | 1.00e-07 | 3.42e-01 | -0.2061 |
| 95 | ACY1 | HTA11_5216_2000001011 | Human | Colorectum | SER | 3.40e-03 | 3.89e-01 | -0.1462 |
| 95 | ACY1 | HTA11_546_2000001011 | Human | Colorectum | AD | 8.36e-09 | 3.33e-01 | -0.0842 |
| 95 | ACY1 | HTA11_7862_2000001011 | Human | Colorectum | AD | 3.59e-09 | 3.05e-01 | -0.0179 |
| 95 | ACY1 | HTA11_866_3004761011 | Human | Colorectum | AD | 1.15e-09 | 2.28e-01 | 0.096 |
| 95 | ACY1 | HTA11_4255_2000001011 | Human | Colorectum | SER | 3.40e-03 | 2.80e-01 | 0.0446 |
| Page: 1 2 3 4 5 6 7 |
| Tissue | Expression Dynamics | Abbreviation |
| Colorectum (GSE201348) |  | FAP: Familial adenomatous polyposis |
| CRC: Colorectal cancer | ||
| Colorectum (HTA11) |  | AD: Adenomas |
| SER: Sessile serrated lesions | ||
| MSI-H: Microsatellite-high colorectal cancer | ||
| MSS: Microsatellite stable colorectal cancer | ||
| Esophagus | 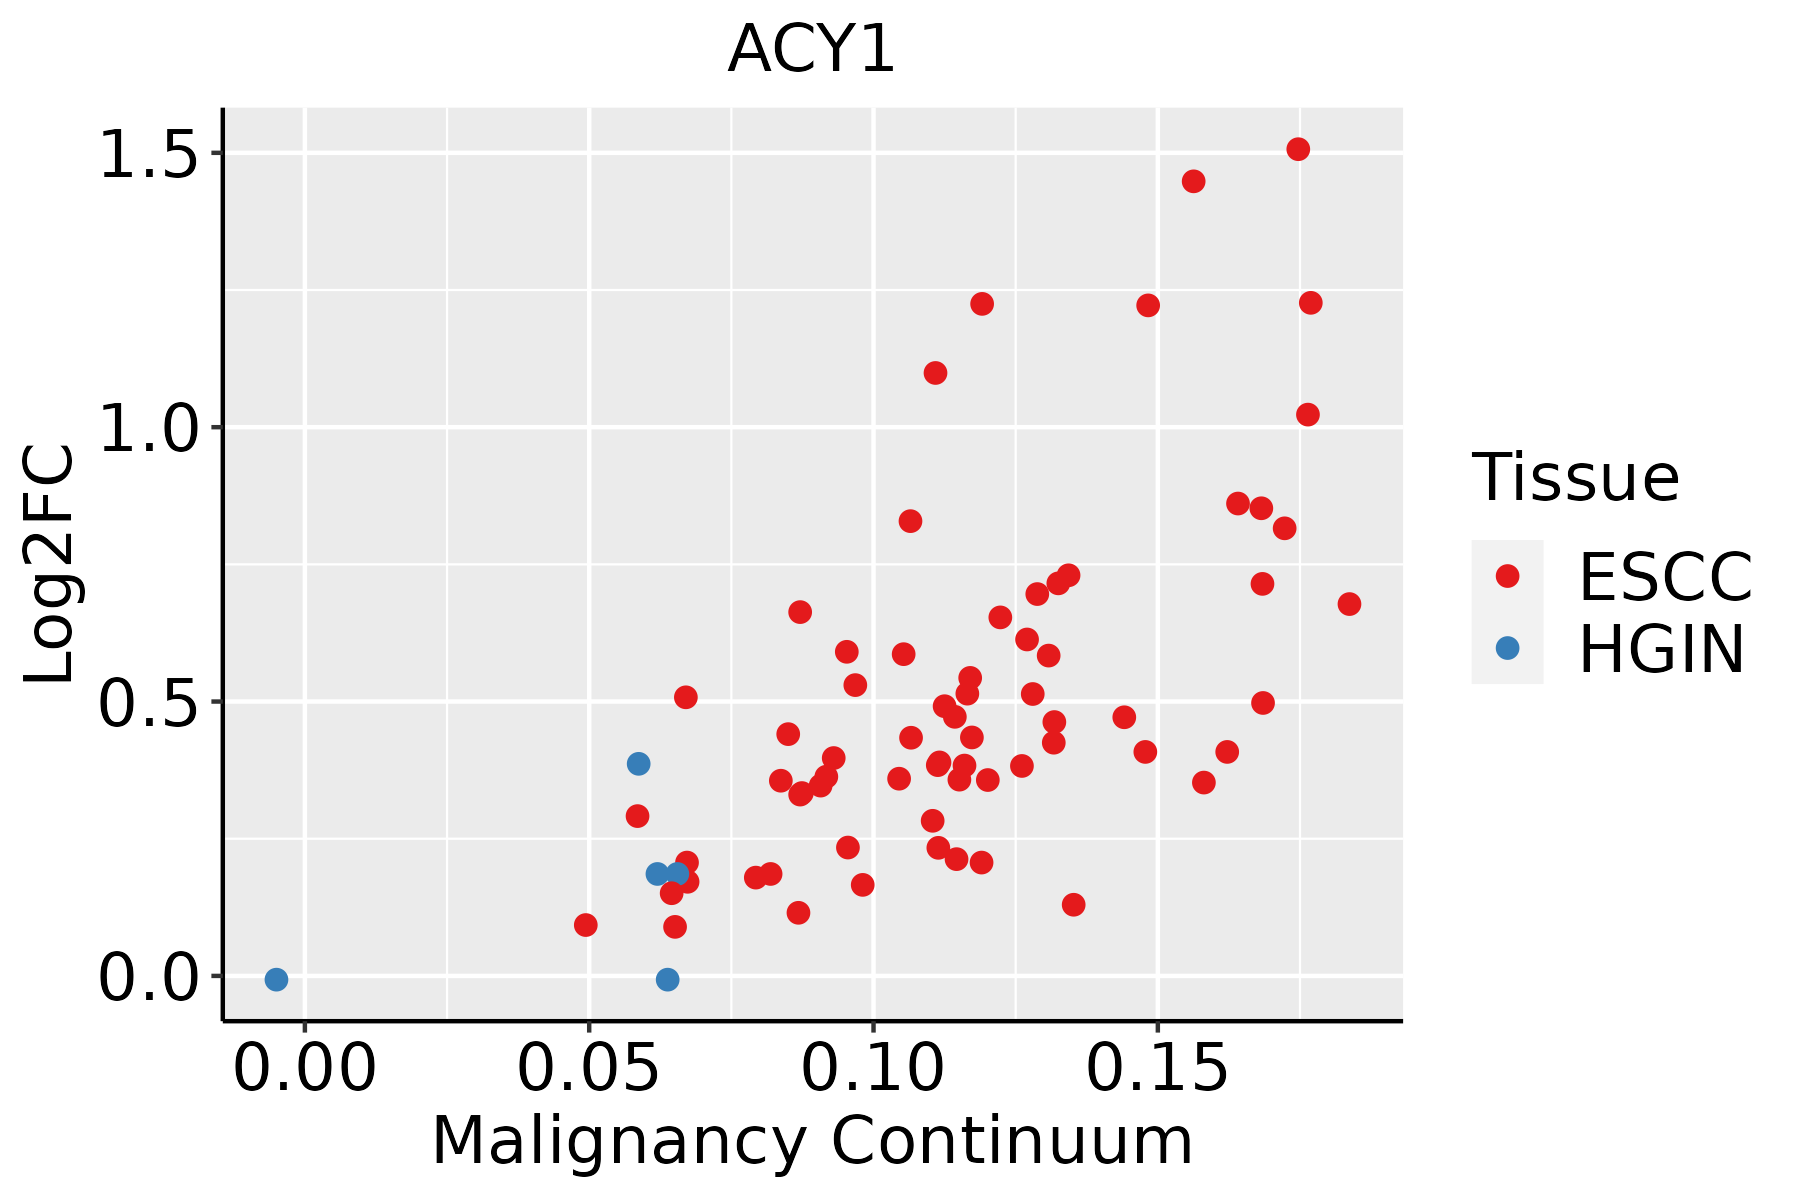 | ESCC: Esophageal squamous cell carcinoma |
| HGIN: High-grade intraepithelial neoplasias | ||
| LGIN: Low-grade intraepithelial neoplasias | ||
| GC | 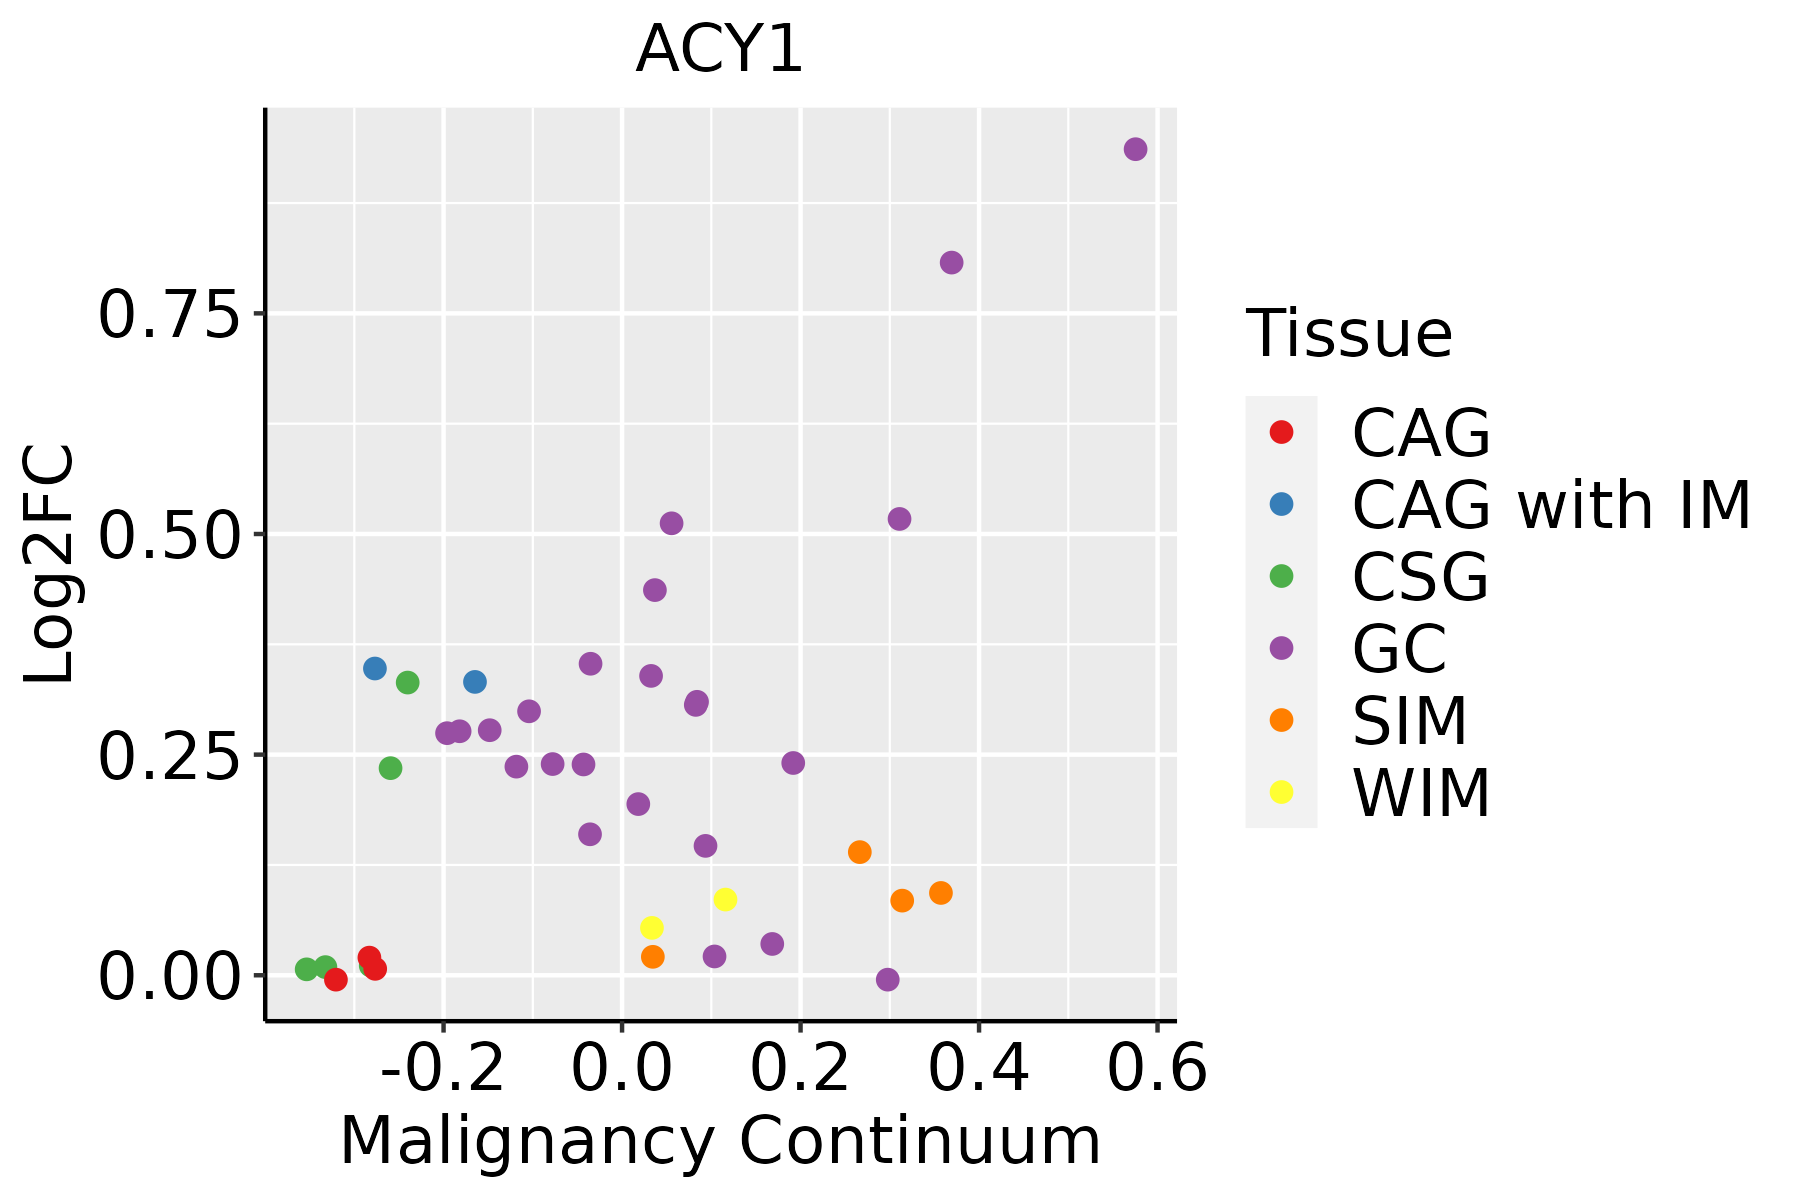 | CAG: Chronic atrophic gastritis |
| CAG with IM: Chronic atrophic gastritis with intestinal metaplasia | ||
| CSG: Chronic superficial gastritis | ||
| GC: Gastric cancer | ||
| SIM: Severe intestinal metaplasia | ||
| WIM: Wild intestinal metaplasia | ||
| Liver | 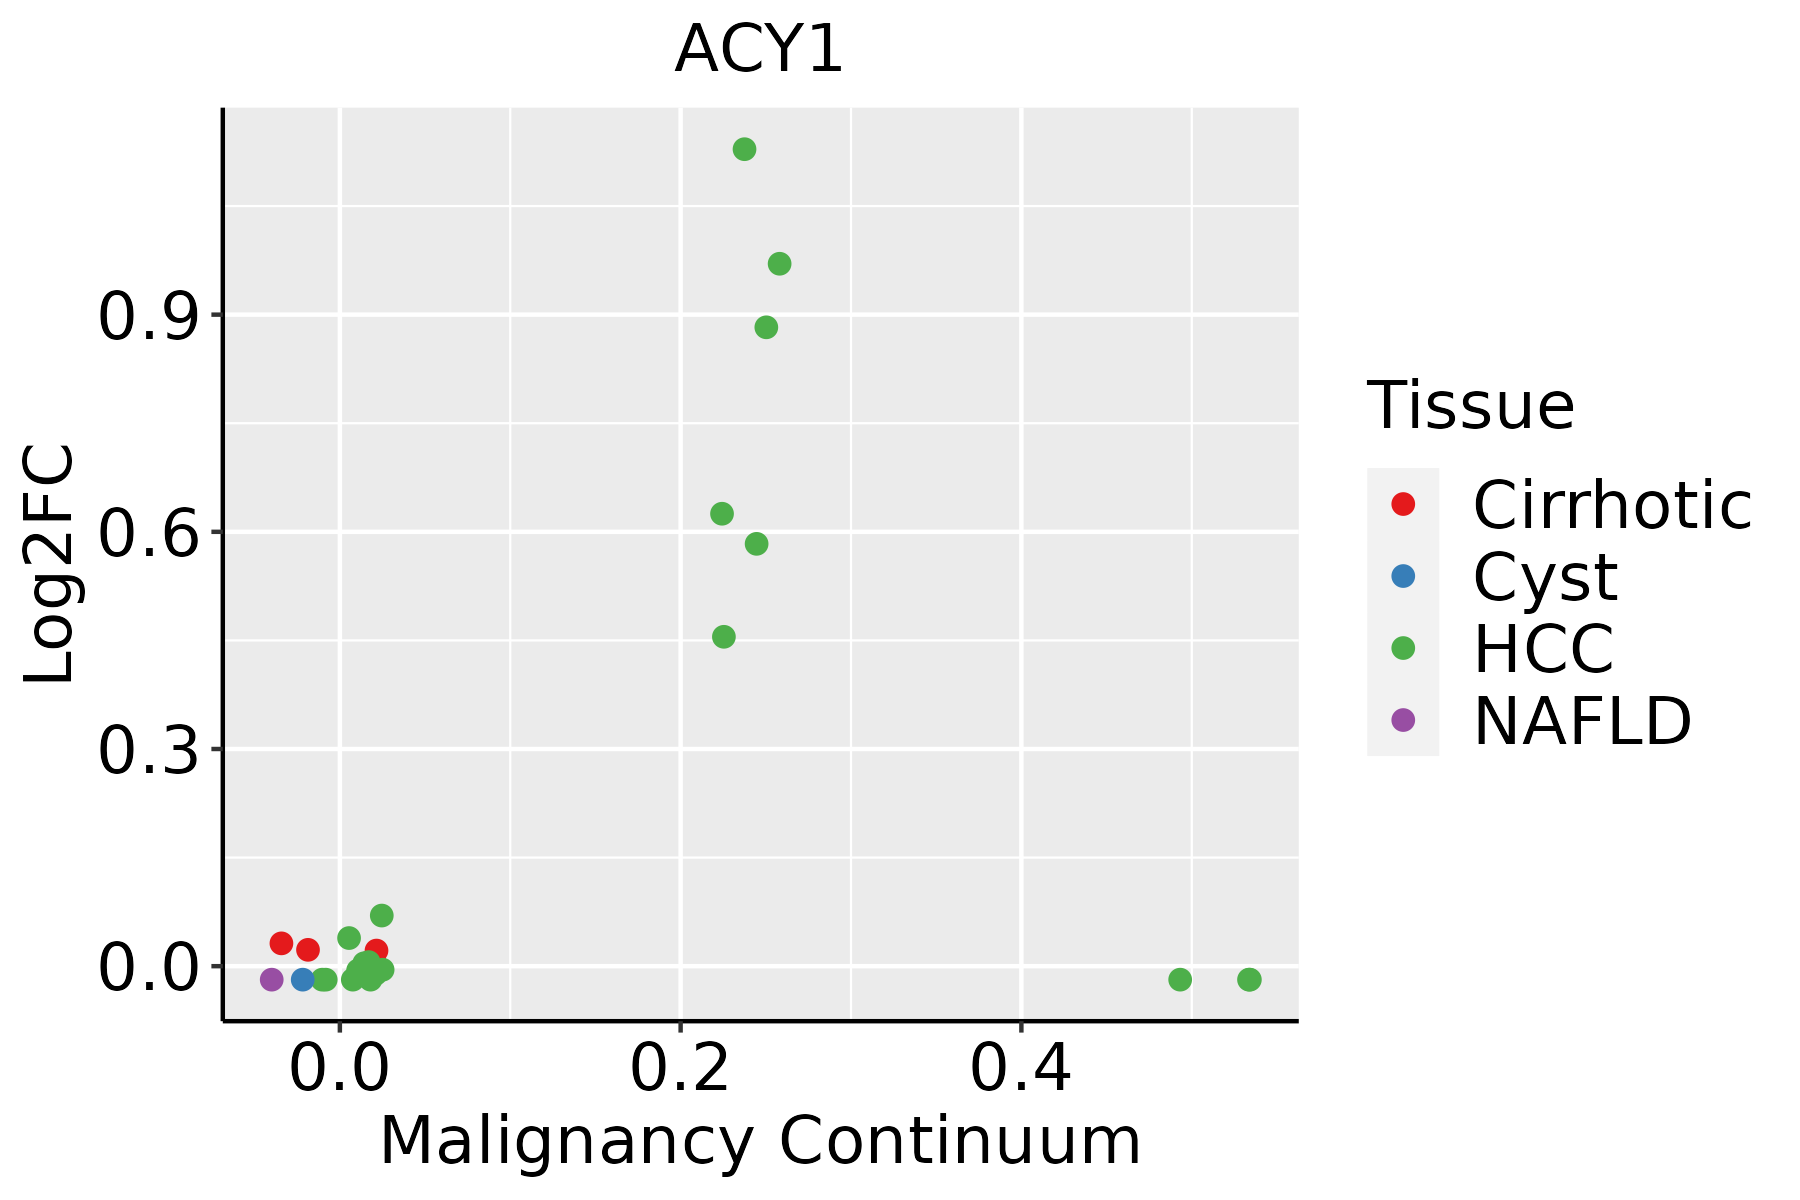 | HCC: Hepatocellular carcinoma |
| NAFLD: Non-alcoholic fatty liver disease |
| ∗log2FC in expression of this searched gene in stem-like cells from each diseased tissue sample relative to stem-like cells in normal samples in each tissue plotted against the malignancy continuum. Samples are colored based on if they are from different disease stage. |
Top |
Malignant transformation related pathway analysis |
| Find out the enriched GO biological processes and KEGG pathways involved in transition from healthy to precancer to cancer |
| Tissue | Disease Stage | Enriched GO biological Processes |
| Colorectum | AD |  |
| Colorectum | SER |  |
| Colorectum | MSS |  |
| Colorectum | MSI-H |  |
| Colorectum | FAP |  |
| ∗Top 15 enriched GO BP terms are showed in the bar plot of each disease state in each tissue. Each row represents a significant GO biological process which is colored according to the -log10(p.adjust). |
| Page: 1 2 3 4 5 6 7 8 9 |
| GO ID | Tissue | Disease Stage | Description | Gene Ratio | Bg Ratio | pvalue | p.adjust | Count |
| GO:0006520 | Colorectum | AD | cellular amino acid metabolic process | 81/3918 | 284/18723 | 1.37e-03 | 1.19e-02 | 81 |
| GO:00065201 | Colorectum | SER | cellular amino acid metabolic process | 61/2897 | 284/18723 | 4.20e-03 | 3.41e-02 | 61 |
| GO:00065202 | Liver | HCC | cellular amino acid metabolic process | 167/7958 | 284/18723 | 1.91e-08 | 4.56e-07 | 167 |
| Page: 1 |
| Pathway ID | Tissue | Disease Stage | Description | Gene Ratio | Bg Ratio | pvalue | p.adjust | qvalue | Count |
| hsa012306 | Esophagus | HGIN | Biosynthesis of amino acids | 21/1383 | 75/8465 | 7.38e-03 | 4.63e-02 | 3.68e-02 | 21 |
| hsa0123013 | Esophagus | HGIN | Biosynthesis of amino acids | 21/1383 | 75/8465 | 7.38e-03 | 4.63e-02 | 3.68e-02 | 21 |
| hsa0123023 | Esophagus | ESCC | Biosynthesis of amino acids | 49/4205 | 75/8465 | 4.35e-03 | 1.12e-02 | 5.74e-03 | 49 |
| hsa0123033 | Esophagus | ESCC | Biosynthesis of amino acids | 49/4205 | 75/8465 | 4.35e-03 | 1.12e-02 | 5.74e-03 | 49 |
| hsa0123021 | Liver | HCC | Biosynthesis of amino acids | 53/4020 | 75/8465 | 3.79e-05 | 2.11e-04 | 1.18e-04 | 53 |
| hsa0123031 | Liver | HCC | Biosynthesis of amino acids | 53/4020 | 75/8465 | 3.79e-05 | 2.11e-04 | 1.18e-04 | 53 |
| Page: 1 |
Top |
Cell-cell communication analysis |
| Identification of potential cell-cell interactions between two cell types and their ligand-receptor pairs for different disease states |
| Ligand | Receptor | LRpair | Pathway | Tissue | Disease Stage |
| Page: 1 |
Top |
Single-cell gene regulatory network inference analysis |
| Find out the significant the regulons (TFs) and the target genes of each regulon across cell types for different disease states |
| TF | Cell Type | Tissue | Disease Stage | Target Gene | RSS | Regulon Activity |
| ∗The dot plots of a searched regulon are shown for all cell subpopulations in each disease state of each tissue based on the regulon specific score inferred using pySCENIC and by calculating the average expression. |
| Page: 1 |
Top |
Somatic mutation of malignant transformation related genes |
| Annotation of somatic variants for genes involved in malignant transformation |
| Hugo Symbol | Variant Class | Variant Classification | dbSNP RS | HGVSc | HGVSp | HGVSp Short | SWISSPROT | BIOTYPE | SIFT | PolyPhen | Tumor Sample Barcode | Tissue | Histology | Sex | Age | Stage | Therapy Types | Drugs | Outcome |
| ACY1 | SNV | Missense_Mutation | rs201048015 | c.307G>C | p.Glu103Gln | p.E103Q | Q03154 | protein_coding | tolerated(0.38) | benign(0.009) | TCGA-E2-A14Z-01 | Breast | breast invasive carcinoma | Female | <65 | I/II | Hormone Therapy | arimidex | PD |
| ACY1 | insertion | Frame_Shift_Ins | novel | c.681_682insCACCCCAGGCTGATTGT | p.Ala228HisfsTer22 | p.A228Hfs*22 | Q03154 | protein_coding | TCGA-BH-A0HL-01 | Breast | breast invasive carcinoma | Female | <65 | I/II | Chemotherapy | cyclophosphamide | SD | ||
| ACY1 | deletion | Frame_Shift_Del | novel | c.56_69delNNNNNNNNNNNNNN | p.Leu20CysfsTer6 | p.L20Cfs*6 | Q03154 | protein_coding | TCGA-C5-A1M8-01 | Cervix | cervical & endocervical cancer | Female | <65 | I/II | Unknown | Unknown | SD | ||
| ACY1 | SNV | Missense_Mutation | c.385N>G | p.Lys129Glu | p.K129E | Q03154 | protein_coding | deleterious(0.01) | possibly_damaging(0.809) | TCGA-AA-3715-01 | Colorectum | colon adenocarcinoma | Male | >=65 | I/II | Unknown | Unknown | PD | |
| ACY1 | SNV | Missense_Mutation | rs779815701 | c.1058N>A | p.Arg353His | p.R353H | Q03154 | protein_coding | deleterious(0) | probably_damaging(1) | TCGA-CM-4746-01 | Colorectum | colon adenocarcinoma | Male | <65 | I/II | Unknown | Unknown | SD |
| ACY1 | SNV | Missense_Mutation | c.907N>A | p.Leu303Ile | p.L303I | Q03154 | protein_coding | tolerated(0.67) | benign(0.015) | TCGA-G4-6628-01 | Colorectum | colon adenocarcinoma | Male | >=65 | I/II | Unknown | Unknown | SD | |
| ACY1 | SNV | Missense_Mutation | novel | c.34N>C | p.Ser12Pro | p.S12P | Q03154 | protein_coding | tolerated(0.05) | possibly_damaging(0.777) | TCGA-A5-A0G2-01 | Endometrium | uterine corpus endometrioid carcinoma | Female | <65 | III/IV | Unknown | Unknown | SD |
| ACY1 | SNV | Missense_Mutation | rs773804575 | c.127N>T | p.Arg43Cys | p.R43C | Q03154 | protein_coding | deleterious(0.04) | benign(0.366) | TCGA-A5-A2K3-01 | Endometrium | uterine corpus endometrioid carcinoma | Female | >=65 | I/II | Chemotherapy | carboplatin | SD |
| ACY1 | SNV | Missense_Mutation | rs781344834 | c.688N>T | p.Arg230Trp | p.R230W | Q03154 | protein_coding | deleterious(0) | probably_damaging(1) | TCGA-AJ-A3BH-01 | Endometrium | uterine corpus endometrioid carcinoma | Female | Unknown | I/II | Unknown | Unknown | SD |
| ACY1 | SNV | Missense_Mutation | rs553270370 | c.475G>A | p.Val159Met | p.V159M | Q03154 | protein_coding | deleterious(0.03) | possibly_damaging(0.71) | TCGA-AP-A1E1-01 | Endometrium | uterine corpus endometrioid carcinoma | Female | >=65 | I/II | Unknown | Unknown | SD |
| Page: 1 2 3 |
Top |
Related drugs of malignant transformation related genes |
| Identification of chemicals and drugs interact with genes involved in malignant transfromation |
| (DGIdb 4.0) |
| Entrez ID | Symbol | Category | Interaction Types | Drug Claim Name | Drug Name | PMIDs |
| Page: 1 |

Copyright 2023-Present -The University of Texas Health Science Center at Houston |