
|
|||||
|
 | |
| |
| |
| |
| |
| |
|
Gene: ACVRL1 |
Gene summary for ACVRL1 |
| Gene information | Species | Human | Gene symbol | ACVRL1 | Gene ID | 94 |
| Gene name | activin A receptor like type 1 | |
| Gene Alias | ACVRLK1 | |
| Cytomap | 12q13.13 | |
| Gene Type | protein-coding | GO ID | GO:0001501 | UniProtAcc | A0A0S2Z310 |
Top |
Malignant transformation analysis |
| Identification of the aberrant gene expression in precancerous and cancerous lesions by comparing the gene expression of stem-like cells in diseased tissues with normal stem cells |
| Entrez ID | Symbol | Replicates | Species | Organ | Tissue | Adj P-value | Log2FC | Malignancy |
| 94 | ACVRL1 | HTA11_2487_2000001011 | Human | Colorectum | SER | 1.83e-06 | 3.67e-01 | -0.1808 |
| 94 | ACVRL1 | HTA11_1938_2000001011 | Human | Colorectum | AD | 4.89e-05 | 2.28e-01 | -0.0811 |
| 94 | ACVRL1 | HTA11_78_2000001011 | Human | Colorectum | AD | 2.63e-02 | 2.51e-01 | -0.1088 |
| 94 | ACVRL1 | HTA11_347_2000001011 | Human | Colorectum | AD | 5.31e-21 | 5.41e-01 | -0.1954 |
| 94 | ACVRL1 | HTA11_411_2000001011 | Human | Colorectum | SER | 3.98e-07 | 1.07e+00 | -0.2602 |
| 94 | ACVRL1 | HTA11_2112_2000001011 | Human | Colorectum | SER | 2.37e-04 | 6.49e-01 | -0.2196 |
| 94 | ACVRL1 | HTA11_696_2000001011 | Human | Colorectum | AD | 5.53e-15 | 5.69e-01 | -0.1464 |
| 94 | ACVRL1 | HTA11_866_2000001011 | Human | Colorectum | AD | 2.61e-05 | 3.34e-01 | -0.1001 |
| 94 | ACVRL1 | HTA11_1391_2000001011 | Human | Colorectum | AD | 1.29e-06 | 2.40e-01 | -0.059 |
| 94 | ACVRL1 | HTA11_2992_2000001011 | Human | Colorectum | SER | 4.03e-04 | 6.85e-01 | -0.1706 |
| 94 | ACVRL1 | HTA11_5212_2000001011 | Human | Colorectum | AD | 3.12e-12 | 7.70e-01 | -0.2061 |
| 94 | ACVRL1 | HTA11_866_3004761011 | Human | Colorectum | AD | 2.84e-04 | 1.75e-01 | 0.096 |
| 94 | ACVRL1 | HTA11_10623_2000001011 | Human | Colorectum | AD | 4.31e-03 | 2.54e-01 | -0.0177 |
| 94 | ACVRL1 | HTA11_10711_2000001011 | Human | Colorectum | AD | 5.37e-10 | 2.90e-01 | 0.0338 |
| 94 | ACVRL1 | HTA11_6818_2000001011 | Human | Colorectum | AD | 1.85e-02 | 3.13e-01 | 0.0112 |
| 94 | ACVRL1 | HTA11_99999965104_69814 | Human | Colorectum | MSS | 3.96e-02 | 8.77e-02 | 0.281 |
| 94 | ACVRL1 | ATC12 | Human | Thyroid | ATC | 5.95e-07 | 1.80e-01 | 0.34 |
| 94 | ACVRL1 | ATC13 | Human | Thyroid | ATC | 5.60e-61 | 1.26e+00 | 0.34 |
| 94 | ACVRL1 | ATC4 | Human | Thyroid | ATC | 4.56e-09 | 2.16e-01 | 0.34 |
| 94 | ACVRL1 | ATC5 | Human | Thyroid | ATC | 1.81e-60 | 1.33e+00 | 0.34 |
| Page: 1 |
| Tissue | Expression Dynamics | Abbreviation |
| Colorectum (GSE201348) |  | FAP: Familial adenomatous polyposis |
| CRC: Colorectal cancer | ||
| Colorectum (HTA11) |  | AD: Adenomas |
| SER: Sessile serrated lesions | ||
| MSI-H: Microsatellite-high colorectal cancer | ||
| MSS: Microsatellite stable colorectal cancer | ||
| Oral Cavity | 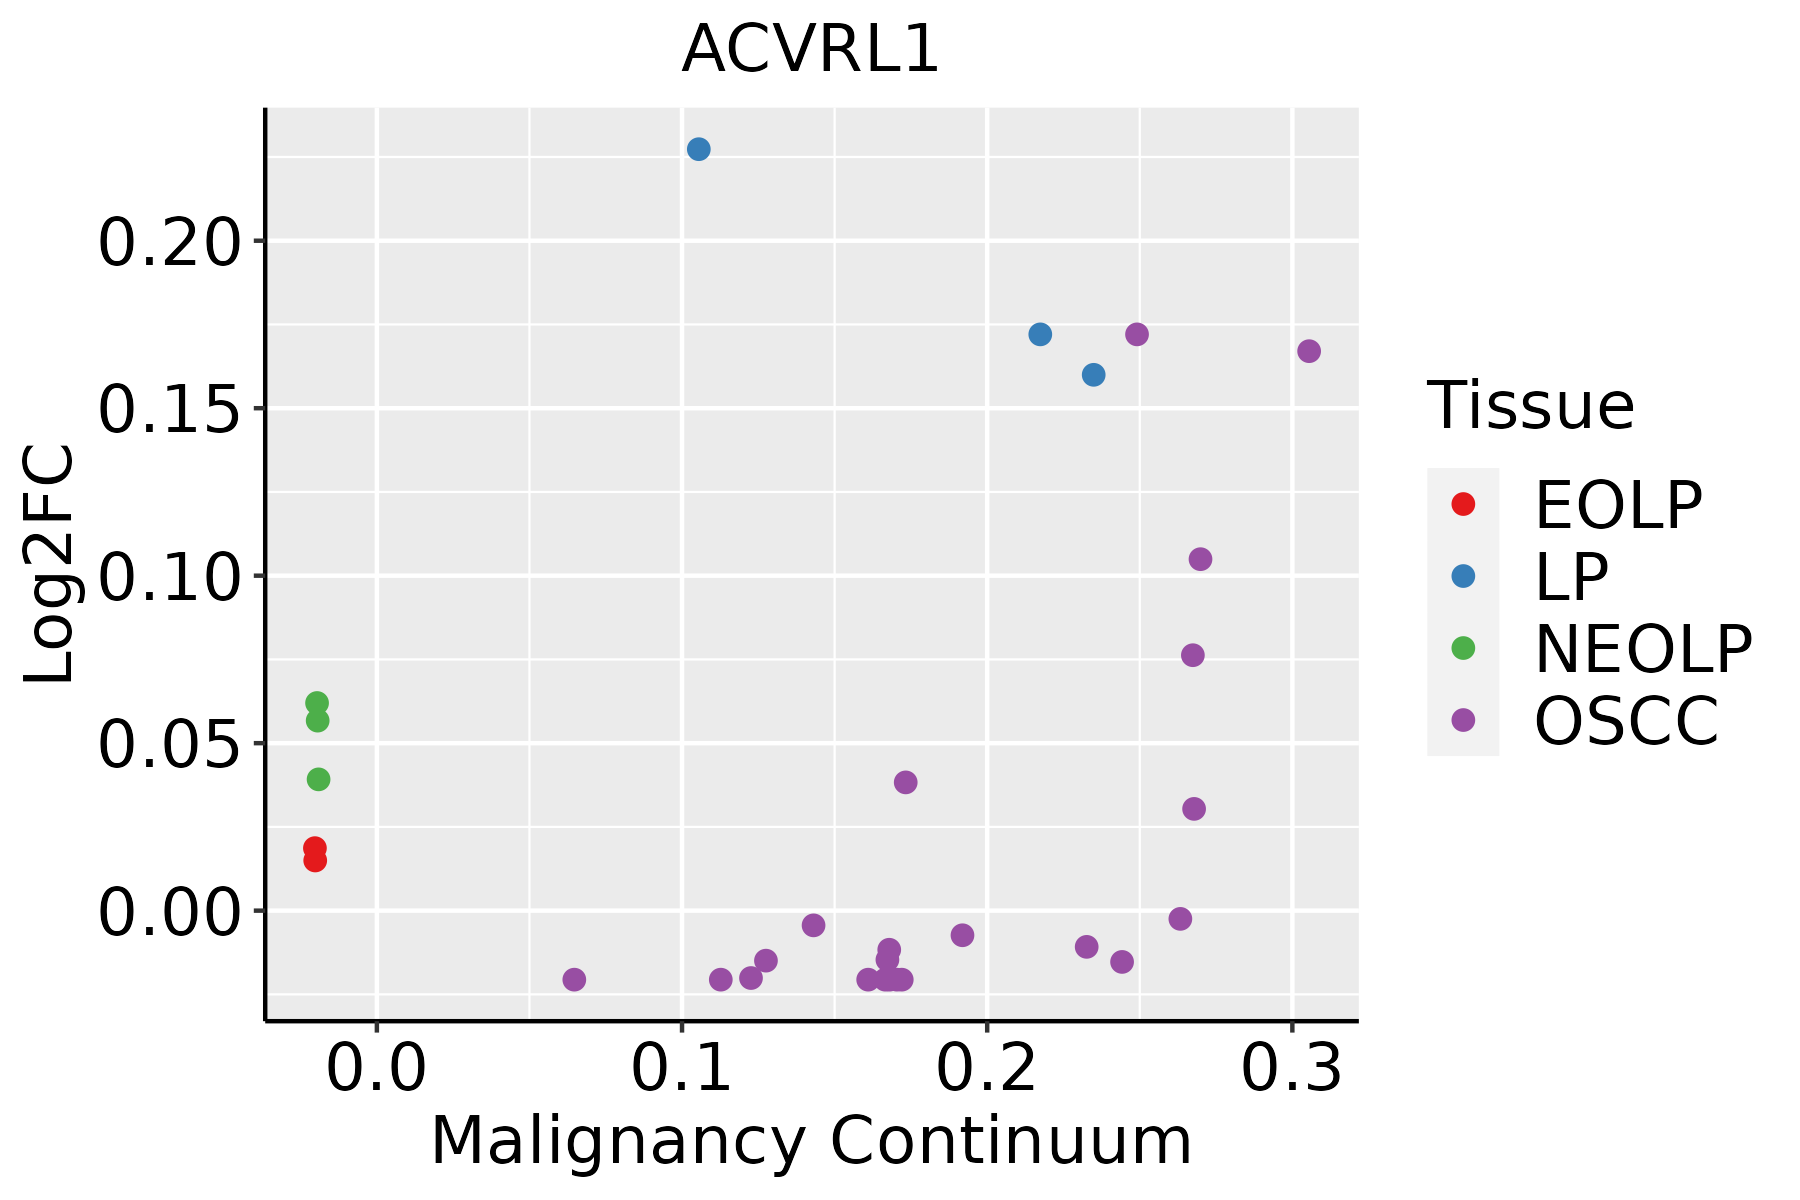 | EOLP: Erosive Oral lichen planus |
| LP: leukoplakia | ||
| NEOLP: Non-erosive oral lichen planus | ||
| OSCC: Oral squamous cell carcinoma | ||
| Thyroid |  | ATC: Anaplastic thyroid cancer |
| HT: Hashimoto's thyroiditis | ||
| PTC: Papillary thyroid cancer |
| ∗log2FC in expression of this searched gene in stem-like cells from each diseased tissue sample relative to stem-like cells in normal samples in each tissue plotted against the malignancy continuum. Samples are colored based on if they are from different disease stage. |
Top |
Malignant transformation related pathway analysis |
| Find out the enriched GO biological processes and KEGG pathways involved in transition from healthy to precancer to cancer |
| Tissue | Disease Stage | Enriched GO biological Processes |
| Colorectum | AD |  |
| Colorectum | SER |  |
| Colorectum | MSS |  |
| Colorectum | MSI-H |  |
| Colorectum | FAP |  |
| ∗Top 15 enriched GO BP terms are showed in the bar plot of each disease state in each tissue. Each row represents a significant GO biological process which is colored according to the -log10(p.adjust). |
| Page: 1 2 3 4 5 6 7 8 9 |
| GO ID | Tissue | Disease Stage | Description | Gene Ratio | Bg Ratio | pvalue | p.adjust | Count |
| GO:0034329 | Colorectum | AD | cell junction assembly | 136/3918 | 420/18723 | 2.02e-08 | 1.15e-06 | 136 |
| GO:0010810 | Colorectum | AD | regulation of cell-substrate adhesion | 81/3918 | 221/18723 | 4.80e-08 | 2.55e-06 | 81 |
| GO:0150115 | Colorectum | AD | cell-substrate junction organization | 44/3918 | 101/18723 | 2.38e-07 | 9.81e-06 | 44 |
| GO:0051052 | Colorectum | AD | regulation of DNA metabolic process | 116/3918 | 359/18723 | 2.47e-07 | 1.00e-05 | 116 |
| GO:0031589 | Colorectum | AD | cell-substrate adhesion | 116/3918 | 363/18723 | 4.68e-07 | 1.76e-05 | 116 |
| GO:0007044 | Colorectum | AD | cell-substrate junction assembly | 41/3918 | 95/18723 | 8.20e-07 | 2.85e-05 | 41 |
| GO:0001952 | Colorectum | AD | regulation of cell-matrix adhesion | 50/3918 | 128/18723 | 2.05e-06 | 6.05e-05 | 50 |
| GO:0042060 | Colorectum | AD | wound healing | 128/3918 | 422/18723 | 2.73e-06 | 7.89e-05 | 128 |
| GO:0016049 | Colorectum | AD | cell growth | 143/3918 | 482/18723 | 2.83e-06 | 8.09e-05 | 143 |
| GO:0001558 | Colorectum | AD | regulation of cell growth | 124/3918 | 414/18723 | 7.67e-06 | 1.86e-04 | 124 |
| GO:2000278 | Colorectum | AD | regulation of DNA biosynthetic process | 41/3918 | 106/18723 | 2.17e-05 | 4.33e-04 | 41 |
| GO:0001667 | Colorectum | AD | ameboidal-type cell migration | 137/3918 | 475/18723 | 2.17e-05 | 4.33e-04 | 137 |
| GO:0001701 | Colorectum | AD | in utero embryonic development | 110/3918 | 367/18723 | 2.36e-05 | 4.62e-04 | 110 |
| GO:0007160 | Colorectum | AD | cell-matrix adhesion | 75/3918 | 233/18723 | 3.56e-05 | 6.45e-04 | 75 |
| GO:0048041 | Colorectum | AD | focal adhesion assembly | 34/3918 | 87/18723 | 8.30e-05 | 1.30e-03 | 34 |
| GO:0090132 | Colorectum | AD | epithelium migration | 105/3918 | 360/18723 | 1.18e-04 | 1.73e-03 | 105 |
| GO:0010632 | Colorectum | AD | regulation of epithelial cell migration | 88/3918 | 292/18723 | 1.19e-04 | 1.75e-03 | 88 |
| GO:0010631 | Colorectum | AD | epithelial cell migration | 104/3918 | 357/18723 | 1.33e-04 | 1.90e-03 | 104 |
| GO:0090130 | Colorectum | AD | tissue migration | 105/3918 | 365/18723 | 2.10e-04 | 2.77e-03 | 105 |
| GO:0150116 | Colorectum | AD | regulation of cell-substrate junction organization | 28/3918 | 71/18723 | 2.85e-04 | 3.48e-03 | 28 |
| Page: 1 2 3 4 5 6 7 8 9 |
| Pathway ID | Tissue | Disease Stage | Description | Gene Ratio | Bg Ratio | pvalue | p.adjust | qvalue | Count |
| Page: 1 |
Top |
Cell-cell communication analysis |
| Identification of potential cell-cell interactions between two cell types and their ligand-receptor pairs for different disease states |
| Ligand | Receptor | LRpair | Pathway | Tissue | Disease Stage |
| Page: 1 |
Top |
Single-cell gene regulatory network inference analysis |
| Find out the significant the regulons (TFs) and the target genes of each regulon across cell types for different disease states |
| TF | Cell Type | Tissue | Disease Stage | Target Gene | RSS | Regulon Activity |
| ∗The dot plots of a searched regulon are shown for all cell subpopulations in each disease state of each tissue based on the regulon specific score inferred using pySCENIC and by calculating the average expression. |
| Page: 1 |
Top |
Somatic mutation of malignant transformation related genes |
| Annotation of somatic variants for genes involved in malignant transformation |
| Hugo Symbol | Variant Class | Variant Classification | dbSNP RS | HGVSc | HGVSp | HGVSp Short | SWISSPROT | BIOTYPE | SIFT | PolyPhen | Tumor Sample Barcode | Tissue | Histology | Sex | Age | Stage | Therapy Types | Drugs | Outcome |
| ACVRL1 | SNV | Missense_Mutation | c.1273N>A | p.Phe425Ile | p.F425I | P37023 | protein_coding | deleterious(0) | probably_damaging(0.998) | TCGA-A2-A3Y0-01 | Breast | breast invasive carcinoma | Female | <65 | I/II | Chemotherapy | adriamycin | CR | |
| ACVRL1 | SNV | Missense_Mutation | c.1341N>C | p.Gln447His | p.Q447H | P37023 | protein_coding | tolerated(0.4) | benign(0.288) | TCGA-A8-A095-01 | Breast | breast invasive carcinoma | Female | <65 | I/II | Chemotherapy | 5-fluorouracil | CR | |
| ACVRL1 | SNV | Missense_Mutation | c.533N>G | p.Leu178Arg | p.L178R | P37023 | protein_coding | deleterious(0) | possibly_damaging(0.781) | TCGA-E9-A1NA-01 | Breast | breast invasive carcinoma | Female | <65 | I/II | Chemotherapy | cyclophosphamide | SD | |
| ACVRL1 | SNV | Missense_Mutation | c.670N>A | p.Glu224Lys | p.E224K | P37023 | protein_coding | deleterious(0) | probably_damaging(0.991) | TCGA-E9-A2JT-01 | Breast | breast invasive carcinoma | Female | <65 | I/II | Hormone Therapy | tamoxiphen | SD | |
| ACVRL1 | deletion | Frame_Shift_Del | c.376delG | p.Val126CysfsTer39 | p.V126Cfs*39 | P37023 | protein_coding | TCGA-AO-A128-01 | Breast | breast invasive carcinoma | Female | <65 | I/II | Chemotherapy | doxorubicin | SD | |||
| ACVRL1 | SNV | Missense_Mutation | novel | c.1001N>A | p.Arg334His | p.R334H | P37023 | protein_coding | deleterious(0) | probably_damaging(0.956) | TCGA-2W-A8YY-01 | Cervix | cervical & endocervical cancer | Female | <65 | I/II | Chemotherapy | cisplatin | CR |
| ACVRL1 | SNV | Missense_Mutation | c.1156N>T | p.Arg386Cys | p.R386C | P37023 | protein_coding | deleterious(0) | probably_damaging(0.97) | TCGA-LP-A7HU-01 | Cervix | cervical & endocervical cancer | Female | <65 | I/II | Unknown | Unknown | SD | |
| ACVRL1 | SNV | Missense_Mutation | c.1142T>C | p.Leu381Pro | p.L381P | P37023 | protein_coding | deleterious(0) | probably_damaging(1) | TCGA-ZJ-AAXJ-01 | Cervix | cervical & endocervical cancer | Female | <65 | I/II | Unknown | Unknown | SD | |
| ACVRL1 | SNV | Missense_Mutation | c.1139T>C | p.Val380Ala | p.V380A | P37023 | protein_coding | deleterious(0) | probably_damaging(0.974) | TCGA-AA-3867-01 | Colorectum | colon adenocarcinoma | Male | >=65 | III/IV | Unknown | Unknown | PD | |
| ACVRL1 | SNV | Missense_Mutation | rs141764916 | c.1157N>A | p.Arg386His | p.R386H | P37023 | protein_coding | deleterious(0.02) | benign(0.054) | TCGA-AA-3949-01 | Colorectum | colon adenocarcinoma | Female | >=65 | III/IV | Unknown | Unknown | SD |
| Page: 1 2 3 4 5 6 7 8 |
Top |
Related drugs of malignant transformation related genes |
| Identification of chemicals and drugs interact with genes involved in malignant transfromation |
| (DGIdb 4.0) |
| Entrez ID | Symbol | Category | Interaction Types | Drug Claim Name | Drug Name | PMIDs |
| 94 | ACVRL1 | KINASE, SERINE THREONINE KINASE, CELL SURFACE, DRUGGABLE GENOME, ENZYME | inhibitor | 249565824 | ||
| 94 | ACVRL1 | KINASE, SERINE THREONINE KINASE, CELL SURFACE, DRUGGABLE GENOME, ENZYME | inhibitor | 249565835 | ||
| 94 | ACVRL1 | KINASE, SERINE THREONINE KINASE, CELL SURFACE, DRUGGABLE GENOME, ENZYME | inhibitor | 249565801 | ||
| 94 | ACVRL1 | KINASE, SERINE THREONINE KINASE, CELL SURFACE, DRUGGABLE GENOME, ENZYME | DALANTERCEPT | DALANTERCEPT | ||
| 94 | ACVRL1 | KINASE, SERINE THREONINE KINASE, CELL SURFACE, DRUGGABLE GENOME, ENZYME | inhibitor | CHEMBL3545322 | PANULISIB | |
| 94 | ACVRL1 | KINASE, SERINE THREONINE KINASE, CELL SURFACE, DRUGGABLE GENOME, ENZYME | DALANTERCEPT | DALANTERCEPT | ||
| 94 | ACVRL1 | KINASE, SERINE THREONINE KINASE, CELL SURFACE, DRUGGABLE GENOME, ENZYME | inhibitor | 249565800 | ||
| 94 | ACVRL1 | KINASE, SERINE THREONINE KINASE, CELL SURFACE, DRUGGABLE GENOME, ENZYME | inhibitor | CHEMBL2109295 | ASCRINVACUMAB | |
| 94 | ACVRL1 | KINASE, SERINE THREONINE KINASE, CELL SURFACE, DRUGGABLE GENOME, ENZYME | inhibitor | 363894210 | PANULISIB | |
| 94 | ACVRL1 | KINASE, SERINE THREONINE KINASE, CELL SURFACE, DRUGGABLE GENOME, ENZYME | inhibitor | HESPERADIN | HESPERADIN | 19035792 |
| Page: 1 2 |

Copyright 2023-Present -The University of Texas Health Science Center at Houston |