| Tissue | Expression Dynamics | Abbreviation |
| Colorectum (GSE201348) |  | FAP: Familial adenomatous polyposis |
| CRC: Colorectal cancer |
| Colorectum (HTA11) |  | AD: Adenomas |
| SER: Sessile serrated lesions |
| MSI-H: Microsatellite-high colorectal cancer |
| MSS: Microsatellite stable colorectal cancer |
| Esophagus |  | ESCC: Esophageal squamous cell carcinoma |
| HGIN: High-grade intraepithelial neoplasias |
| LGIN: Low-grade intraepithelial neoplasias |
| Liver | 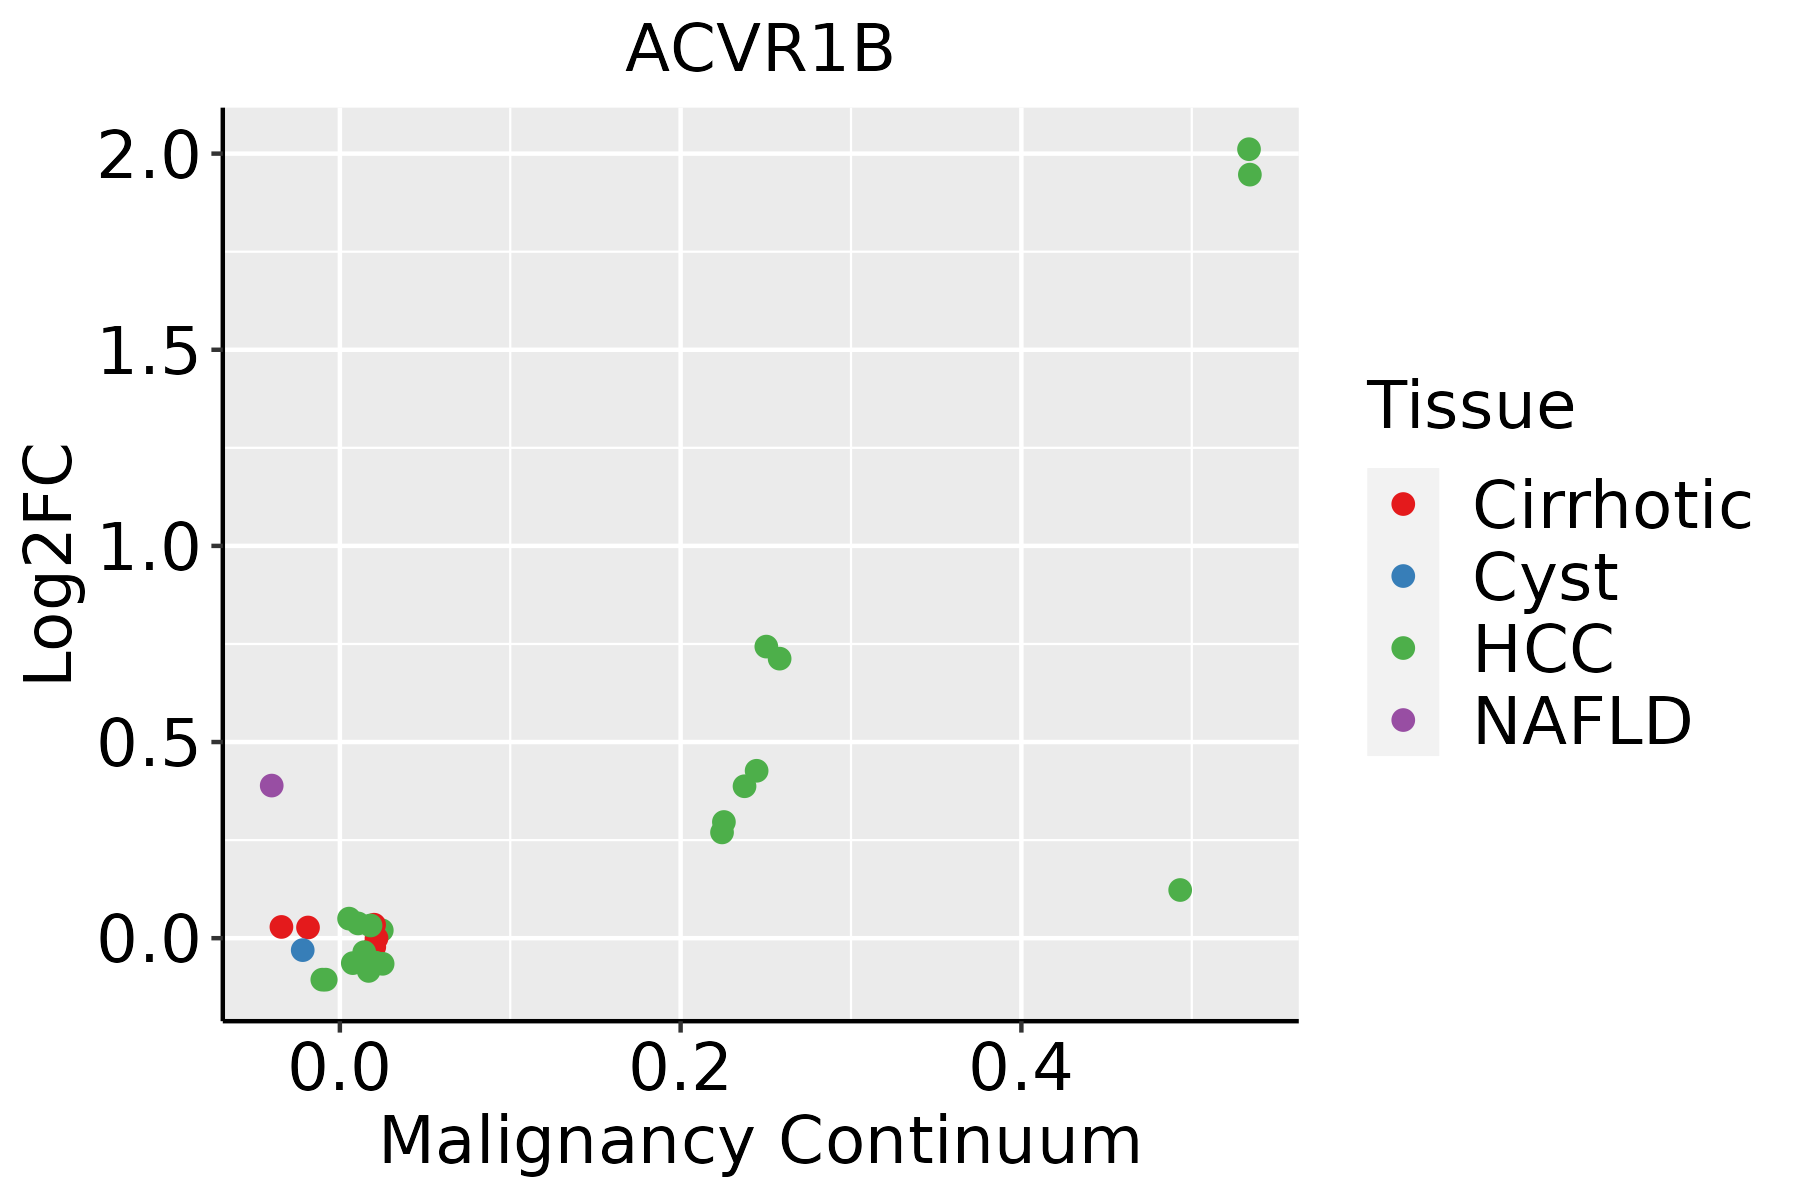 | HCC: Hepatocellular carcinoma |
| NAFLD: Non-alcoholic fatty liver disease |
| GO ID | Tissue | Disease Stage | Description | Gene Ratio | Bg Ratio | pvalue | p.adjust | Count |
| GO:0034101 | Colorectum | AD | erythrocyte homeostasis | 51/3918 | 129/18723 | 1.07e-06 | 3.59e-05 | 51 |
| GO:0030099 | Colorectum | AD | myeloid cell differentiation | 119/3918 | 381/18723 | 1.24e-06 | 4.01e-05 | 119 |
| GO:0016049 | Colorectum | AD | cell growth | 143/3918 | 482/18723 | 2.83e-06 | 8.09e-05 | 143 |
| GO:0002262 | Colorectum | AD | myeloid cell homeostasis | 57/3918 | 157/18723 | 6.17e-06 | 1.56e-04 | 57 |
| GO:0001558 | Colorectum | AD | regulation of cell growth | 124/3918 | 414/18723 | 7.67e-06 | 1.86e-04 | 124 |
| GO:0048872 | Colorectum | AD | homeostasis of number of cells | 87/3918 | 272/18723 | 1.16e-05 | 2.61e-04 | 87 |
| GO:0001667 | Colorectum | AD | ameboidal-type cell migration | 137/3918 | 475/18723 | 2.17e-05 | 4.33e-04 | 137 |
| GO:0030218 | Colorectum | AD | erythrocyte differentiation | 45/3918 | 120/18723 | 2.22e-05 | 4.39e-04 | 45 |
| GO:0001701 | Colorectum | AD | in utero embryonic development | 110/3918 | 367/18723 | 2.36e-05 | 4.62e-04 | 110 |
| GO:0046777 | Colorectum | AD | protein autophosphorylation | 74/3918 | 227/18723 | 2.48e-05 | 4.76e-04 | 74 |
| GO:0097191 | Colorectum | AD | extrinsic apoptotic signaling pathway | 68/3918 | 219/18723 | 2.64e-04 | 3.27e-03 | 68 |
| GO:0045646 | Colorectum | AD | regulation of erythrocyte differentiation | 20/3918 | 47/18723 | 6.54e-04 | 6.75e-03 | 20 |
| GO:0007178 | Colorectum | AD | transmembrane receptor protein serine/threonine kinase signaling pathway | 99/3918 | 355/18723 | 9.92e-04 | 9.28e-03 | 99 |
| GO:0018210 | Colorectum | AD | peptidyl-threonine modification | 40/3918 | 125/18723 | 2.44e-03 | 1.88e-02 | 40 |
| GO:1903706 | Colorectum | AD | regulation of hemopoiesis | 99/3918 | 367/18723 | 3.08e-03 | 2.28e-02 | 99 |
| GO:0045637 | Colorectum | AD | regulation of myeloid cell differentiation | 61/3918 | 210/18723 | 3.17e-03 | 2.35e-02 | 61 |
| GO:0018107 | Colorectum | AD | peptidyl-threonine phosphorylation | 37/3918 | 116/18723 | 3.68e-03 | 2.61e-02 | 37 |
| GO:0045926 | Colorectum | AD | negative regulation of growth | 70/3918 | 249/18723 | 4.07e-03 | 2.83e-02 | 70 |
| GO:0008544 | Colorectum | AD | epidermis development | 87/3918 | 324/18723 | 5.99e-03 | 3.76e-02 | 87 |
| GO:00160493 | Colorectum | FAP | cell growth | 112/2622 | 482/18723 | 2.40e-08 | 2.30e-06 | 112 |
| Hugo Symbol | Variant Class | Variant Classification | dbSNP RS | HGVSc | HGVSp | HGVSp Short | SWISSPROT | BIOTYPE | SIFT | PolyPhen | Tumor Sample Barcode | Tissue | Histology | Sex | Age | Stage | Therapy Types | Drugs | Outcome |
| ACVR1B | SNV | Missense_Mutation | | c.804N>G | p.Asp268Glu | p.D268E | P36896 | protein_coding | deleterious(0) | probably_damaging(0.996) | TCGA-A2-A04R-01 | Breast | breast invasive carcinoma | Female | <65 | I/II | Chemotherapy | taxol | SD |
| ACVR1B | SNV | Missense_Mutation | | c.1550N>A | p.Cys517Tyr | p.C517Y | P36896 | protein_coding | deleterious(0) | probably_damaging(0.997) | TCGA-A8-A08T-01 | Breast | breast invasive carcinoma | Female | <65 | III/IV | Unknown | Unknown | PD |
| ACVR1B | SNV | Missense_Mutation | rs534565647 | c.1021N>G | p.Thr341Ala | p.T341A | P36896 | protein_coding | deleterious(0.01) | benign(0.287) | TCGA-D8-A13Y-01 | Breast | breast invasive carcinoma | Female | <65 | I/II | Chemotherapy | doxorubicin | SD |
| ACVR1B | SNV | Missense_Mutation | | c.1035N>T | p.Met345Ile | p.M345I | P36896 | protein_coding | deleterious(0.02) | benign(0.373) | TCGA-E2-A159-01 | Breast | breast invasive carcinoma | Female | <65 | I/II | Chemotherapy | cyclophosphamide | SD |
| ACVR1B | SNV | Missense_Mutation | | c.1359N>C | p.Glu453Asp | p.E453D | P36896 | protein_coding | deleterious(0) | probably_damaging(0.997) | TCGA-E2-A159-01 | Breast | breast invasive carcinoma | Female | <65 | I/II | Chemotherapy | cyclophosphamide | SD |
| ACVR1B | SNV | Missense_Mutation | novel | c.1430C>G | p.Ser477Cys | p.S477C | P36896 | protein_coding | deleterious(0) | possibly_damaging(0.463) | TCGA-OL-A6VQ-01 | Breast | breast invasive carcinoma | Female | <65 | I/II | Unknown | Unknown | SD |
| ACVR1B | insertion | Frame_Shift_Ins | novel | c.51_52insGATTGGAAACCACTTAGACGGACTGGGTGGGGTGTGC | p.Leu18AspfsTer42 | p.L18Dfs*42 | P36896 | protein_coding | | | TCGA-AN-A04C-01 | Breast | breast invasive carcinoma | Female | <65 | I/II | Unknown | Unknown | SD |
| ACVR1B | insertion | Nonsense_Mutation | novel | c.271_272insTGTAAGTACACGCTGTGAGGTTCACACA | p.Arg91LeufsTer2 | p.R91Lfs*2 | P36896 | protein_coding | | | TCGA-BH-A0HF-01 | Breast | breast invasive carcinoma | Female | >=65 | I/II | Hormone Therapy | arimidex | SD |
| ACVR1B | insertion | Frame_Shift_Ins | novel | c.1570_1571insGTCTTAAGAGTGTTCAGGGGAACAGGCTT | p.Ala524GlyfsTer13 | p.A524Gfs*13 | P36896 | protein_coding | | | TCGA-BH-A0HK-01 | Breast | breast invasive carcinoma | Female | >=65 | I/II | Hormone Therapy | arimidex | SD |
| ACVR1B | SNV | Missense_Mutation | rs753911333 | c.1367N>A | p.Arg456Gln | p.R456Q | P36896 | protein_coding | deleterious(0) | possibly_damaging(0.526) | TCGA-DS-A1OB-01 | Cervix | cervical & endocervical cancer | Female | <65 | I/II | Chemotherapy | carboplatin | PD |
| Entrez ID | Symbol | Category | Interaction Types | Drug Claim Name | Drug Name | PMIDs |
| 91 | ACVR1B | SERINE THREONINE KINASE, CELL SURFACE, KINASE, ENZYME, DRUGGABLE GENOME, CLINICALLY ACTIONABLE | inhibitor | 249565824 | | |
| 91 | ACVR1B | SERINE THREONINE KINASE, CELL SURFACE, KINASE, ENZYME, DRUGGABLE GENOME, CLINICALLY ACTIONABLE | inhibitor | 249565787 | VACTOSERTIB | |
| 91 | ACVR1B | SERINE THREONINE KINASE, CELL SURFACE, KINASE, ENZYME, DRUGGABLE GENOME, CLINICALLY ACTIONABLE | inhibitor | 223366128 | GALUNISERTIB | |
| 91 | ACVR1B | SERINE THREONINE KINASE, CELL SURFACE, KINASE, ENZYME, DRUGGABLE GENOME, CLINICALLY ACTIONABLE | | US10030004, Compound 11a | | |
| 91 | ACVR1B | SERINE THREONINE KINASE, CELL SURFACE, KINASE, ENZYME, DRUGGABLE GENOME, CLINICALLY ACTIONABLE | inhibitor | 404859109 | | |
| 91 | ACVR1B | SERINE THREONINE KINASE, CELL SURFACE, KINASE, ENZYME, DRUGGABLE GENOME, CLINICALLY ACTIONABLE | | US10030004, Compound 19 | | |
| 91 | ACVR1B | SERINE THREONINE KINASE, CELL SURFACE, KINASE, ENZYME, DRUGGABLE GENOME, CLINICALLY ACTIONABLE | | BDBM108945 | | |
| 91 | ACVR1B | SERINE THREONINE KINASE, CELL SURFACE, KINASE, ENZYME, DRUGGABLE GENOME, CLINICALLY ACTIONABLE | | US9682983, 1 | | |
| 91 | ACVR1B | SERINE THREONINE KINASE, CELL SURFACE, KINASE, ENZYME, DRUGGABLE GENOME, CLINICALLY ACTIONABLE | | US10030004, Compound 33 | | |
| 91 | ACVR1B | SERINE THREONINE KINASE, CELL SURFACE, KINASE, ENZYME, DRUGGABLE GENOME, CLINICALLY ACTIONABLE | inhibitor | 249565800 | | |


