
|
|||||
|
 | |
| |
| |
| |
| |
| |
|
Gene: ACTR6 |
Gene summary for ACTR6 |
| Gene information | Species | Human | Gene symbol | ACTR6 | Gene ID | 64431 |
| Gene name | actin related protein 6 | |
| Gene Alias | ARP6 | |
| Cytomap | 12q23.1 | |
| Gene Type | protein-coding | GO ID | GO:0006325 | UniProtAcc | Q9GZN1 |
Top |
Malignant transformation analysis |
| Identification of the aberrant gene expression in precancerous and cancerous lesions by comparing the gene expression of stem-like cells in diseased tissues with normal stem cells |
| Entrez ID | Symbol | Replicates | Species | Organ | Tissue | Adj P-value | Log2FC | Malignancy |
| 64431 | ACTR6 | LZE4T | Human | Esophagus | ESCC | 3.25e-04 | 2.43e-01 | 0.0811 |
| 64431 | ACTR6 | LZE7T | Human | Esophagus | ESCC | 9.82e-06 | 4.47e-01 | 0.0667 |
| 64431 | ACTR6 | LZE8T | Human | Esophagus | ESCC | 5.16e-07 | 2.22e-01 | 0.067 |
| 64431 | ACTR6 | LZE20T | Human | Esophagus | ESCC | 7.36e-06 | 1.34e-01 | 0.0662 |
| 64431 | ACTR6 | LZE22T | Human | Esophagus | ESCC | 1.15e-02 | 3.15e-01 | 0.068 |
| 64431 | ACTR6 | LZE24T | Human | Esophagus | ESCC | 4.45e-13 | 2.55e-01 | 0.0596 |
| 64431 | ACTR6 | LZE6T | Human | Esophagus | ESCC | 9.41e-05 | 2.22e-01 | 0.0845 |
| 64431 | ACTR6 | P1T-E | Human | Esophagus | ESCC | 5.27e-06 | 2.91e-01 | 0.0875 |
| 64431 | ACTR6 | P2T-E | Human | Esophagus | ESCC | 1.78e-48 | 8.80e-01 | 0.1177 |
| 64431 | ACTR6 | P4T-E | Human | Esophagus | ESCC | 2.34e-31 | 6.49e-01 | 0.1323 |
| 64431 | ACTR6 | P5T-E | Human | Esophagus | ESCC | 1.60e-26 | 5.26e-01 | 0.1327 |
| 64431 | ACTR6 | P8T-E | Human | Esophagus | ESCC | 2.14e-24 | 3.90e-01 | 0.0889 |
| 64431 | ACTR6 | P9T-E | Human | Esophagus | ESCC | 1.06e-16 | 1.91e-01 | 0.1131 |
| 64431 | ACTR6 | P10T-E | Human | Esophagus | ESCC | 5.73e-28 | 3.33e-01 | 0.116 |
| 64431 | ACTR6 | P11T-E | Human | Esophagus | ESCC | 3.78e-10 | 5.11e-01 | 0.1426 |
| 64431 | ACTR6 | P12T-E | Human | Esophagus | ESCC | 3.22e-31 | 2.95e-01 | 0.1122 |
| 64431 | ACTR6 | P15T-E | Human | Esophagus | ESCC | 8.37e-26 | 4.25e-01 | 0.1149 |
| 64431 | ACTR6 | P16T-E | Human | Esophagus | ESCC | 2.23e-28 | 5.05e-01 | 0.1153 |
| 64431 | ACTR6 | P17T-E | Human | Esophagus | ESCC | 2.69e-03 | 1.95e-01 | 0.1278 |
| 64431 | ACTR6 | P19T-E | Human | Esophagus | ESCC | 1.17e-07 | 5.74e-01 | 0.1662 |
| Page: 1 2 3 4 5 6 |
| Tissue | Expression Dynamics | Abbreviation |
| Esophagus | 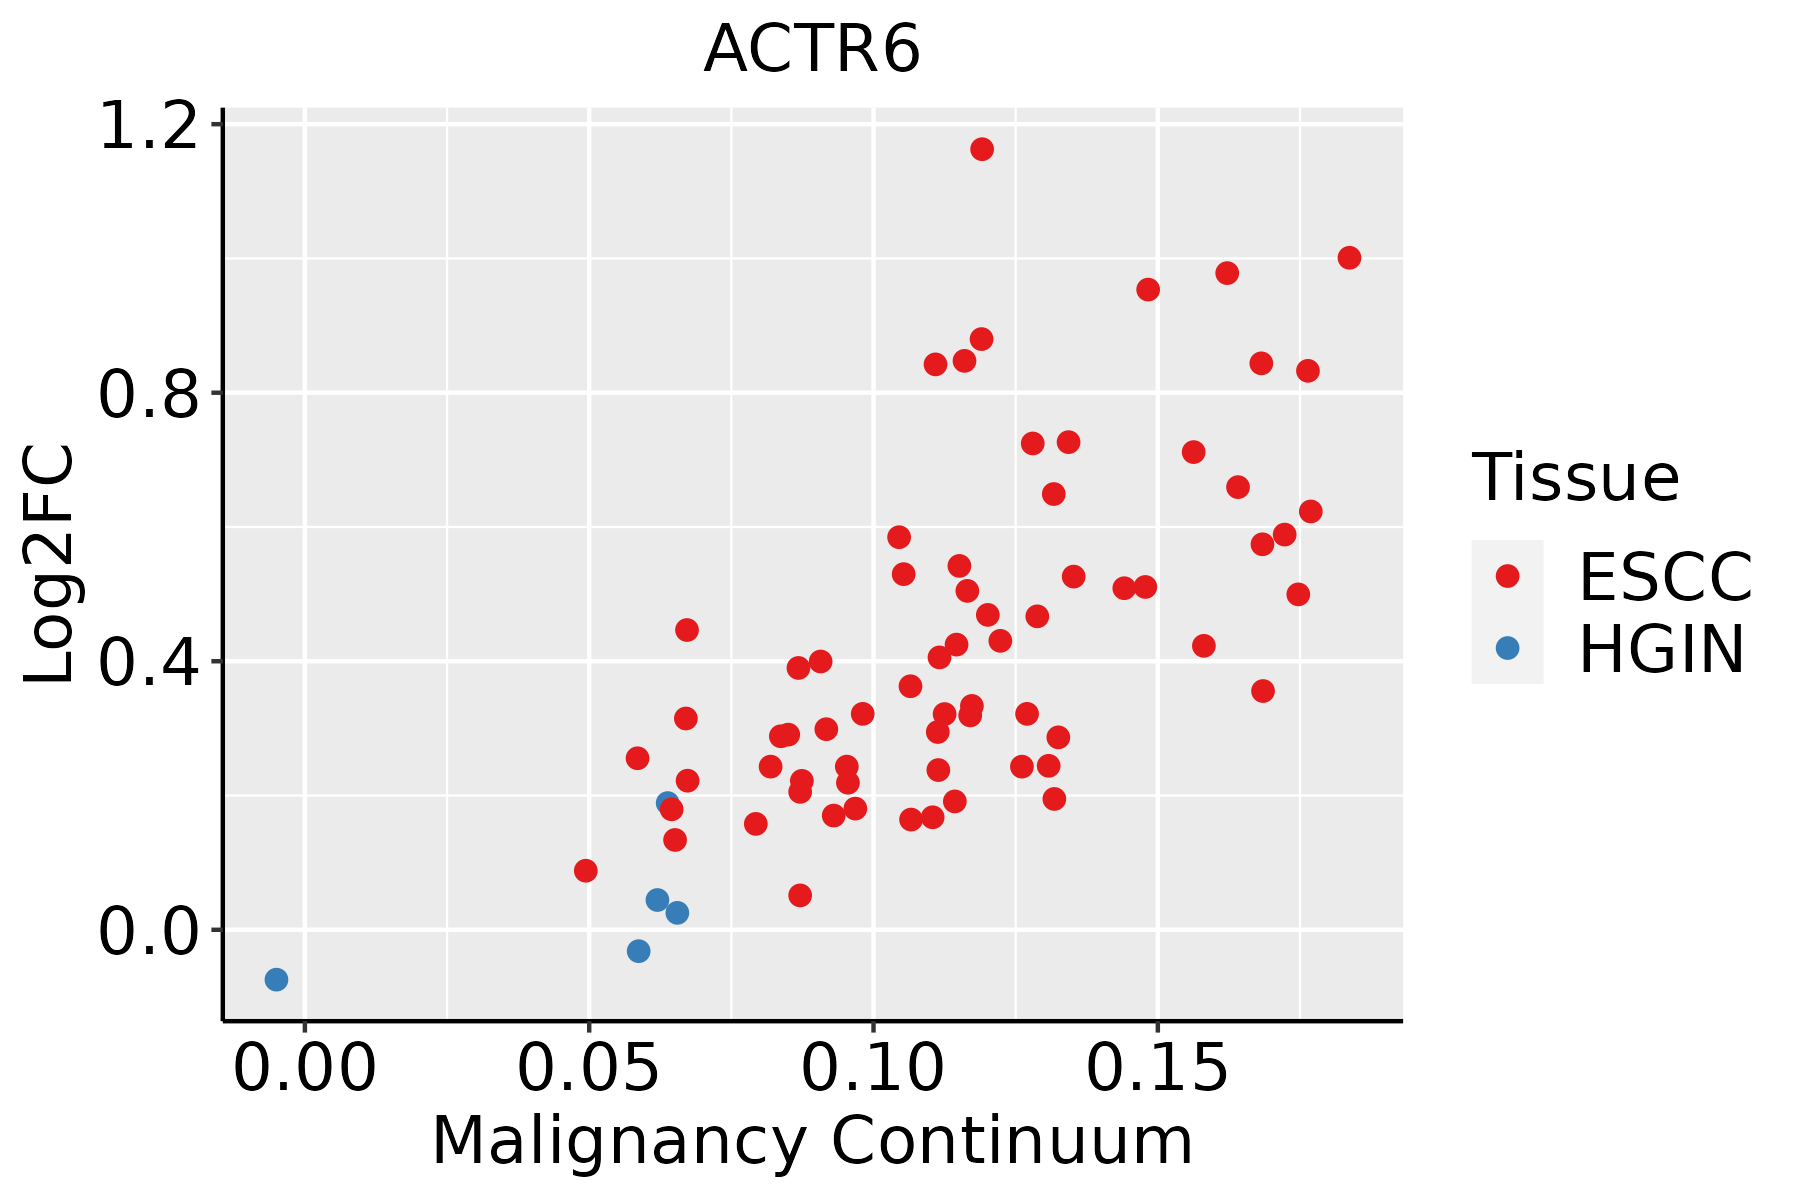 | ESCC: Esophageal squamous cell carcinoma |
| HGIN: High-grade intraepithelial neoplasias | ||
| LGIN: Low-grade intraepithelial neoplasias | ||
| Liver | 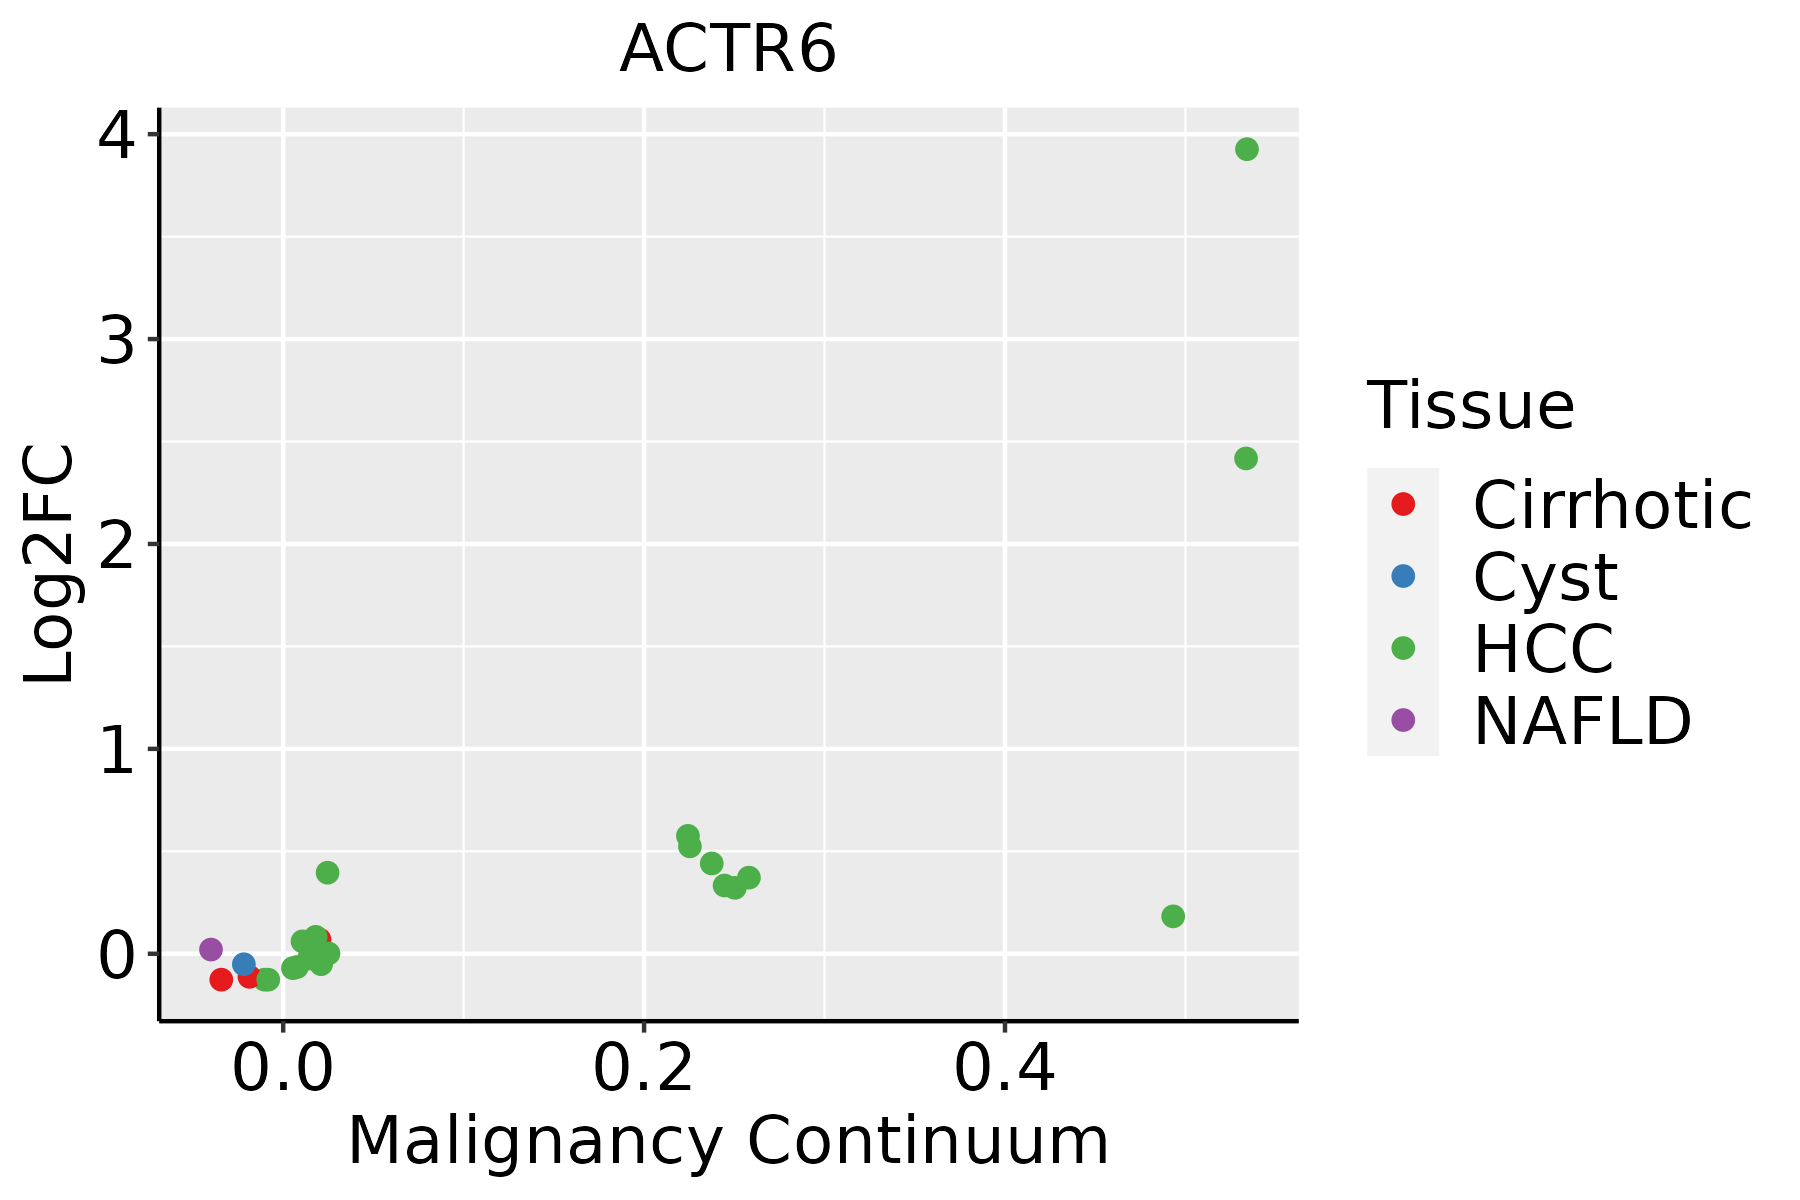 | HCC: Hepatocellular carcinoma |
| NAFLD: Non-alcoholic fatty liver disease | ||
| Oral Cavity | 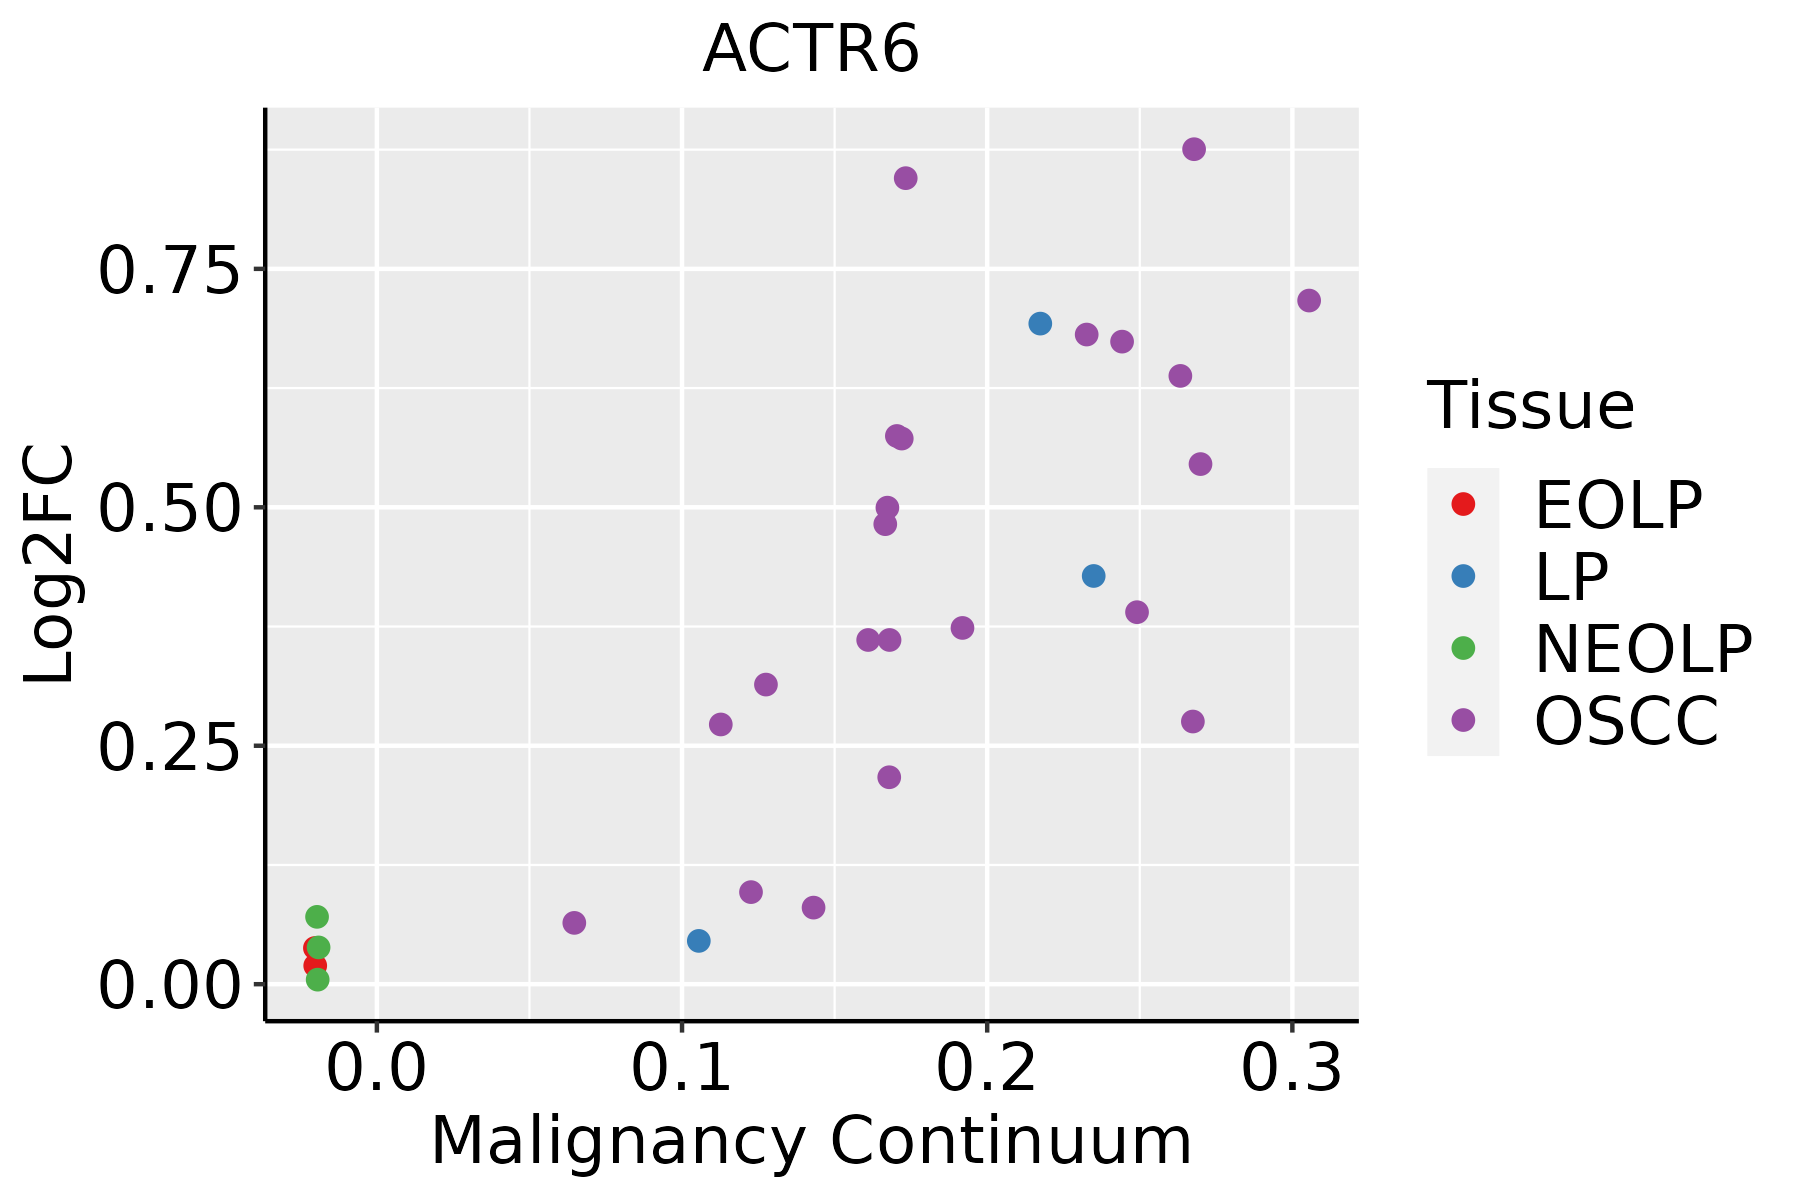 | EOLP: Erosive Oral lichen planus |
| LP: leukoplakia | ||
| NEOLP: Non-erosive oral lichen planus | ||
| OSCC: Oral squamous cell carcinoma | ||
| Skin | 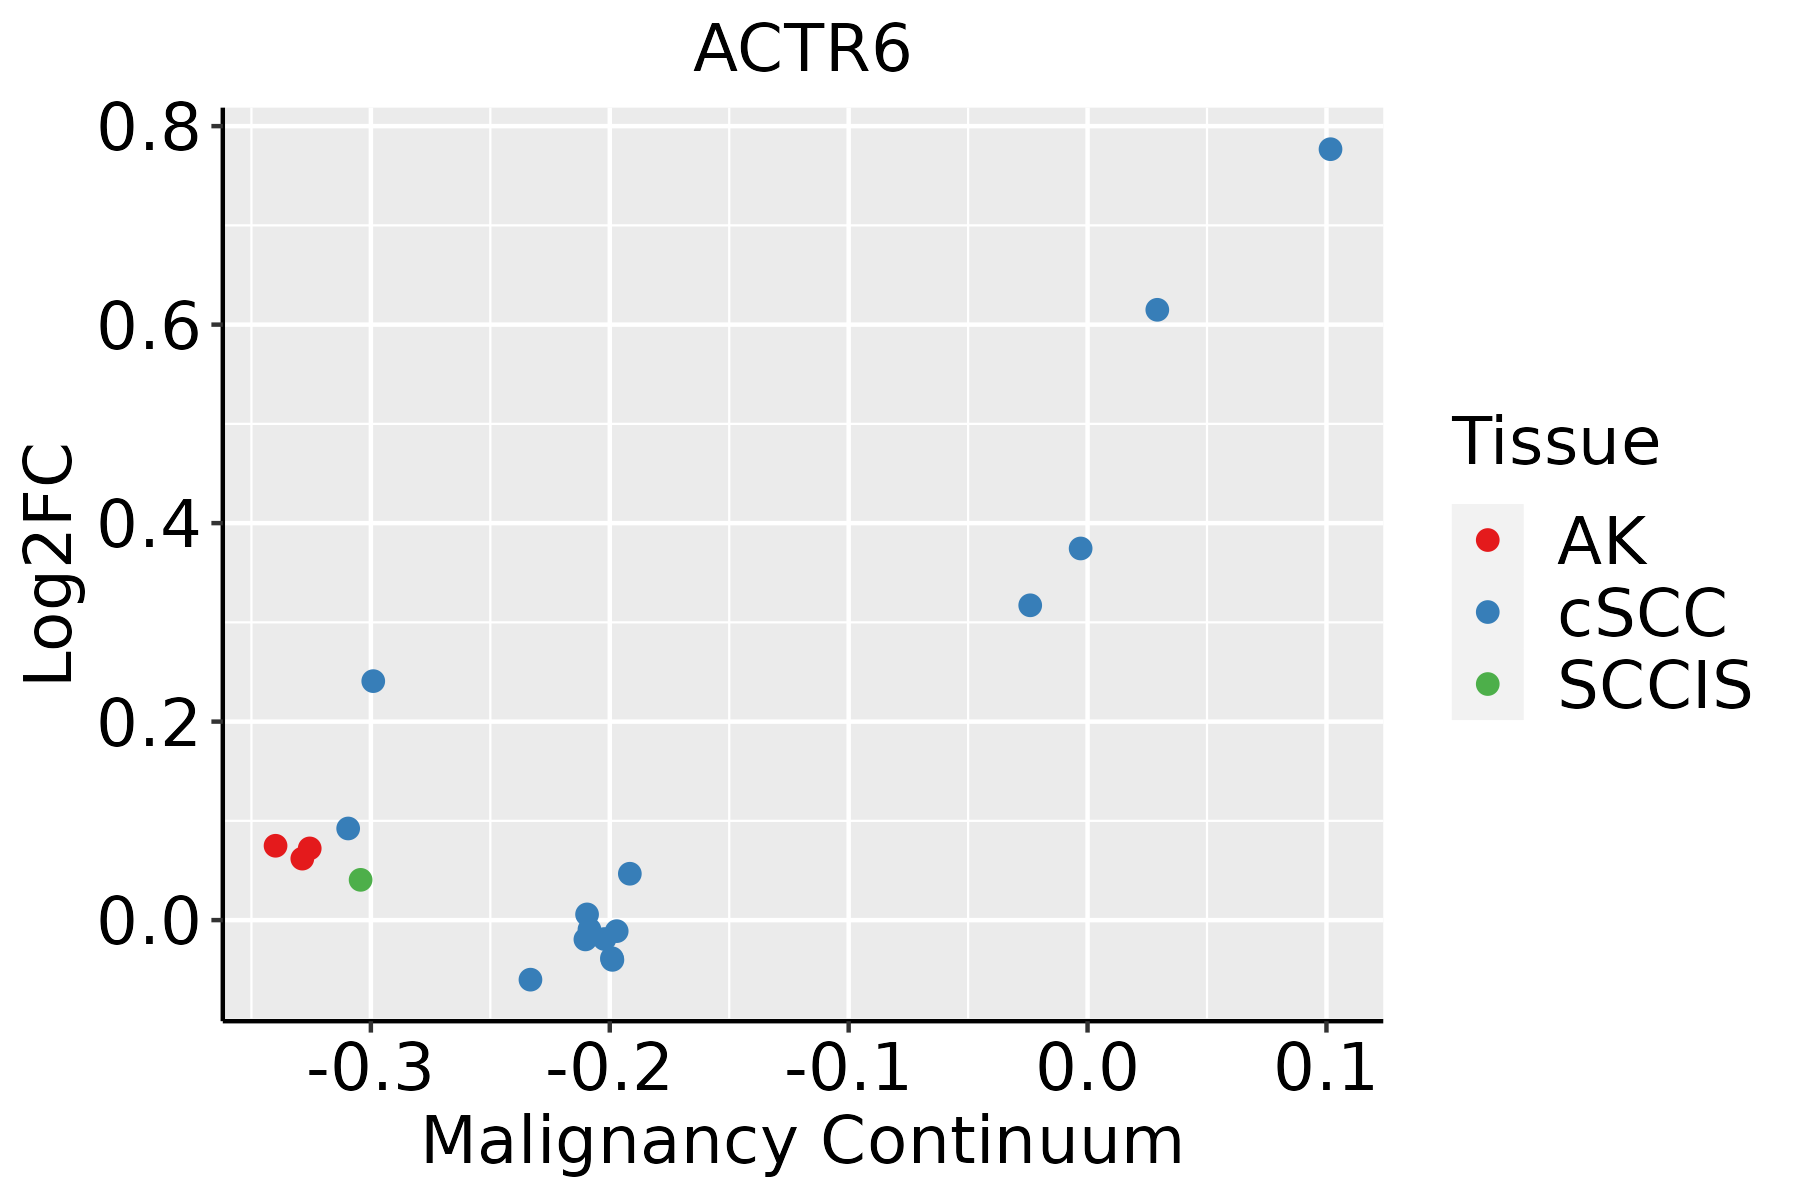 | AK: Actinic keratosis |
| cSCC: Cutaneous squamous cell carcinoma | ||
| SCCIS:squamous cell carcinoma in situ | ||
| Thyroid | 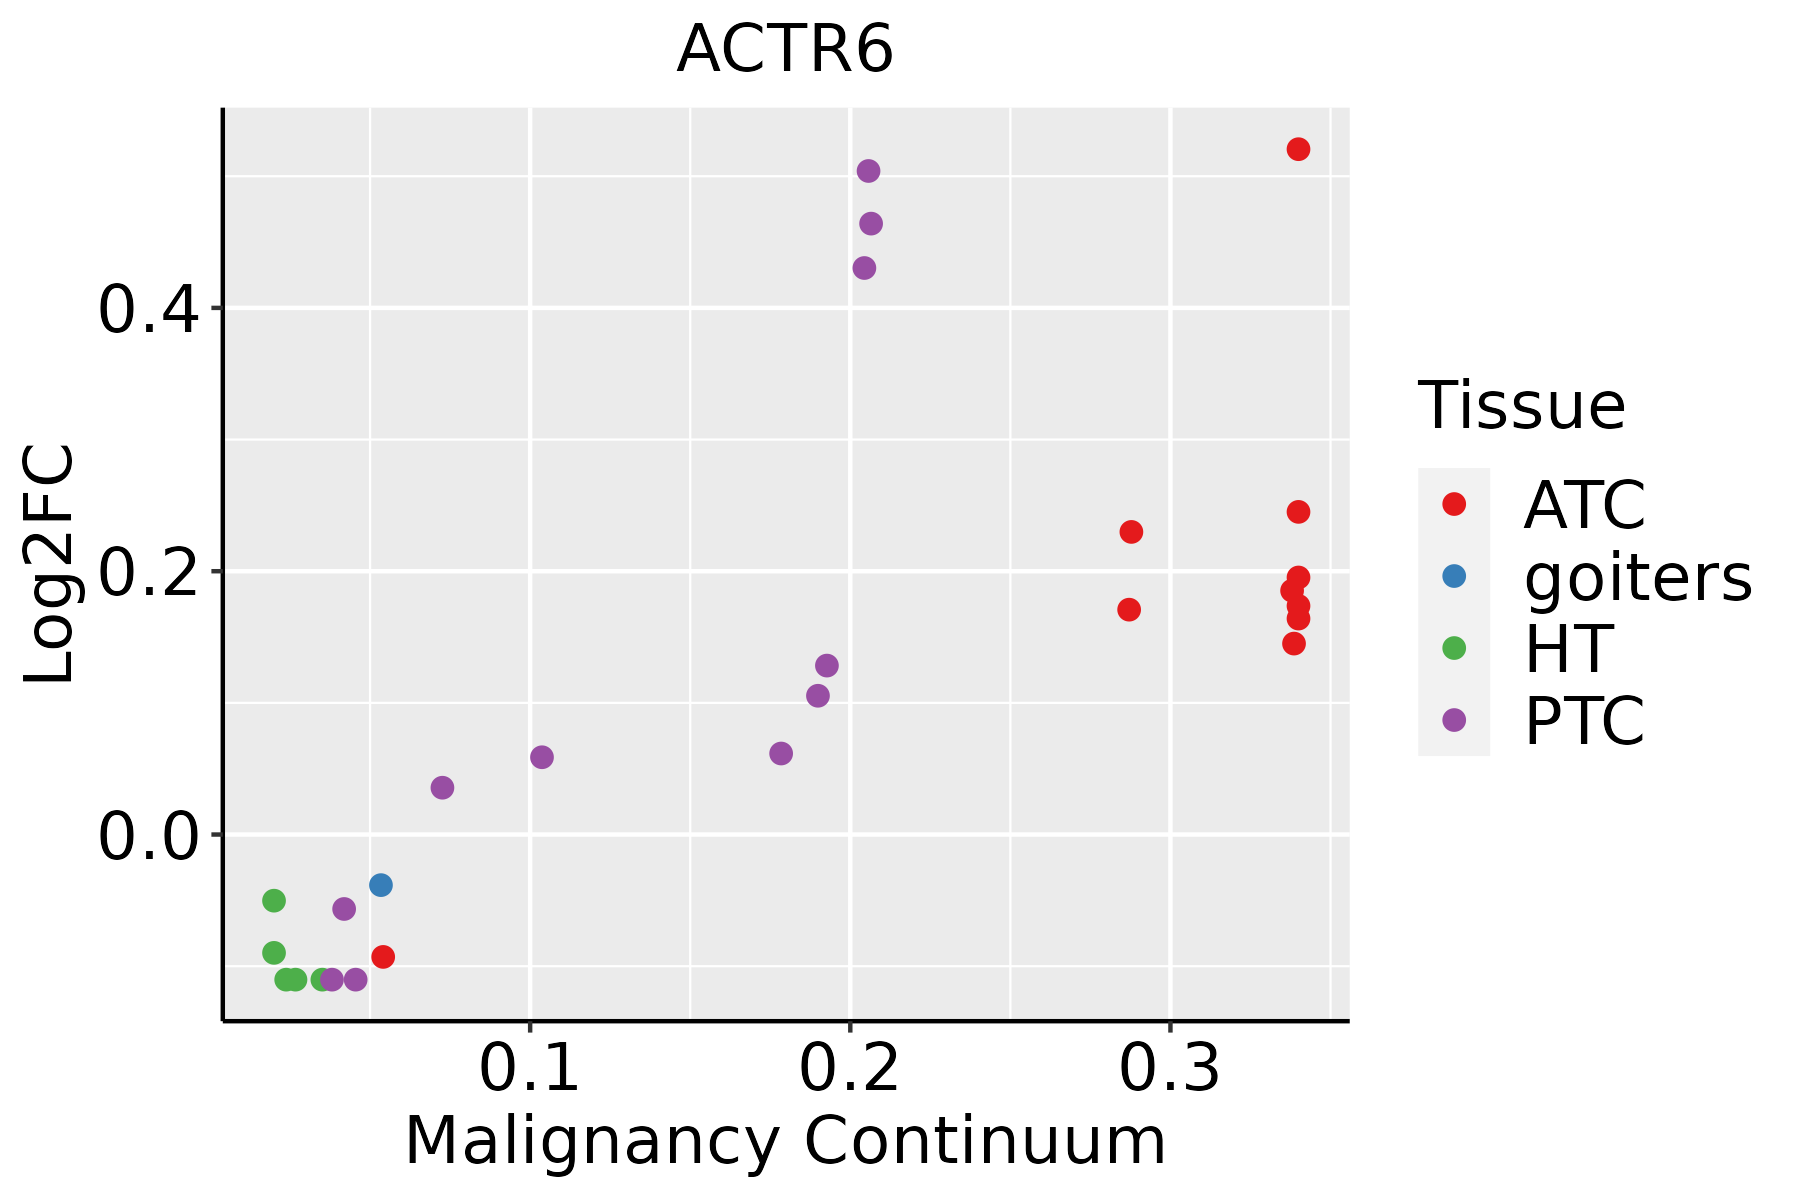 | ATC: Anaplastic thyroid cancer |
| HT: Hashimoto's thyroiditis | ||
| PTC: Papillary thyroid cancer |
| ∗log2FC in expression of this searched gene in stem-like cells from each diseased tissue sample relative to stem-like cells in normal samples in each tissue plotted against the malignancy continuum. Samples are colored based on if they are from different disease stage. |
Top |
Malignant transformation related pathway analysis |
| Find out the enriched GO biological processes and KEGG pathways involved in transition from healthy to precancer to cancer |
| Tissue | Disease Stage | Enriched GO biological Processes |
| Colorectum | AD |  |
| Colorectum | SER |  |
| Colorectum | MSS |  |
| Colorectum | MSI-H |  |
| Colorectum | FAP |  |
| ∗Top 15 enriched GO BP terms are showed in the bar plot of each disease state in each tissue. Each row represents a significant GO biological process which is colored according to the -log10(p.adjust). |
| Page: 1 2 3 4 5 6 7 8 9 |
| GO ID | Tissue | Disease Stage | Description | Gene Ratio | Bg Ratio | pvalue | p.adjust | Count |
| GO:000632517 | Esophagus | ESCC | chromatin organization | 240/8552 | 409/18723 | 6.52e-08 | 1.14e-06 | 240 |
| GO:0043486 | Esophagus | ESCC | histone exchange | 16/8552 | 22/18723 | 9.46e-03 | 3.28e-02 | 16 |
| GO:000632511 | Liver | HCC | chromatin organization | 206/7958 | 409/18723 | 7.23e-04 | 4.41e-03 | 206 |
| GO:000632510 | Oral cavity | OSCC | chromatin organization | 190/7305 | 409/18723 | 1.17e-03 | 5.97e-03 | 190 |
| GO:000632519 | Skin | cSCC | chromatin organization | 147/4864 | 409/18723 | 4.41e-06 | 6.52e-05 | 147 |
| GO:000633812 | Skin | cSCC | chromatin remodeling | 94/4864 | 255/18723 | 7.58e-05 | 7.26e-04 | 94 |
| GO:00718241 | Skin | cSCC | protein-DNA complex subunit organization | 87/4864 | 241/18723 | 3.09e-04 | 2.47e-03 | 87 |
| GO:00434861 | Skin | cSCC | histone exchange | 12/4864 | 22/18723 | 4.04e-03 | 2.15e-02 | 12 |
| GO:000632520 | Thyroid | PTC | chromatin organization | 183/5968 | 409/18723 | 2.55e-08 | 5.70e-07 | 183 |
| GO:00063385 | Thyroid | PTC | chromatin remodeling | 106/5968 | 255/18723 | 6.56e-04 | 4.13e-03 | 106 |
| GO:0006325110 | Thyroid | ATC | chromatin organization | 189/6293 | 409/18723 | 6.40e-08 | 1.13e-06 | 189 |
| GO:000633813 | Thyroid | ATC | chromatin remodeling | 109/6293 | 255/18723 | 1.38e-03 | 7.15e-03 | 109 |
| GO:00718242 | Thyroid | ATC | protein-DNA complex subunit organization | 103/6293 | 241/18723 | 1.84e-03 | 9.03e-03 | 103 |
| Page: 1 |
| Pathway ID | Tissue | Disease Stage | Description | Gene Ratio | Bg Ratio | pvalue | p.adjust | qvalue | Count |
| Page: 1 |
Top |
Cell-cell communication analysis |
| Identification of potential cell-cell interactions between two cell types and their ligand-receptor pairs for different disease states |
| Ligand | Receptor | LRpair | Pathway | Tissue | Disease Stage |
| Page: 1 |
Top |
Single-cell gene regulatory network inference analysis |
| Find out the significant the regulons (TFs) and the target genes of each regulon across cell types for different disease states |
| TF | Cell Type | Tissue | Disease Stage | Target Gene | RSS | Regulon Activity |
| ∗The dot plots of a searched regulon are shown for all cell subpopulations in each disease state of each tissue based on the regulon specific score inferred using pySCENIC and by calculating the average expression. |
| Page: 1 |
Top |
Somatic mutation of malignant transformation related genes |
| Annotation of somatic variants for genes involved in malignant transformation |
| Hugo Symbol | Variant Class | Variant Classification | dbSNP RS | HGVSc | HGVSp | HGVSp Short | SWISSPROT | BIOTYPE | SIFT | PolyPhen | Tumor Sample Barcode | Tissue | Histology | Sex | Age | Stage | Therapy Types | Drugs | Outcome |
| ACTR6 | SNV | Missense_Mutation | c.610N>G | p.Gln204Glu | p.Q204E | Q9GZN1 | protein_coding | tolerated(0.15) | probably_damaging(0.998) | TCGA-A2-A0YK-01 | Breast | breast invasive carcinoma | Female | <65 | I/II | Chemotherapy | cytoxan | SD | |
| ACTR6 | SNV | Missense_Mutation | rs375164278 | c.995N>A | p.Arg332Gln | p.R332Q | Q9GZN1 | protein_coding | deleterious(0) | probably_damaging(0.994) | TCGA-OL-A66P-01 | Breast | breast invasive carcinoma | Female | >=65 | I/II | Chemotherapy | cytoxan | CR |
| ACTR6 | deletion | In_Frame_Del | c.21_59delTAATGGAGCTTACAACGCCAAAATCGGTTACAGCCATGA | p.Asp7_His19del | p.D7_H19del | Q9GZN1 | protein_coding | TCGA-BH-A0BZ-01 | Breast | breast invasive carcinoma | Female | <65 | III/IV | Chemotherapy | doxorubicin | CR | |||
| ACTR6 | SNV | Missense_Mutation | rs747971263 | c.91N>T | p.Arg31Trp | p.R31W | Q9GZN1 | protein_coding | deleterious(0) | probably_damaging(0.985) | TCGA-2W-A8YY-01 | Cervix | cervical & endocervical cancer | Female | <65 | I/II | Chemotherapy | cisplatin | CR |
| ACTR6 | SNV | Missense_Mutation | c.1136G>A | p.Arg379Lys | p.R379K | Q9GZN1 | protein_coding | tolerated(0.47) | benign(0.063) | TCGA-JW-A5VL-01 | Cervix | cervical & endocervical cancer | Female | <65 | I/II | Unknown | Unknown | SD | |
| ACTR6 | SNV | Missense_Mutation | c.122N>A | p.Thr41Asn | p.T41N | Q9GZN1 | protein_coding | deleterious(0) | possibly_damaging(0.686) | TCGA-LP-A4AW-01 | Cervix | cervical & endocervical cancer | Female | <65 | I/II | Unknown | Unknown | SD | |
| ACTR6 | SNV | Missense_Mutation | novel | c.1162N>G | p.Ser388Gly | p.S388G | Q9GZN1 | protein_coding | tolerated(0.18) | benign(0.038) | TCGA-A6-6653-01 | Colorectum | colon adenocarcinoma | Male | >=65 | I/II | Unknown | Unknown | SD |
| ACTR6 | SNV | Missense_Mutation | c.704N>G | p.Asp235Gly | p.D235G | Q9GZN1 | protein_coding | deleterious(0) | probably_damaging(0.961) | TCGA-AD-6895-01 | Colorectum | colon adenocarcinoma | Male | >=65 | III/IV | Unknown | Unknown | SD | |
| ACTR6 | SNV | Missense_Mutation | rs745981618 | c.1013N>A | p.Arg338Gln | p.R338Q | Q9GZN1 | protein_coding | deleterious(0) | probably_damaging(1) | TCGA-AD-6899-01 | Colorectum | colon adenocarcinoma | Male | >=65 | III/IV | Unknown | Unknown | SD |
| ACTR6 | SNV | Missense_Mutation | rs756214514 | c.514N>T | p.Arg172Trp | p.R172W | Q9GZN1 | protein_coding | deleterious(0) | probably_damaging(1) | TCGA-AG-A002-01 | Colorectum | rectum adenocarcinoma | Male | <65 | I/II | Unknown | Unknown | SD |
| Page: 1 2 3 4 5 |
Top |
Related drugs of malignant transformation related genes |
| Identification of chemicals and drugs interact with genes involved in malignant transfromation |
| (DGIdb 4.0) |
| Entrez ID | Symbol | Category | Interaction Types | Drug Claim Name | Drug Name | PMIDs |
| Page: 1 |

Copyright 2023-Present -The University of Texas Health Science Center at Houston |