
|
|||||
|
 | |
| |
| |
| |
| |
| |
|
Gene: ACTR5 |
Gene summary for ACTR5 |
| Gene information | Species | Human | Gene symbol | ACTR5 | Gene ID | 79913 |
| Gene name | actin related protein 5 | |
| Gene Alias | Arp5 | |
| Cytomap | 20q11.23 | |
| Gene Type | protein-coding | GO ID | GO:0006139 | UniProtAcc | Q9H9F9 |
Top |
Malignant transformation analysis |
| Identification of the aberrant gene expression in precancerous and cancerous lesions by comparing the gene expression of stem-like cells in diseased tissues with normal stem cells |
| Entrez ID | Symbol | Replicates | Species | Organ | Tissue | Adj P-value | Log2FC | Malignancy |
| 79913 | ACTR5 | LZE24T | Human | Esophagus | ESCC | 5.67e-12 | 3.19e-01 | 0.0596 |
| 79913 | ACTR5 | P2T-E | Human | Esophagus | ESCC | 3.59e-10 | 1.68e-01 | 0.1177 |
| 79913 | ACTR5 | P4T-E | Human | Esophagus | ESCC | 6.59e-08 | 1.99e-01 | 0.1323 |
| 79913 | ACTR5 | P5T-E | Human | Esophagus | ESCC | 8.85e-05 | 1.22e-01 | 0.1327 |
| 79913 | ACTR5 | P8T-E | Human | Esophagus | ESCC | 1.61e-04 | 1.51e-01 | 0.0889 |
| 79913 | ACTR5 | P10T-E | Human | Esophagus | ESCC | 8.48e-13 | 1.85e-01 | 0.116 |
| 79913 | ACTR5 | P11T-E | Human | Esophagus | ESCC | 2.23e-03 | 1.51e-01 | 0.1426 |
| 79913 | ACTR5 | P12T-E | Human | Esophagus | ESCC | 8.25e-19 | 3.38e-01 | 0.1122 |
| 79913 | ACTR5 | P15T-E | Human | Esophagus | ESCC | 8.38e-15 | 2.84e-01 | 0.1149 |
| 79913 | ACTR5 | P16T-E | Human | Esophagus | ESCC | 5.56e-06 | 1.66e-01 | 0.1153 |
| 79913 | ACTR5 | P17T-E | Human | Esophagus | ESCC | 1.18e-02 | 1.96e-01 | 0.1278 |
| 79913 | ACTR5 | P20T-E | Human | Esophagus | ESCC | 3.22e-21 | 3.85e-01 | 0.1124 |
| 79913 | ACTR5 | P21T-E | Human | Esophagus | ESCC | 3.72e-17 | 4.06e-01 | 0.1617 |
| 79913 | ACTR5 | P22T-E | Human | Esophagus | ESCC | 1.65e-02 | 5.23e-02 | 0.1236 |
| 79913 | ACTR5 | P23T-E | Human | Esophagus | ESCC | 2.13e-08 | 2.31e-01 | 0.108 |
| 79913 | ACTR5 | P24T-E | Human | Esophagus | ESCC | 2.26e-07 | 1.87e-01 | 0.1287 |
| 79913 | ACTR5 | P26T-E | Human | Esophagus | ESCC | 3.36e-16 | 3.83e-01 | 0.1276 |
| 79913 | ACTR5 | P27T-E | Human | Esophagus | ESCC | 4.18e-06 | 1.39e-01 | 0.1055 |
| 79913 | ACTR5 | P28T-E | Human | Esophagus | ESCC | 4.89e-06 | 1.60e-01 | 0.1149 |
| 79913 | ACTR5 | P30T-E | Human | Esophagus | ESCC | 2.81e-03 | 1.37e-01 | 0.137 |
| Page: 1 2 3 |
| Tissue | Expression Dynamics | Abbreviation |
| Esophagus | 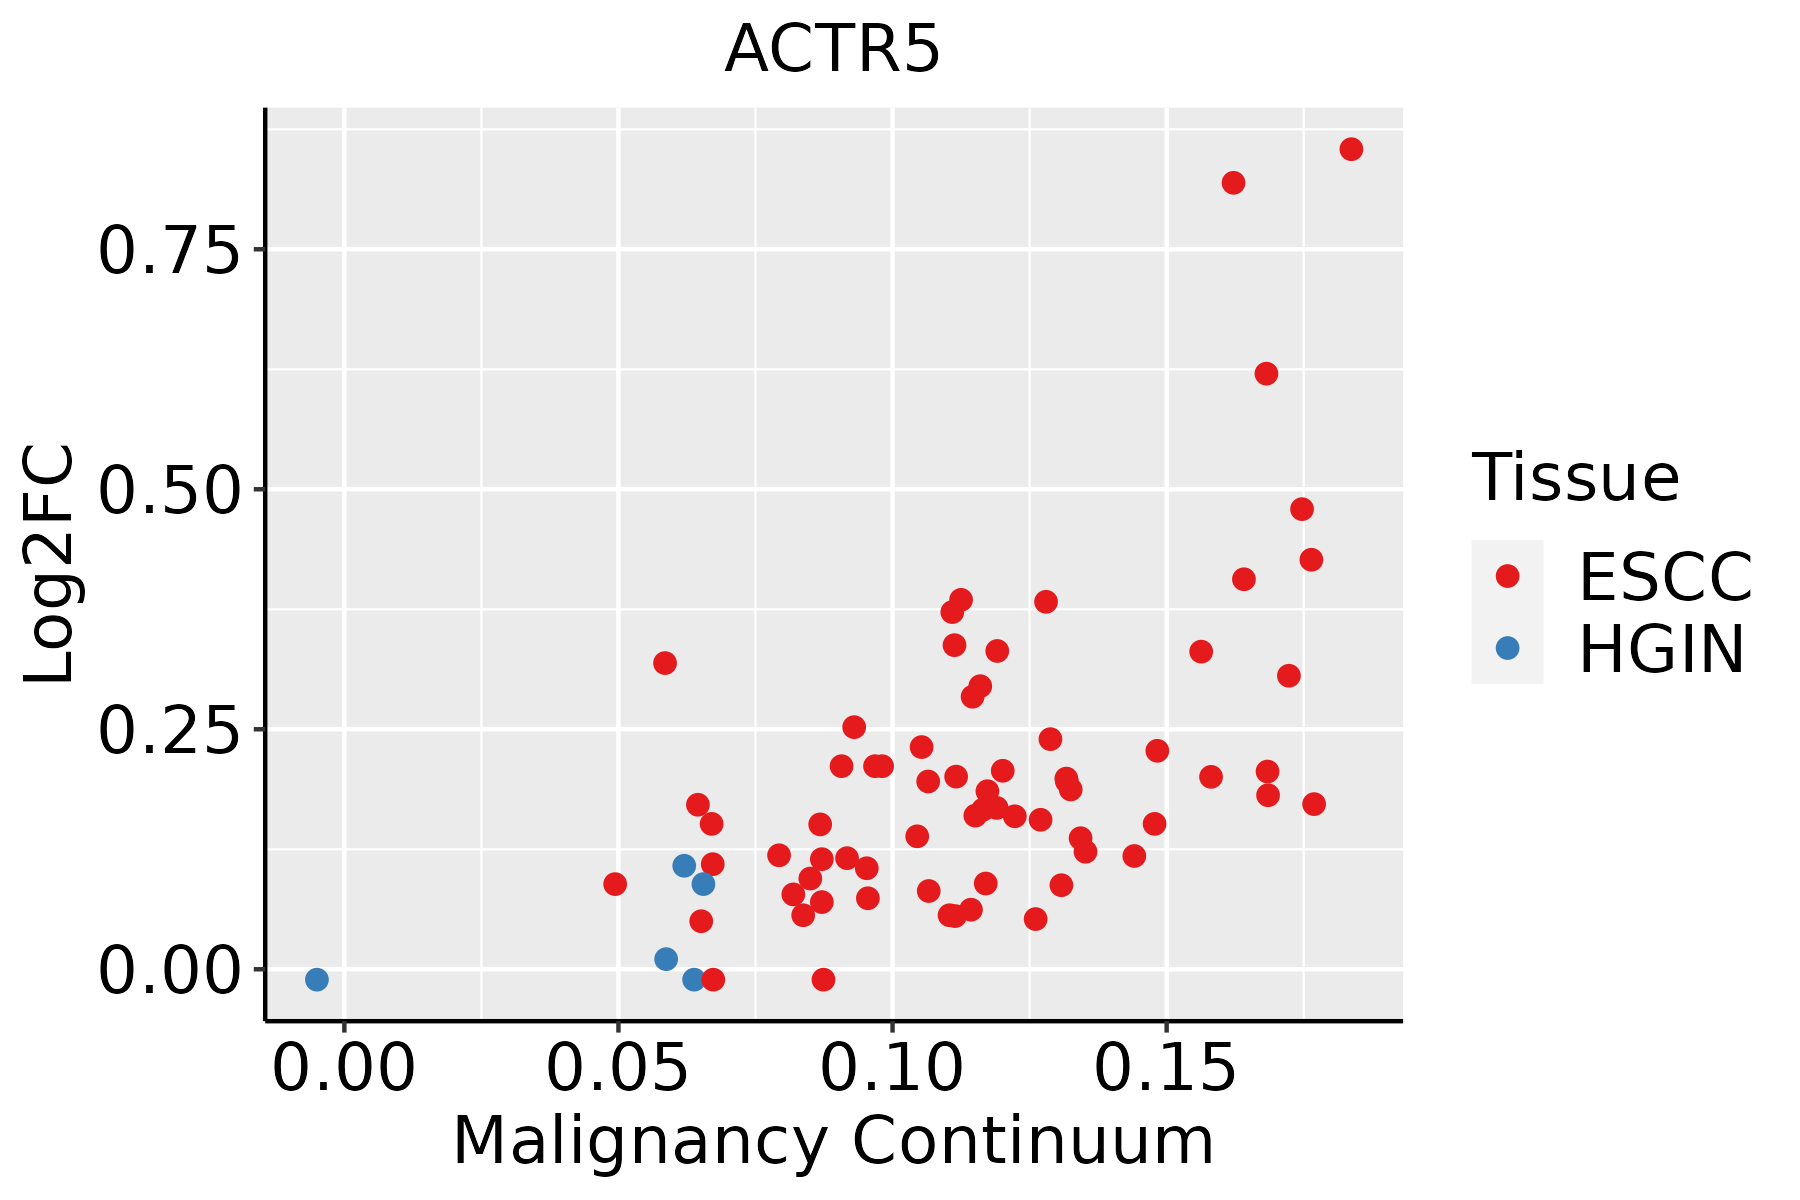 | ESCC: Esophageal squamous cell carcinoma |
| HGIN: High-grade intraepithelial neoplasias | ||
| LGIN: Low-grade intraepithelial neoplasias |
| ∗log2FC in expression of this searched gene in stem-like cells from each diseased tissue sample relative to stem-like cells in normal samples in each tissue plotted against the malignancy continuum. Samples are colored based on if they are from different disease stage. |
Top |
Malignant transformation related pathway analysis |
| Find out the enriched GO biological processes and KEGG pathways involved in transition from healthy to precancer to cancer |
| Tissue | Disease Stage | Enriched GO biological Processes |
| Colorectum | AD |  |
| Colorectum | SER |  |
| Colorectum | MSS |  |
| Colorectum | MSI-H |  |
| Colorectum | FAP |  |
| ∗Top 15 enriched GO BP terms are showed in the bar plot of each disease state in each tissue. Each row represents a significant GO biological process which is colored according to the -log10(p.adjust). |
| Page: 1 2 3 4 5 6 7 8 9 |
| GO ID | Tissue | Disease Stage | Description | Gene Ratio | Bg Ratio | pvalue | p.adjust | Count |
| GO:000941113 | Esophagus | ESCC | response to UV | 115/8552 | 149/18723 | 3.29e-15 | 1.93e-13 | 115 |
| GO:000931419 | Esophagus | ESCC | response to radiation | 277/8552 | 456/18723 | 4.42e-11 | 1.43e-09 | 277 |
| GO:003464413 | Esophagus | ESCC | cellular response to UV | 70/8552 | 90/18723 | 4.59e-10 | 1.20e-08 | 70 |
| GO:007121419 | Esophagus | ESCC | cellular response to abiotic stimulus | 206/8552 | 331/18723 | 7.52e-10 | 1.88e-08 | 206 |
| GO:010400419 | Esophagus | ESCC | cellular response to environmental stimulus | 206/8552 | 331/18723 | 7.52e-10 | 1.88e-08 | 206 |
| GO:007147816 | Esophagus | ESCC | cellular response to radiation | 122/8552 | 186/18723 | 3.07e-08 | 5.73e-07 | 122 |
| GO:000632517 | Esophagus | ESCC | chromatin organization | 240/8552 | 409/18723 | 6.52e-08 | 1.14e-06 | 240 |
| GO:00063024 | Esophagus | ESCC | double-strand break repair | 152/8552 | 251/18723 | 1.33e-06 | 1.62e-05 | 152 |
| GO:000941611 | Esophagus | ESCC | response to light stimulus | 183/8552 | 320/18723 | 2.03e-05 | 1.76e-04 | 183 |
| GO:00714821 | Esophagus | ESCC | cellular response to light stimulus | 75/8552 | 123/18723 | 4.45e-04 | 2.50e-03 | 75 |
| GO:00063101 | Esophagus | ESCC | DNA recombination | 168/8552 | 305/18723 | 5.58e-04 | 3.05e-03 | 168 |
| Page: 1 |
| Pathway ID | Tissue | Disease Stage | Description | Gene Ratio | Bg Ratio | pvalue | p.adjust | qvalue | Count |
| Page: 1 |
Top |
Cell-cell communication analysis |
| Identification of potential cell-cell interactions between two cell types and their ligand-receptor pairs for different disease states |
| Ligand | Receptor | LRpair | Pathway | Tissue | Disease Stage |
| Page: 1 |
Top |
Single-cell gene regulatory network inference analysis |
| Find out the significant the regulons (TFs) and the target genes of each regulon across cell types for different disease states |
| TF | Cell Type | Tissue | Disease Stage | Target Gene | RSS | Regulon Activity |
| ∗The dot plots of a searched regulon are shown for all cell subpopulations in each disease state of each tissue based on the regulon specific score inferred using pySCENIC and by calculating the average expression. |
| Page: 1 |
Top |
Somatic mutation of malignant transformation related genes |
| Annotation of somatic variants for genes involved in malignant transformation |
| Hugo Symbol | Variant Class | Variant Classification | dbSNP RS | HGVSc | HGVSp | HGVSp Short | SWISSPROT | BIOTYPE | SIFT | PolyPhen | Tumor Sample Barcode | Tissue | Histology | Sex | Age | Stage | Therapy Types | Drugs | Outcome |
| ACTR5 | SNV | Missense_Mutation | rs765426755 | c.467N>G | p.Tyr156Cys | p.Y156C | Q9H9F9 | protein_coding | deleterious(0) | probably_damaging(0.911) | TCGA-AN-A046-01 | Breast | breast invasive carcinoma | Female | >=65 | I/II | Unknown | Unknown | SD |
| ACTR5 | SNV | Missense_Mutation | rs746336224 | c.911N>A | p.Arg304Gln | p.R304Q | Q9H9F9 | protein_coding | deleterious(0) | probably_damaging(0.998) | TCGA-BH-A18G-01 | Breast | breast invasive carcinoma | Female | >=65 | I/II | Unknown | Unknown | SD |
| ACTR5 | SNV | Missense_Mutation | c.1509G>T | p.Met503Ile | p.M503I | Q9H9F9 | protein_coding | tolerated(0.24) | benign(0.003) | TCGA-C8-A1HM-01 | Breast | breast invasive carcinoma | Female | >=65 | I/II | Chemotherapy | doxorubicin | CR | |
| ACTR5 | SNV | Missense_Mutation | rs372463725 | c.594N>G | p.Ile198Met | p.I198M | Q9H9F9 | protein_coding | deleterious(0) | possibly_damaging(0.5) | TCGA-D8-A27G-01 | Breast | breast invasive carcinoma | Female | >=65 | I/II | Unknown | Unknown | SD |
| ACTR5 | insertion | Nonsense_Mutation | novel | c.1092_1093insCCTGCGCCCAGCTGGTATTGACTTTAATTGTTGTGTT | p.Ser365ProfsTer7 | p.S365Pfs*7 | Q9H9F9 | protein_coding | TCGA-A8-A07W-01 | Breast | breast invasive carcinoma | Female | >=65 | III/IV | Hormone Therapy | exemestane | SD | ||
| ACTR5 | SNV | Missense_Mutation | novel | c.434N>A | p.Arg145Gln | p.R145Q | Q9H9F9 | protein_coding | deleterious(0) | probably_damaging(0.933) | TCGA-2W-A8YY-01 | Cervix | cervical & endocervical cancer | Female | <65 | I/II | Chemotherapy | cisplatin | CR |
| ACTR5 | SNV | Missense_Mutation | c.491G>A | p.Gly164Glu | p.G164E | Q9H9F9 | protein_coding | deleterious(0) | probably_damaging(0.987) | TCGA-JX-A3Q0-01 | Cervix | cervical & endocervical cancer | Female | <65 | III/IV | Unknown | Unknown | SD | |
| ACTR5 | SNV | Missense_Mutation | c.385N>A | p.Asp129Asn | p.D129N | Q9H9F9 | protein_coding | tolerated(0.23) | possibly_damaging(0.673) | TCGA-AA-3510-01 | Colorectum | colon adenocarcinoma | Male | >=65 | I/II | Unknown | Unknown | SD | |
| ACTR5 | SNV | Missense_Mutation | c.1443N>T | p.Lys481Asn | p.K481N | Q9H9F9 | protein_coding | tolerated(0.25) | benign(0.373) | TCGA-AA-3811-01 | Colorectum | colon adenocarcinoma | Female | >=65 | III/IV | Unknown | Unknown | PD | |
| ACTR5 | SNV | Missense_Mutation | c.531G>T | p.Lys177Asn | p.K177N | Q9H9F9 | protein_coding | tolerated(0.28) | benign(0.007) | TCGA-AA-3984-01 | Colorectum | colon adenocarcinoma | Female | <65 | I/II | Unknown | Unknown | SD |
| Page: 1 2 3 4 5 6 |
Top |
Related drugs of malignant transformation related genes |
| Identification of chemicals and drugs interact with genes involved in malignant transfromation |
| (DGIdb 4.0) |
| Entrez ID | Symbol | Category | Interaction Types | Drug Claim Name | Drug Name | PMIDs |
| Page: 1 |

Copyright 2023-Present -The University of Texas Health Science Center at Houston |