
|
|||||
|
 | |
| |
| |
| |
| |
| |
|
Gene: ACTR3C |
Gene summary for ACTR3C |
| Gene information | Species | Human | Gene symbol | ACTR3C | Gene ID | 653857 |
| Gene name | actin related protein 3C | |
| Gene Alias | ARP11 | |
| Cytomap | 7q36.1 | |
| Gene Type | protein-coding | GO ID | GO:0008150 | UniProtAcc | Q9C0K3 |
Top |
Malignant transformation analysis |
| Identification of the aberrant gene expression in precancerous and cancerous lesions by comparing the gene expression of stem-like cells in diseased tissues with normal stem cells |
| Entrez ID | Symbol | Replicates | Species | Organ | Tissue | Adj P-value | Log2FC | Malignancy |
| 653857 | ACTR3C | HTA11_347_2000001011 | Human | Colorectum | AD | 7.02e-04 | 3.06e-01 | -0.1954 |
| 653857 | ACTR3C | HTA11_99999970781_79442 | Human | Colorectum | MSS | 3.44e-07 | -3.67e-01 | 0.294 |
| 653857 | ACTR3C | F007 | Human | Colorectum | FAP | 3.60e-03 | -4.50e-01 | 0.1176 |
| 653857 | ACTR3C | A002-C-010 | Human | Colorectum | FAP | 4.29e-02 | -1.31e-01 | 0.242 |
| 653857 | ACTR3C | A001-C-207 | Human | Colorectum | FAP | 3.40e-03 | -3.58e-01 | 0.1278 |
| 653857 | ACTR3C | A015-C-203 | Human | Colorectum | FAP | 1.75e-31 | -5.16e-01 | -0.1294 |
| 653857 | ACTR3C | A015-C-204 | Human | Colorectum | FAP | 4.42e-03 | -2.45e-01 | -0.0228 |
| 653857 | ACTR3C | A014-C-040 | Human | Colorectum | FAP | 2.17e-02 | -4.41e-01 | -0.1184 |
| 653857 | ACTR3C | A002-C-201 | Human | Colorectum | FAP | 1.50e-12 | -4.36e-01 | 0.0324 |
| 653857 | ACTR3C | A002-C-203 | Human | Colorectum | FAP | 6.21e-04 | -5.71e-02 | 0.2786 |
| 653857 | ACTR3C | A001-C-119 | Human | Colorectum | FAP | 1.27e-05 | -4.98e-01 | -0.1557 |
| 653857 | ACTR3C | A001-C-108 | Human | Colorectum | FAP | 1.32e-23 | -5.01e-01 | -0.0272 |
| 653857 | ACTR3C | A002-C-205 | Human | Colorectum | FAP | 1.50e-19 | -5.51e-01 | -0.1236 |
| 653857 | ACTR3C | A001-C-104 | Human | Colorectum | FAP | 1.68e-06 | -3.24e-01 | 0.0184 |
| 653857 | ACTR3C | A015-C-005 | Human | Colorectum | FAP | 2.37e-03 | -3.46e-01 | -0.0336 |
| 653857 | ACTR3C | A015-C-006 | Human | Colorectum | FAP | 9.53e-14 | -5.89e-01 | -0.0994 |
| 653857 | ACTR3C | A015-C-106 | Human | Colorectum | FAP | 9.77e-14 | -3.01e-01 | -0.0511 |
| 653857 | ACTR3C | A002-C-114 | Human | Colorectum | FAP | 1.38e-16 | -5.42e-01 | -0.1561 |
| 653857 | ACTR3C | A015-C-104 | Human | Colorectum | FAP | 1.84e-32 | -5.90e-01 | -0.1899 |
| 653857 | ACTR3C | A001-C-014 | Human | Colorectum | FAP | 2.03e-20 | -5.09e-01 | 0.0135 |
| Page: 1 2 3 4 |
| Tissue | Expression Dynamics | Abbreviation |
| Colorectum (GSE201348) |  | FAP: Familial adenomatous polyposis |
| CRC: Colorectal cancer | ||
| Colorectum (HTA11) |  | AD: Adenomas |
| SER: Sessile serrated lesions | ||
| MSI-H: Microsatellite-high colorectal cancer | ||
| MSS: Microsatellite stable colorectal cancer | ||
| Esophagus |  | ESCC: Esophageal squamous cell carcinoma |
| HGIN: High-grade intraepithelial neoplasias | ||
| LGIN: Low-grade intraepithelial neoplasias | ||
| Lung | 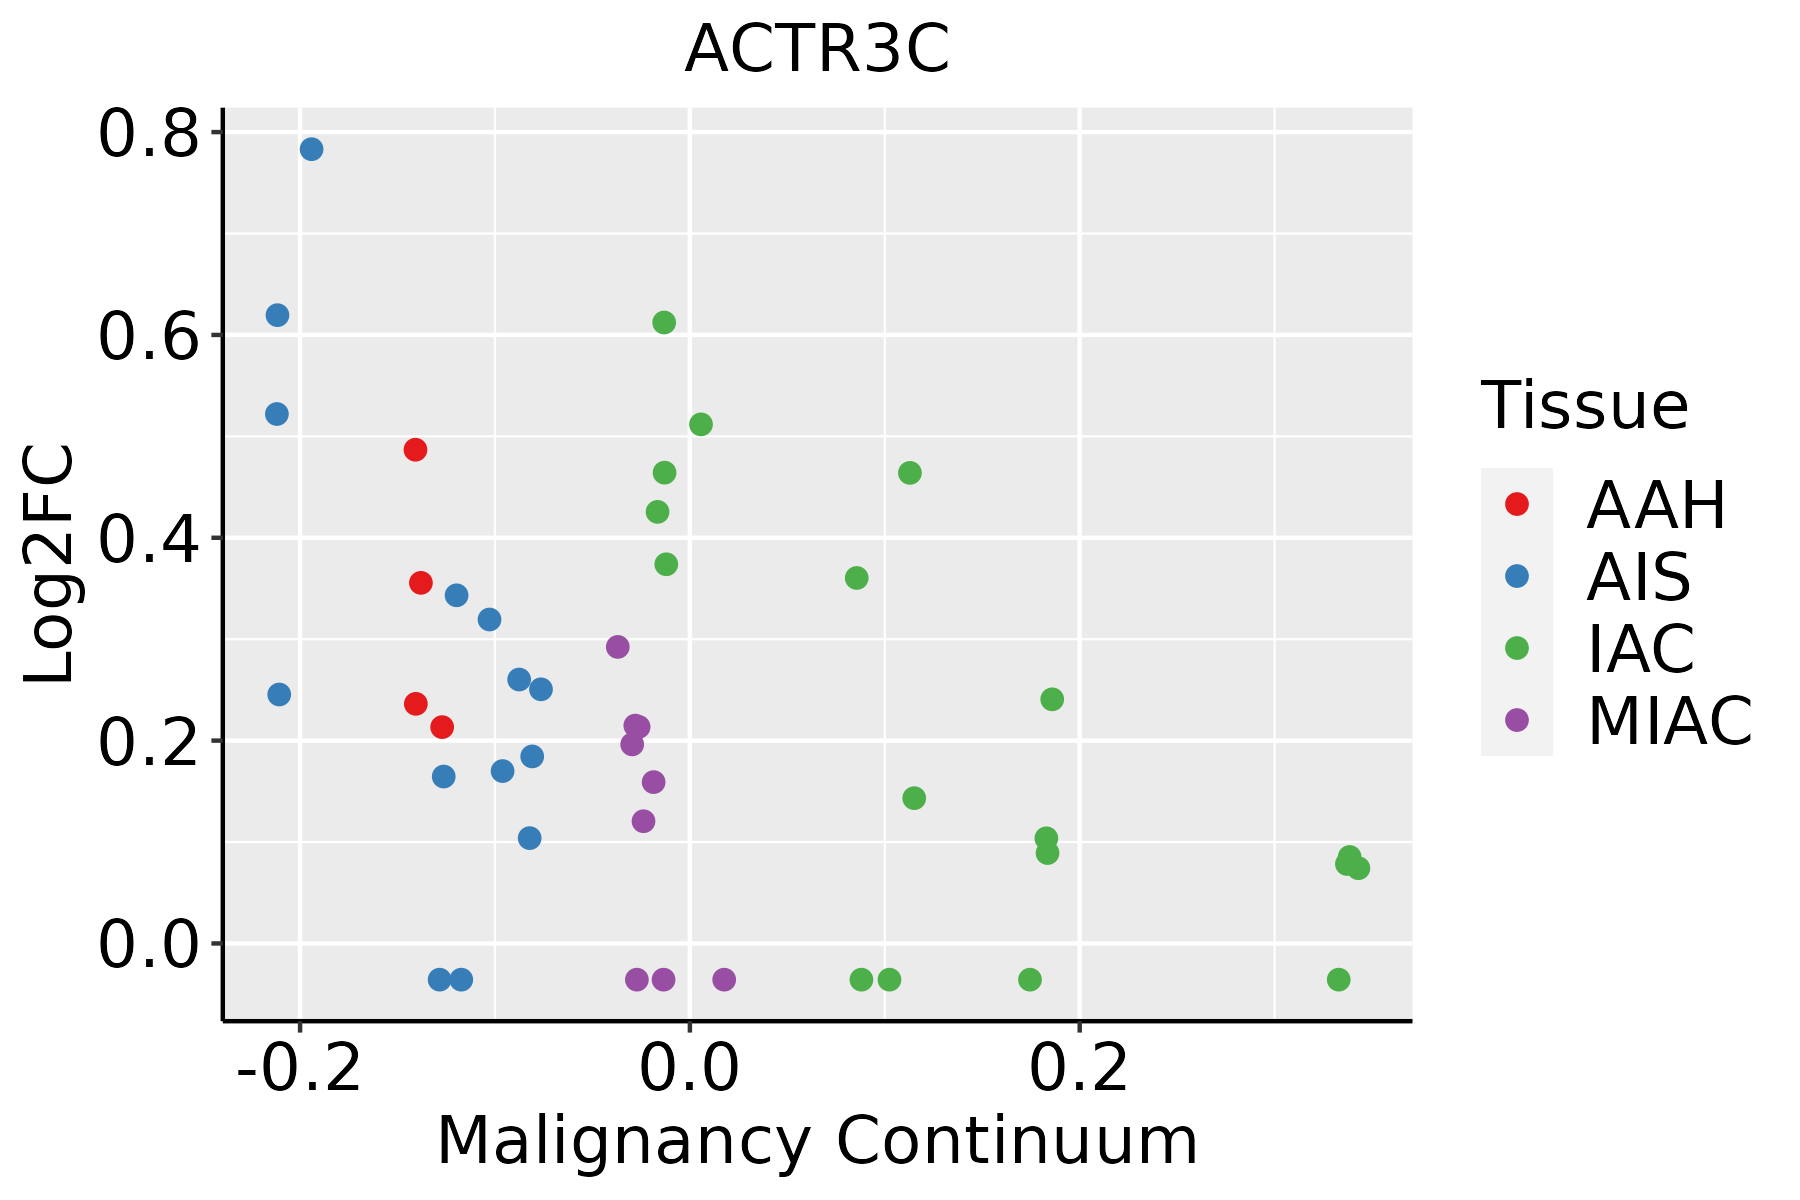 | AAH: Atypical adenomatous hyperplasia |
| AIS: Adenocarcinoma in situ | ||
| IAC: Invasive lung adenocarcinoma | ||
| MIA: Minimally invasive adenocarcinoma |
| ∗log2FC in expression of this searched gene in stem-like cells from each diseased tissue sample relative to stem-like cells in normal samples in each tissue plotted against the malignancy continuum. Samples are colored based on if they are from different disease stage. |
Top |
Malignant transformation related pathway analysis |
| Find out the enriched GO biological processes and KEGG pathways involved in transition from healthy to precancer to cancer |
| Tissue | Disease Stage | Enriched GO biological Processes |
| Colorectum | AD |  |
| Colorectum | SER |  |
| Colorectum | MSS |  |
| Colorectum | MSI-H |  |
| Colorectum | FAP |  |
| ∗Top 15 enriched GO BP terms are showed in the bar plot of each disease state in each tissue. Each row represents a significant GO biological process which is colored according to the -log10(p.adjust). |
| Page: 1 2 3 4 5 6 7 8 9 |
| GO ID | Tissue | Disease Stage | Description | Gene Ratio | Bg Ratio | pvalue | p.adjust | Count |
| Page: 1 |
| Pathway ID | Tissue | Disease Stage | Description | Gene Ratio | Bg Ratio | pvalue | p.adjust | qvalue | Count |
| hsa04144 | Colorectum | AD | Endocytosis | 111/2092 | 251/8465 | 5.95e-12 | 1.42e-10 | 9.08e-11 | 111 |
| hsa05131 | Colorectum | AD | Shigellosis | 109/2092 | 247/8465 | 1.09e-11 | 2.44e-10 | 1.55e-10 | 109 |
| hsa05100 | Colorectum | AD | Bacterial invasion of epithelial cells | 44/2092 | 77/8465 | 1.13e-09 | 2.22e-08 | 1.42e-08 | 44 |
| hsa04530 | Colorectum | AD | Tight junction | 76/2092 | 169/8465 | 5.49e-09 | 9.69e-08 | 6.18e-08 | 76 |
| hsa05132 | Colorectum | AD | Salmonella infection | 102/2092 | 249/8465 | 7.65e-09 | 1.28e-07 | 8.17e-08 | 102 |
| hsa04666 | Colorectum | AD | Fc gamma R-mediated phagocytosis | 46/2092 | 97/8465 | 9.10e-07 | 1.22e-05 | 7.77e-06 | 46 |
| hsa05130 | Colorectum | AD | Pathogenic Escherichia coli infection | 79/2092 | 197/8465 | 1.05e-06 | 1.36e-05 | 8.65e-06 | 79 |
| hsa05135 | Colorectum | AD | Yersinia infection | 58/2092 | 137/8465 | 3.90e-06 | 4.35e-05 | 2.78e-05 | 58 |
| hsa04810 | Colorectum | AD | Regulation of actin cytoskeleton | 75/2092 | 229/8465 | 3.36e-03 | 1.76e-02 | 1.12e-02 | 75 |
| hsa041441 | Colorectum | AD | Endocytosis | 111/2092 | 251/8465 | 5.95e-12 | 1.42e-10 | 9.08e-11 | 111 |
| hsa051311 | Colorectum | AD | Shigellosis | 109/2092 | 247/8465 | 1.09e-11 | 2.44e-10 | 1.55e-10 | 109 |
| hsa051001 | Colorectum | AD | Bacterial invasion of epithelial cells | 44/2092 | 77/8465 | 1.13e-09 | 2.22e-08 | 1.42e-08 | 44 |
| hsa045301 | Colorectum | AD | Tight junction | 76/2092 | 169/8465 | 5.49e-09 | 9.69e-08 | 6.18e-08 | 76 |
| hsa051321 | Colorectum | AD | Salmonella infection | 102/2092 | 249/8465 | 7.65e-09 | 1.28e-07 | 8.17e-08 | 102 |
| hsa046661 | Colorectum | AD | Fc gamma R-mediated phagocytosis | 46/2092 | 97/8465 | 9.10e-07 | 1.22e-05 | 7.77e-06 | 46 |
| hsa051301 | Colorectum | AD | Pathogenic Escherichia coli infection | 79/2092 | 197/8465 | 1.05e-06 | 1.36e-05 | 8.65e-06 | 79 |
| hsa051351 | Colorectum | AD | Yersinia infection | 58/2092 | 137/8465 | 3.90e-06 | 4.35e-05 | 2.78e-05 | 58 |
| hsa048101 | Colorectum | AD | Regulation of actin cytoskeleton | 75/2092 | 229/8465 | 3.36e-03 | 1.76e-02 | 1.12e-02 | 75 |
| hsa041444 | Colorectum | MSS | Endocytosis | 102/1875 | 251/8465 | 1.85e-11 | 4.43e-10 | 2.71e-10 | 102 |
| hsa051314 | Colorectum | MSS | Shigellosis | 94/1875 | 247/8465 | 6.82e-09 | 1.34e-07 | 8.23e-08 | 94 |
| Page: 1 2 3 4 5 6 |
Top |
Cell-cell communication analysis |
| Identification of potential cell-cell interactions between two cell types and their ligand-receptor pairs for different disease states |
| Ligand | Receptor | LRpair | Pathway | Tissue | Disease Stage |
| Page: 1 |
Top |
Single-cell gene regulatory network inference analysis |
| Find out the significant the regulons (TFs) and the target genes of each regulon across cell types for different disease states |
| TF | Cell Type | Tissue | Disease Stage | Target Gene | RSS | Regulon Activity |
| ∗The dot plots of a searched regulon are shown for all cell subpopulations in each disease state of each tissue based on the regulon specific score inferred using pySCENIC and by calculating the average expression. |
| Page: 1 |
Top |
Somatic mutation of malignant transformation related genes |
| Annotation of somatic variants for genes involved in malignant transformation |
| Hugo Symbol | Variant Class | Variant Classification | dbSNP RS | HGVSc | HGVSp | HGVSp Short | SWISSPROT | BIOTYPE | SIFT | PolyPhen | Tumor Sample Barcode | Tissue | Histology | Sex | Age | Stage | Therapy Types | Drugs | Outcome |
| ACTR3C | SNV | Missense_Mutation | rs775952807 | c.104C>T | p.Thr35Met | p.T35M | Q9C0K3 | protein_coding | deleterious(0.02) | possibly_damaging(0.788) | TCGA-AA-3821-01 | Colorectum | colon adenocarcinoma | Female | >=65 | I/II | Unknown | Unknown | SD |
| ACTR3C | SNV | Missense_Mutation | rs780988364 | c.322G>A | p.Asp108Asn | p.D108N | Q9C0K3 | protein_coding | tolerated(0.05) | possibly_damaging(0.855) | TCGA-AG-A002-01 | Colorectum | rectum adenocarcinoma | Male | <65 | I/II | Unknown | Unknown | SD |
| ACTR3C | SNV | Missense_Mutation | novel | c.433N>A | p.Glu145Lys | p.E145K | Q9C0K3 | protein_coding | tolerated(0.08) | possibly_damaging(0.531) | TCGA-EI-6917-01 | Colorectum | rectum adenocarcinoma | Male | <65 | III/IV | Chemotherapy | 5fluorouracil+oxaciplatina+l-folinian | SD |
| ACTR3C | SNV | Missense_Mutation | novel | c.112G>T | p.Val38Phe | p.V38F | Q9C0K3 | protein_coding | deleterious(0) | probably_damaging(1) | TCGA-A5-A1OF-01 | Endometrium | uterine corpus endometrioid carcinoma | Female | <65 | I/II | Unknown | Unknown | SD |
| ACTR3C | SNV | Missense_Mutation | novel | c.421N>T | p.Asp141Tyr | p.D141Y | Q9C0K3 | protein_coding | deleterious(0.01) | probably_damaging(0.994) | TCGA-AP-A059-01 | Endometrium | uterine corpus endometrioid carcinoma | Female | >=65 | I/II | Unknown | Unknown | SD |
| ACTR3C | SNV | Missense_Mutation | novel | c.26N>A | p.Gly9Glu | p.G9E | Q9C0K3 | protein_coding | deleterious(0) | probably_damaging(1) | TCGA-AP-A1DO-01 | Endometrium | uterine corpus endometrioid carcinoma | Female | <65 | I/II | Unknown | Unknown | SD |
| ACTR3C | SNV | Missense_Mutation | novel | c.267G>T | p.Glu89Asp | p.E89D | Q9C0K3 | protein_coding | tolerated(0.32) | benign(0.144) | TCGA-AX-A2HC-01 | Endometrium | uterine corpus endometrioid carcinoma | Female | <65 | III/IV | Chemotherapy | paclitaxel | PD |
| ACTR3C | SNV | Missense_Mutation | novel | c.184N>G | p.Lys62Glu | p.K62E | Q9C0K3 | protein_coding | deleterious(0.03) | probably_damaging(0.944) | TCGA-B5-A3FA-01 | Endometrium | uterine corpus endometrioid carcinoma | Female | >=65 | I/II | Unknown | Unknown | SD |
| ACTR3C | SNV | Missense_Mutation | novel | c.173N>T | p.Gly58Val | p.G58V | Q9C0K3 | protein_coding | deleterious(0) | probably_damaging(0.992) | TCGA-EO-A22U-01 | Endometrium | uterine corpus endometrioid carcinoma | Female | >=65 | I/II | Unknown | Unknown | SD |
| ACTR3C | SNV | Missense_Mutation | novel | c.372N>G | p.Ile124Met | p.I124M | Q9C0K3 | protein_coding | tolerated(0.07) | benign(0.314) | TCGA-22-5481-01 | Lung | lung squamous cell carcinoma | Female | >=65 | I/II | Unknown | Unknown | PD |
| Page: 1 2 |
Top |
Related drugs of malignant transformation related genes |
| Identification of chemicals and drugs interact with genes involved in malignant transfromation |
| (DGIdb 4.0) |
| Entrez ID | Symbol | Category | Interaction Types | Drug Claim Name | Drug Name | PMIDs |
| Page: 1 |

Copyright 2023-Present -The University of Texas Health Science Center at Houston |