| Tissue | Expression Dynamics | Abbreviation |
| Colorectum (GSE201348) |  | FAP: Familial adenomatous polyposis |
| CRC: Colorectal cancer |
| Colorectum (HTA11) |  | AD: Adenomas |
| SER: Sessile serrated lesions |
| MSI-H: Microsatellite-high colorectal cancer |
| MSS: Microsatellite stable colorectal cancer |
| Endometrium | 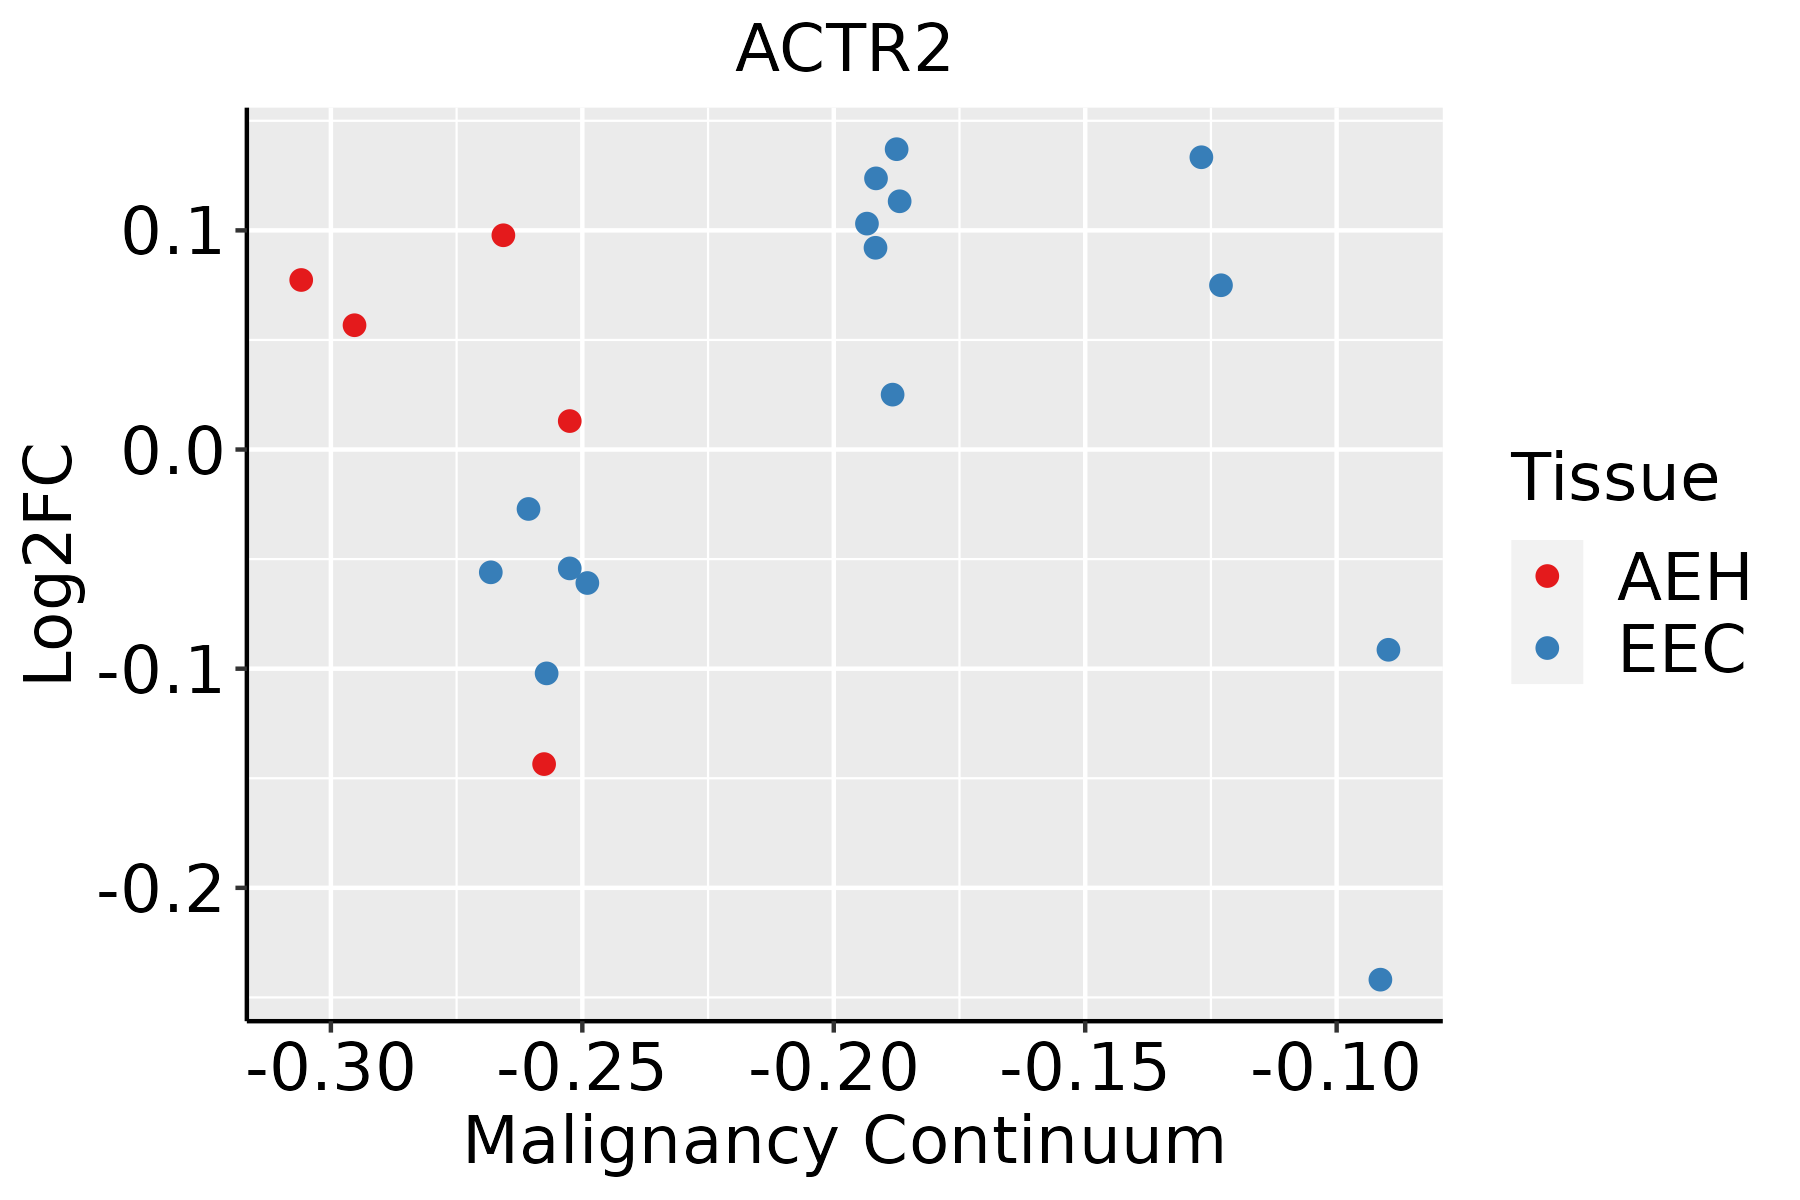 | AEH: Atypical endometrial hyperplasia |
| EEC: Endometrioid Cancer |
| Esophagus | 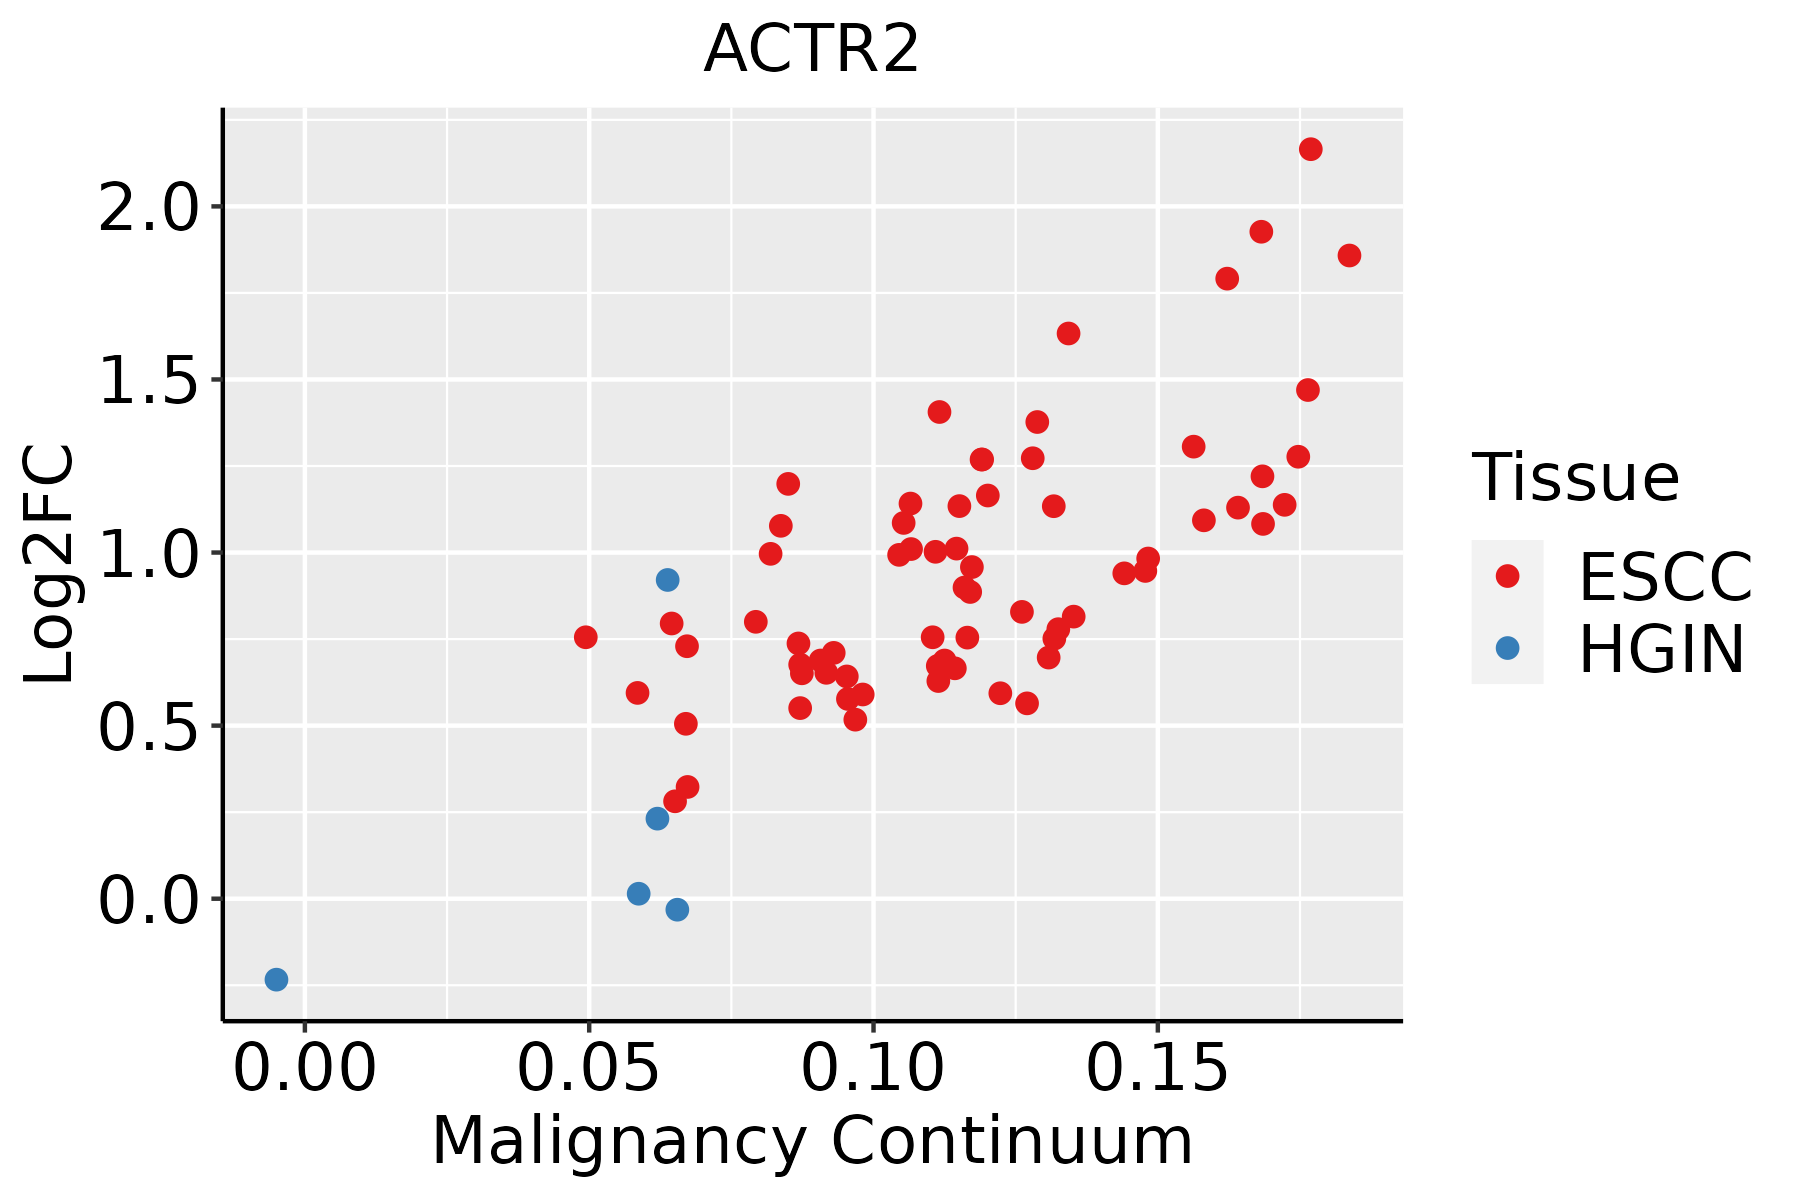 | ESCC: Esophageal squamous cell carcinoma |
| HGIN: High-grade intraepithelial neoplasias |
| LGIN: Low-grade intraepithelial neoplasias |
| Liver | 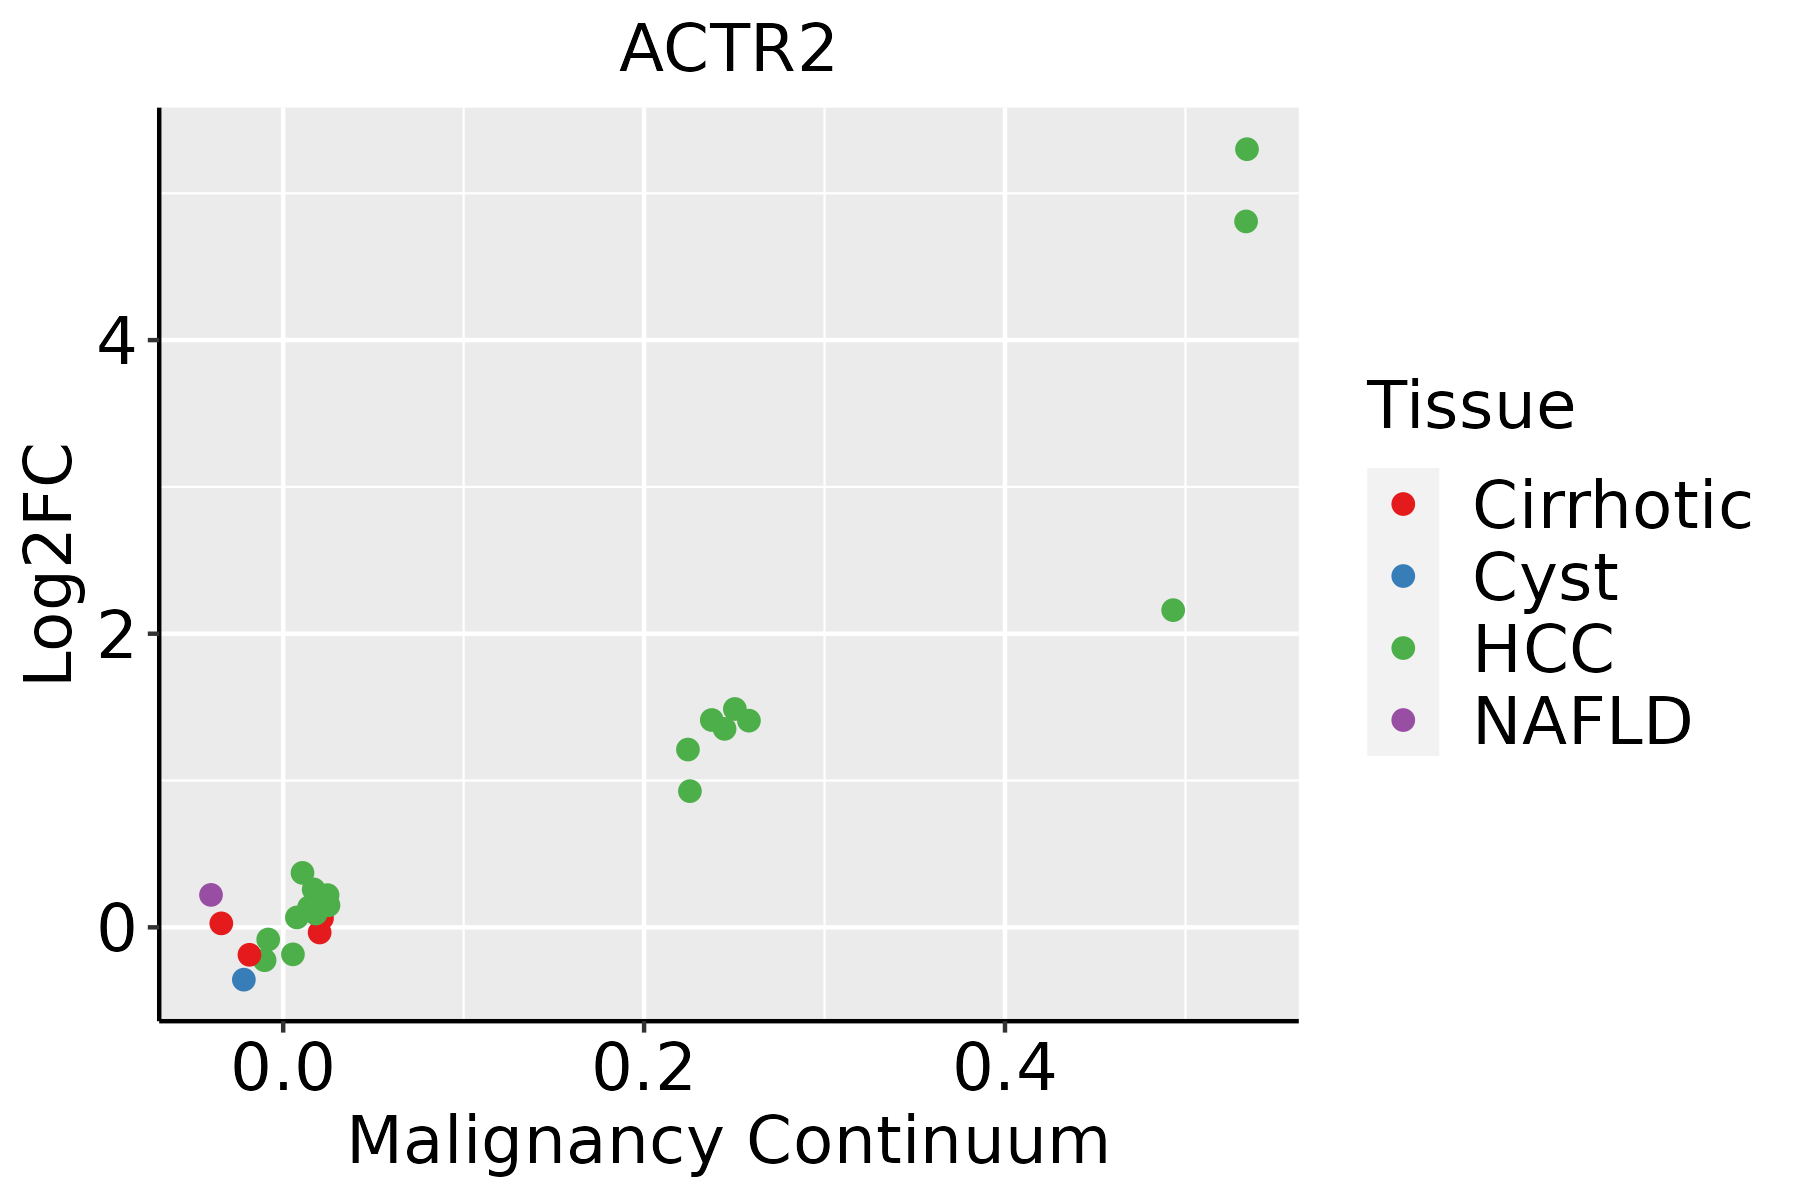 | HCC: Hepatocellular carcinoma |
| NAFLD: Non-alcoholic fatty liver disease |
| Oral Cavity | 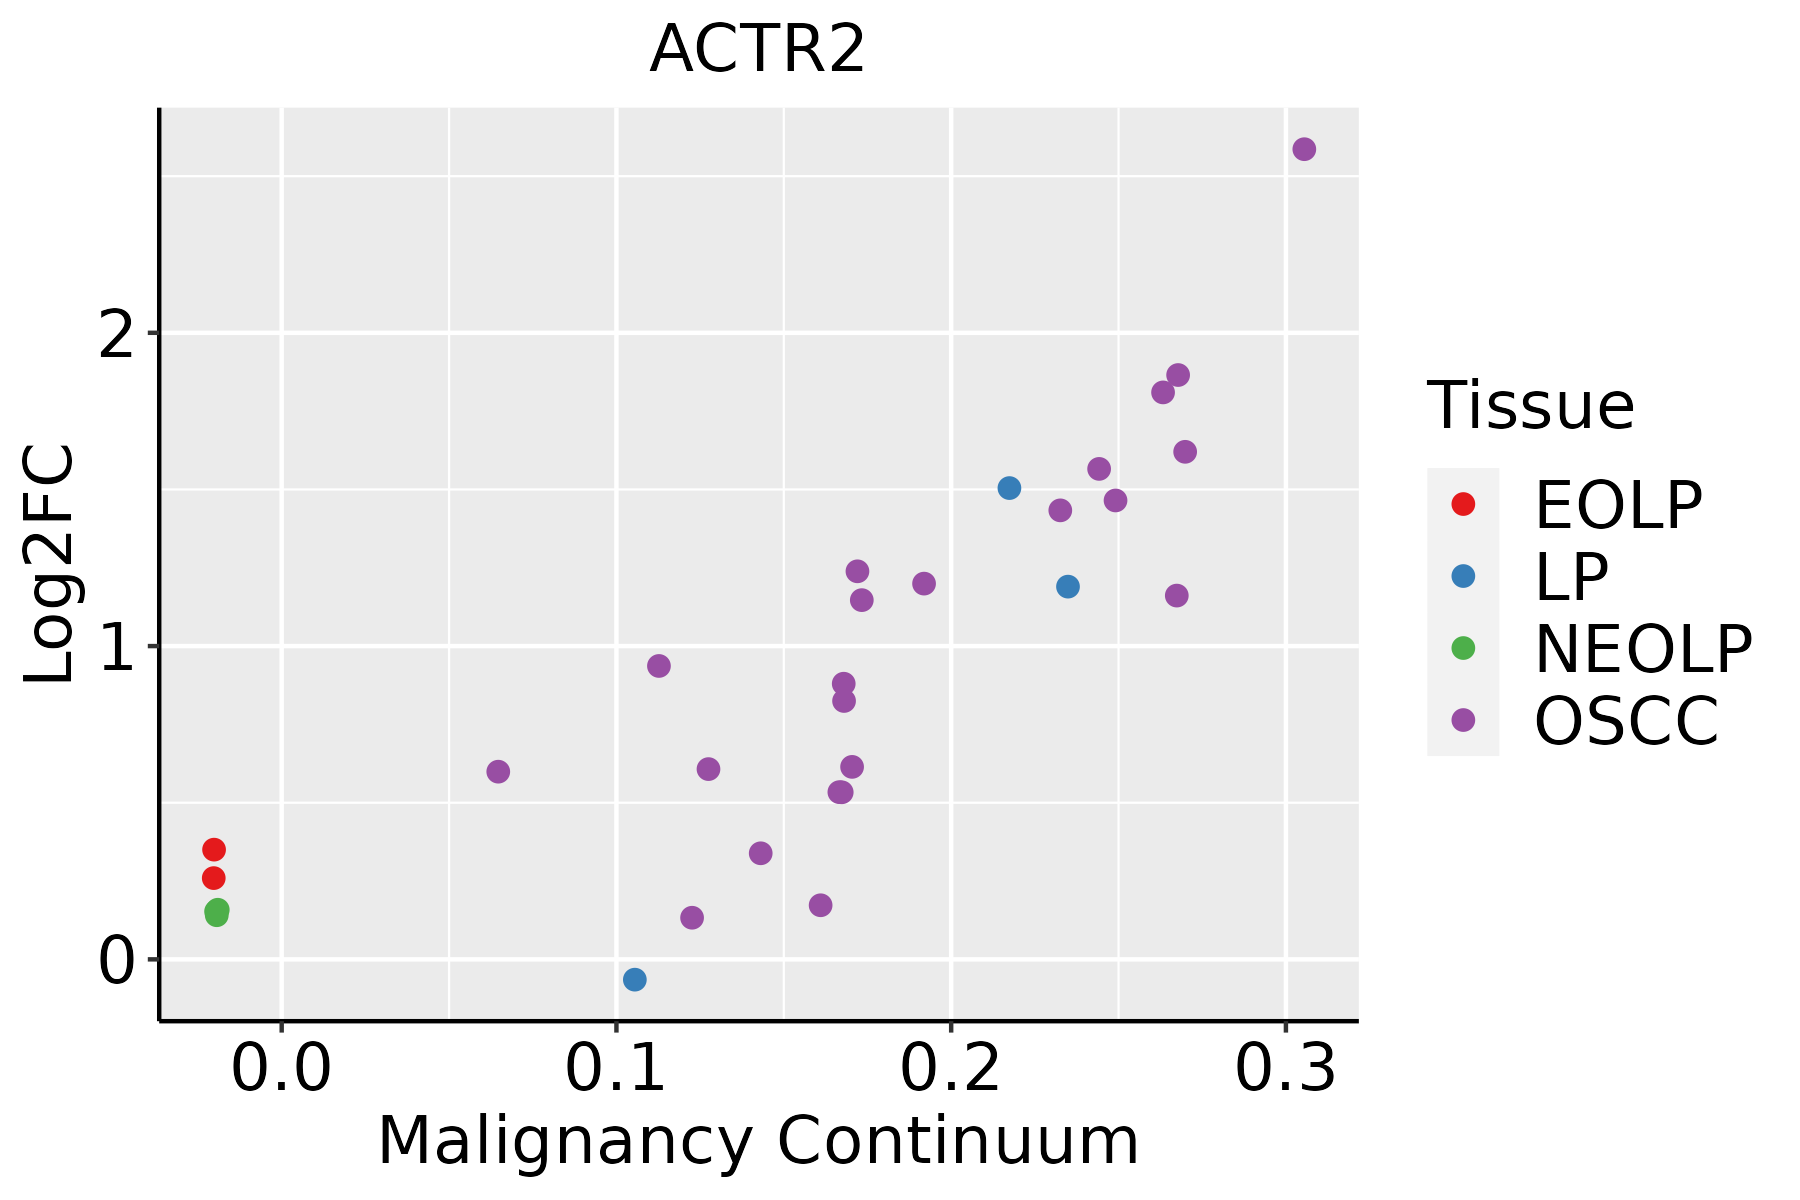 | EOLP: Erosive Oral lichen planus |
| LP: leukoplakia |
| NEOLP: Non-erosive oral lichen planus |
| OSCC: Oral squamous cell carcinoma |
| Prostate | 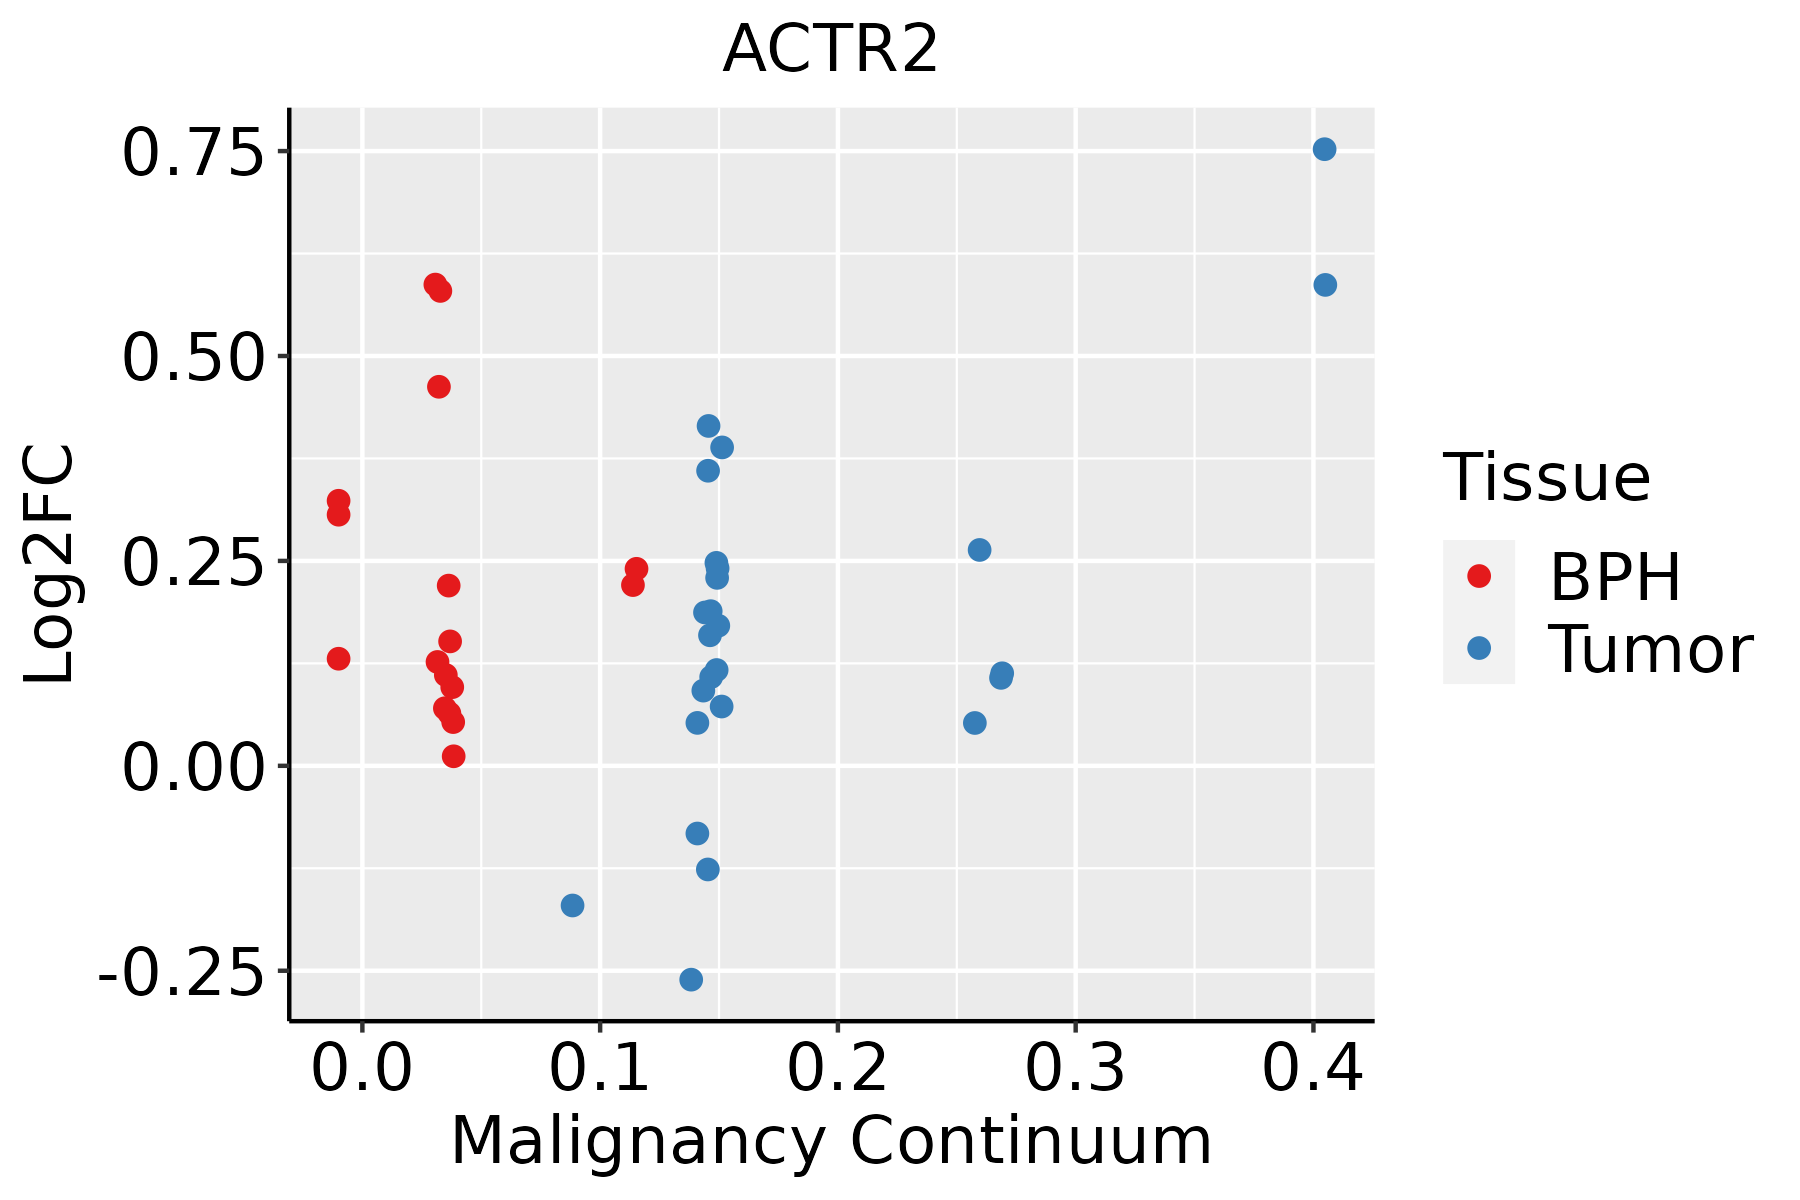 | BPH: Benign Prostatic Hyperplasia |
| Skin | 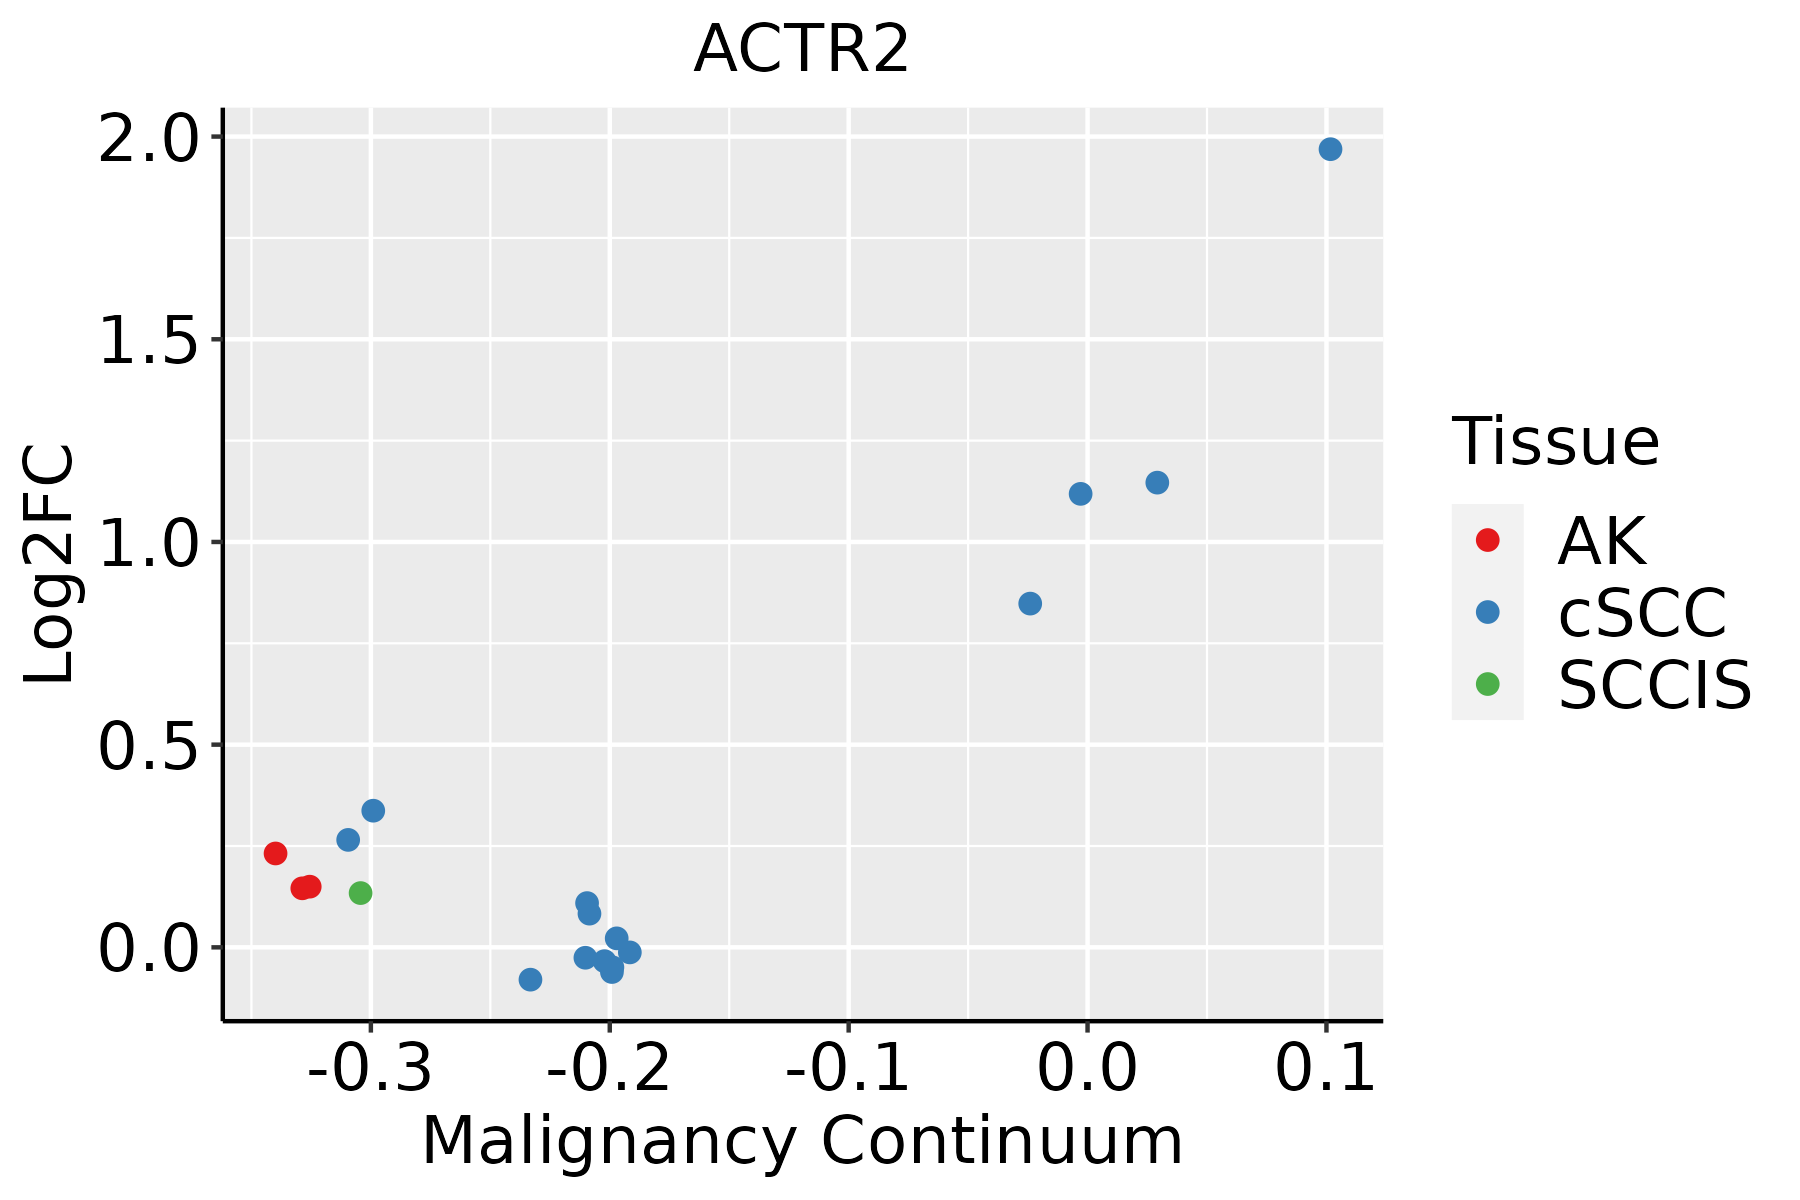 | AK: Actinic keratosis |
| cSCC: Cutaneous squamous cell carcinoma |
| SCCIS:squamous cell carcinoma in situ |
| Thyroid | 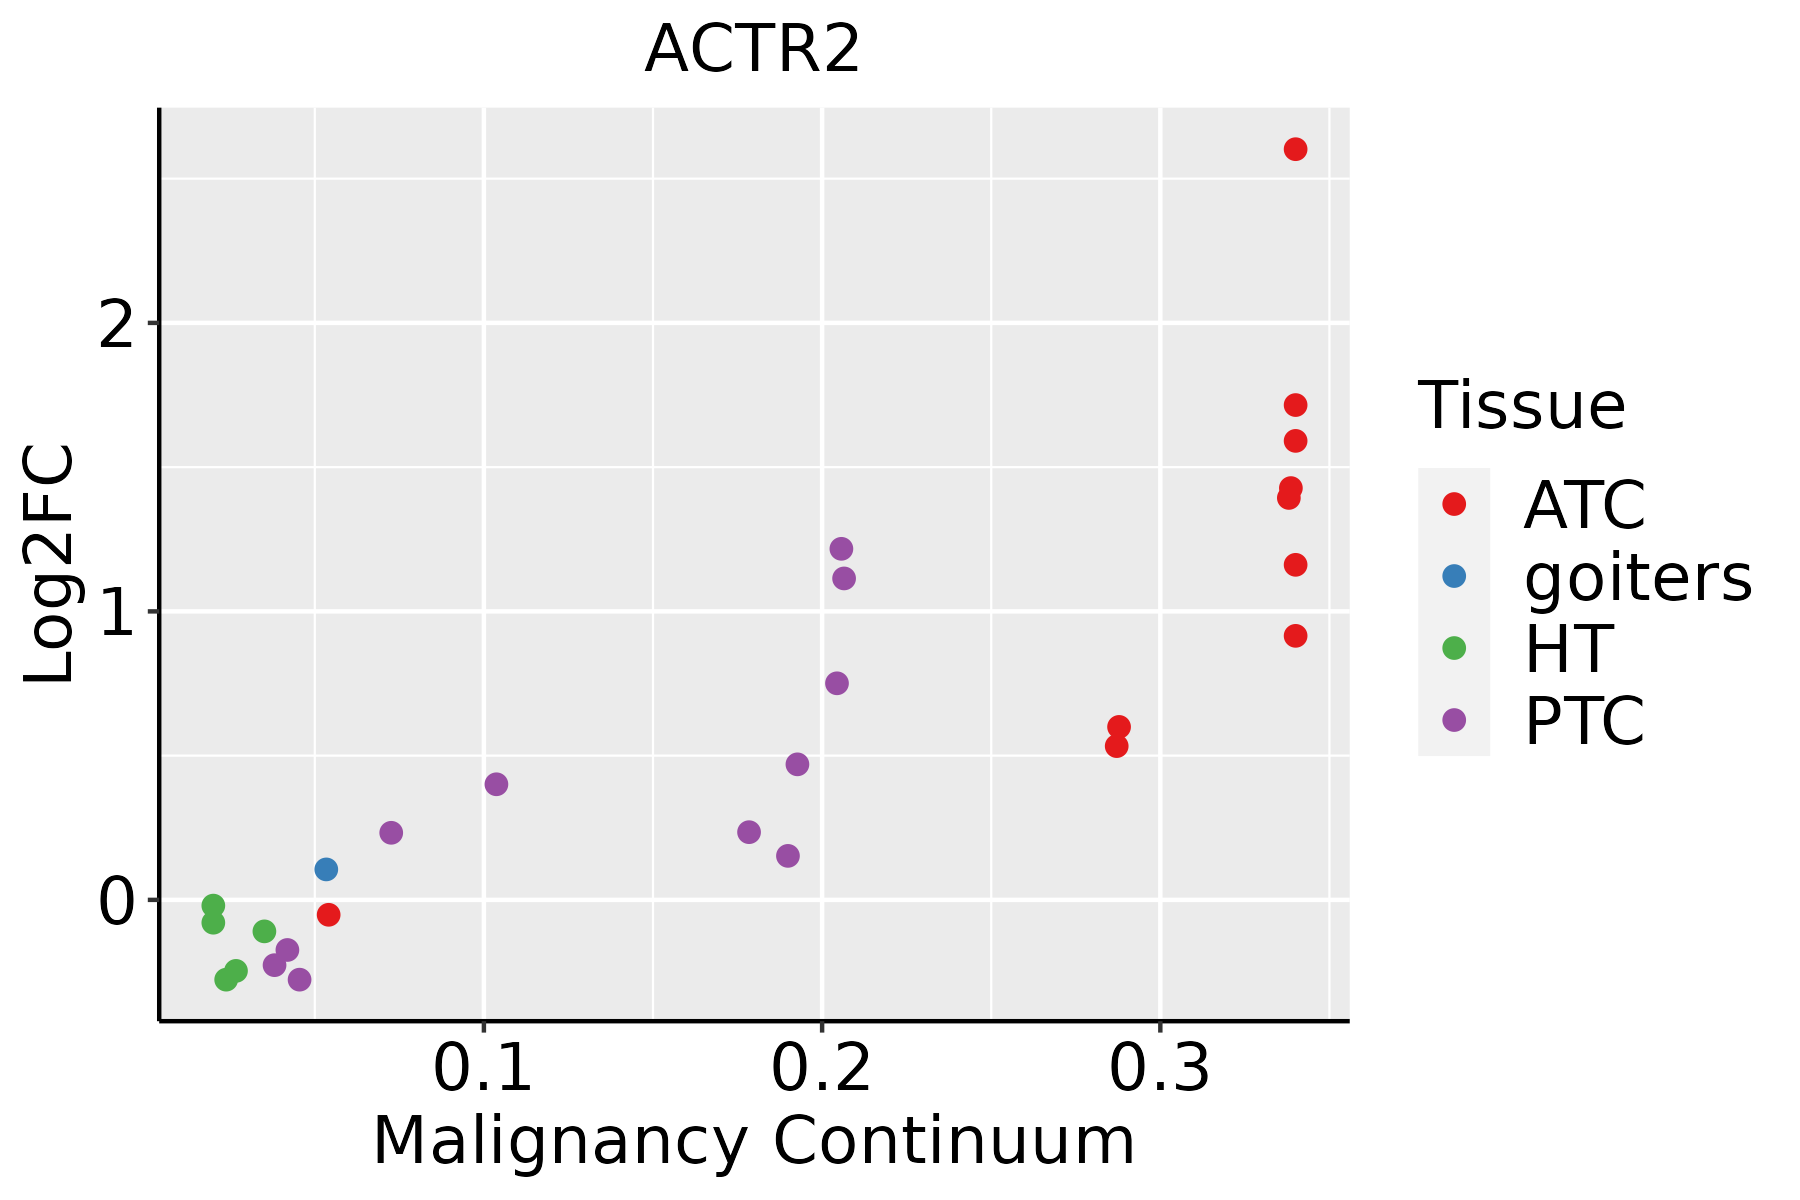 | ATC: Anaplastic thyroid cancer |
| HT: Hashimoto's thyroiditis |
| PTC: Papillary thyroid cancer |
| GO ID | Tissue | Disease Stage | Description | Gene Ratio | Bg Ratio | pvalue | p.adjust | Count |
| GO:0007015 | Colorectum | AD | actin filament organization | 167/3918 | 442/18723 | 1.65e-16 | 7.94e-14 | 167 |
| GO:0032535 | Colorectum | AD | regulation of cellular component size | 142/3918 | 383/18723 | 1.74e-13 | 3.41e-11 | 142 |
| GO:1902903 | Colorectum | AD | regulation of supramolecular fiber organization | 139/3918 | 383/18723 | 2.01e-12 | 3.19e-10 | 139 |
| GO:0032970 | Colorectum | AD | regulation of actin filament-based process | 142/3918 | 397/18723 | 4.05e-12 | 5.90e-10 | 142 |
| GO:0110053 | Colorectum | AD | regulation of actin filament organization | 108/3918 | 278/18723 | 5.02e-12 | 6.98e-10 | 108 |
| GO:0008154 | Colorectum | AD | actin polymerization or depolymerization | 90/3918 | 218/18723 | 6.14e-12 | 8.23e-10 | 90 |
| GO:0032271 | Colorectum | AD | regulation of protein polymerization | 94/3918 | 233/18723 | 1.01e-11 | 1.29e-09 | 94 |
| GO:0030041 | Colorectum | AD | actin filament polymerization | 81/3918 | 191/18723 | 1.35e-11 | 1.69e-09 | 81 |
| GO:0051258 | Colorectum | AD | protein polymerization | 112/3918 | 297/18723 | 1.85e-11 | 2.27e-09 | 112 |
| GO:0043254 | Colorectum | AD | regulation of protein-containing complex assembly | 148/3918 | 428/18723 | 2.64e-11 | 3.18e-09 | 148 |
| GO:0008064 | Colorectum | AD | regulation of actin polymerization or depolymerization | 79/3918 | 188/18723 | 4.17e-11 | 4.74e-09 | 79 |
| GO:0030833 | Colorectum | AD | regulation of actin filament polymerization | 74/3918 | 172/18723 | 4.50e-11 | 5.03e-09 | 74 |
| GO:0030832 | Colorectum | AD | regulation of actin filament length | 79/3918 | 189/18723 | 5.71e-11 | 6.27e-09 | 79 |
| GO:1902905 | Colorectum | AD | positive regulation of supramolecular fiber organization | 85/3918 | 209/18723 | 5.95e-11 | 6.33e-09 | 85 |
| GO:0032956 | Colorectum | AD | regulation of actin cytoskeleton organization | 127/3918 | 358/18723 | 1.03e-10 | 1.04e-08 | 127 |
| GO:0051495 | Colorectum | AD | positive regulation of cytoskeleton organization | 89/3918 | 226/18723 | 1.61e-10 | 1.56e-08 | 89 |
| GO:0032273 | Colorectum | AD | positive regulation of protein polymerization | 62/3918 | 138/18723 | 1.94e-10 | 1.76e-08 | 62 |
| GO:0031334 | Colorectum | AD | positive regulation of protein-containing complex assembly | 91/3918 | 237/18723 | 4.78e-10 | 3.99e-08 | 91 |
| GO:0030838 | Colorectum | AD | positive regulation of actin filament polymerization | 48/3918 | 99/18723 | 9.21e-10 | 7.03e-08 | 48 |
| GO:0051656 | Colorectum | AD | establishment of organelle localization | 131/3918 | 390/18723 | 3.00e-09 | 2.06e-07 | 131 |
| Pathway ID | Tissue | Disease Stage | Description | Gene Ratio | Bg Ratio | pvalue | p.adjust | qvalue | Count |
| hsa04144 | Colorectum | AD | Endocytosis | 111/2092 | 251/8465 | 5.95e-12 | 1.42e-10 | 9.08e-11 | 111 |
| hsa05131 | Colorectum | AD | Shigellosis | 109/2092 | 247/8465 | 1.09e-11 | 2.44e-10 | 1.55e-10 | 109 |
| hsa05100 | Colorectum | AD | Bacterial invasion of epithelial cells | 44/2092 | 77/8465 | 1.13e-09 | 2.22e-08 | 1.42e-08 | 44 |
| hsa04530 | Colorectum | AD | Tight junction | 76/2092 | 169/8465 | 5.49e-09 | 9.69e-08 | 6.18e-08 | 76 |
| hsa05132 | Colorectum | AD | Salmonella infection | 102/2092 | 249/8465 | 7.65e-09 | 1.28e-07 | 8.17e-08 | 102 |
| hsa04666 | Colorectum | AD | Fc gamma R-mediated phagocytosis | 46/2092 | 97/8465 | 9.10e-07 | 1.22e-05 | 7.77e-06 | 46 |
| hsa05130 | Colorectum | AD | Pathogenic Escherichia coli infection | 79/2092 | 197/8465 | 1.05e-06 | 1.36e-05 | 8.65e-06 | 79 |
| hsa05135 | Colorectum | AD | Yersinia infection | 58/2092 | 137/8465 | 3.90e-06 | 4.35e-05 | 2.78e-05 | 58 |
| hsa04810 | Colorectum | AD | Regulation of actin cytoskeleton | 75/2092 | 229/8465 | 3.36e-03 | 1.76e-02 | 1.12e-02 | 75 |
| hsa041441 | Colorectum | AD | Endocytosis | 111/2092 | 251/8465 | 5.95e-12 | 1.42e-10 | 9.08e-11 | 111 |
| hsa051311 | Colorectum | AD | Shigellosis | 109/2092 | 247/8465 | 1.09e-11 | 2.44e-10 | 1.55e-10 | 109 |
| hsa051001 | Colorectum | AD | Bacterial invasion of epithelial cells | 44/2092 | 77/8465 | 1.13e-09 | 2.22e-08 | 1.42e-08 | 44 |
| hsa045301 | Colorectum | AD | Tight junction | 76/2092 | 169/8465 | 5.49e-09 | 9.69e-08 | 6.18e-08 | 76 |
| hsa051321 | Colorectum | AD | Salmonella infection | 102/2092 | 249/8465 | 7.65e-09 | 1.28e-07 | 8.17e-08 | 102 |
| hsa046661 | Colorectum | AD | Fc gamma R-mediated phagocytosis | 46/2092 | 97/8465 | 9.10e-07 | 1.22e-05 | 7.77e-06 | 46 |
| hsa051301 | Colorectum | AD | Pathogenic Escherichia coli infection | 79/2092 | 197/8465 | 1.05e-06 | 1.36e-05 | 8.65e-06 | 79 |
| hsa051351 | Colorectum | AD | Yersinia infection | 58/2092 | 137/8465 | 3.90e-06 | 4.35e-05 | 2.78e-05 | 58 |
| hsa048101 | Colorectum | AD | Regulation of actin cytoskeleton | 75/2092 | 229/8465 | 3.36e-03 | 1.76e-02 | 1.12e-02 | 75 |
| hsa051312 | Colorectum | SER | Shigellosis | 87/1580 | 247/8465 | 3.07e-10 | 7.27e-09 | 5.28e-09 | 87 |
| hsa051002 | Colorectum | SER | Bacterial invasion of epithelial cells | 36/1580 | 77/8465 | 1.56e-08 | 3.45e-07 | 2.50e-07 | 36 |
| Hugo Symbol | Variant Class | Variant Classification | dbSNP RS | HGVSc | HGVSp | HGVSp Short | SWISSPROT | BIOTYPE | SIFT | PolyPhen | Tumor Sample Barcode | Tissue | Histology | Sex | Age | Stage | Therapy Types | Drugs | Outcome |
| ACTR2 | SNV | Missense_Mutation | novel | c.743N>A | p.Ser248Tyr | p.S248Y | P61160 | protein_coding | deleterious(0) | possibly_damaging(0.725) | TCGA-AN-A046-01 | Breast | breast invasive carcinoma | Female | >=65 | I/II | Unknown | Unknown | SD |
| ACTR2 | SNV | Missense_Mutation | rs746974315 | c.1196N>A | p.Arg399Gln | p.R399Q | P61160 | protein_coding | deleterious_low_confidence(0.01) | benign(0) | TCGA-AN-A046-01 | Breast | breast invasive carcinoma | Female | >=65 | I/II | Unknown | Unknown | SD |
| ACTR2 | SNV | Missense_Mutation | | c.1043G>A | p.Arg348His | p.R348H | P61160 | protein_coding | deleterious(0.02) | possibly_damaging(0.807) | TCGA-AA-3947-01 | Colorectum | colon adenocarcinoma | Female | <65 | I/II | Unknown | Unknown | SD |
| ACTR2 | SNV | Missense_Mutation | rs17851188 | c.529N>A | p.Gly177Ser | p.G177S | P61160 | protein_coding | tolerated(0.08) | possibly_damaging(0.706) | TCGA-AA-A01V-01 | Colorectum | colon adenocarcinoma | Male | <65 | I/II | Unknown | Unknown | SD |
| ACTR2 | SNV | Missense_Mutation | | c.254G>A | p.Arg85Gln | p.R85Q | P61160 | protein_coding | tolerated(0.42) | possibly_damaging(0.899) | TCGA-EI-6917-01 | Colorectum | rectum adenocarcinoma | Male | <65 | III/IV | Chemotherapy | 5fluorouracil+oxaciplatina+l-folinian | SD |
| ACTR2 | SNV | Missense_Mutation | novel | c.1061G>A | p.Arg354His | p.R354H | P61160 | protein_coding | deleterious(0.03) | possibly_damaging(0.852) | TCGA-EI-6917-01 | Colorectum | rectum adenocarcinoma | Male | <65 | III/IV | Chemotherapy | 5fluorouracil+oxaciplatina+l-folinian | SD |
| ACTR2 | SNV | Missense_Mutation | novel | c.668N>C | p.Glu223Ala | p.E223A | P61160 | protein_coding | deleterious(0.01) | benign(0.229) | TCGA-A5-A0G2-01 | Endometrium | uterine corpus endometrioid carcinoma | Female | <65 | III/IV | Unknown | Unknown | SD |
| ACTR2 | SNV | Missense_Mutation | | c.946N>A | p.Pro316Thr | p.P316T | P61160 | protein_coding | deleterious(0) | possibly_damaging(0.767) | TCGA-A5-A0G2-01 | Endometrium | uterine corpus endometrioid carcinoma | Female | <65 | III/IV | Unknown | Unknown | SD |
| ACTR2 | SNV | Missense_Mutation | novel | c.1048N>A | p.Glu350Lys | p.E350K | P61160 | protein_coding | tolerated(0.64) | probably_damaging(0.999) | TCGA-AJ-A3EK-01 | Endometrium | uterine corpus endometrioid carcinoma | Female | <65 | I/II | Chemotherapy | carboplatin | CR |
| ACTR2 | SNV | Missense_Mutation | | c.655N>T | p.Arg219Cys | p.R219C | P61160 | protein_coding | deleterious(0) | benign(0.186) | TCGA-AJ-A3EL-01 | Endometrium | uterine corpus endometrioid carcinoma | Female | <65 | I/II | Unknown | Unknown | SD |


