
|
|||||
|
 | |
| |
| |
| |
| |
| |
|
Gene: ACTR1B |
Gene summary for ACTR1B |
| Gene information | Species | Human | Gene symbol | ACTR1B | Gene ID | 10120 |
| Gene name | actin related protein 1B | |
| Gene Alias | ARP1B | |
| Cytomap | 2q11.2 | |
| Gene Type | protein-coding | GO ID | GO:0005575 | UniProtAcc | P42025 |
Top |
Malignant transformation analysis |
| Identification of the aberrant gene expression in precancerous and cancerous lesions by comparing the gene expression of stem-like cells in diseased tissues with normal stem cells |
| Entrez ID | Symbol | Replicates | Species | Organ | Tissue | Adj P-value | Log2FC | Malignancy |
| 10120 | ACTR1B | LZE4T | Human | Esophagus | ESCC | 3.75e-04 | 2.29e-01 | 0.0811 |
| 10120 | ACTR1B | LZE7T | Human | Esophagus | ESCC | 1.57e-02 | 2.72e-01 | 0.0667 |
| 10120 | ACTR1B | LZE22T | Human | Esophagus | ESCC | 5.42e-09 | 3.87e-01 | 0.068 |
| 10120 | ACTR1B | LZE24T | Human | Esophagus | ESCC | 1.57e-13 | 4.77e-01 | 0.0596 |
| 10120 | ACTR1B | LZE21T | Human | Esophagus | ESCC | 6.66e-04 | 1.75e-01 | 0.0655 |
| 10120 | ACTR1B | P1T-E | Human | Esophagus | ESCC | 1.51e-02 | 3.03e-01 | 0.0875 |
| 10120 | ACTR1B | P2T-E | Human | Esophagus | ESCC | 8.90e-59 | 8.37e-01 | 0.1177 |
| 10120 | ACTR1B | P4T-E | Human | Esophagus | ESCC | 2.40e-31 | 6.81e-01 | 0.1323 |
| 10120 | ACTR1B | P5T-E | Human | Esophagus | ESCC | 9.81e-19 | 3.80e-01 | 0.1327 |
| 10120 | ACTR1B | P8T-E | Human | Esophagus | ESCC | 1.11e-27 | 4.41e-01 | 0.0889 |
| 10120 | ACTR1B | P9T-E | Human | Esophagus | ESCC | 4.32e-09 | 2.18e-01 | 0.1131 |
| 10120 | ACTR1B | P10T-E | Human | Esophagus | ESCC | 4.17e-38 | 6.75e-01 | 0.116 |
| 10120 | ACTR1B | P11T-E | Human | Esophagus | ESCC | 2.64e-10 | 4.24e-01 | 0.1426 |
| 10120 | ACTR1B | P12T-E | Human | Esophagus | ESCC | 2.34e-32 | 6.03e-01 | 0.1122 |
| 10120 | ACTR1B | P15T-E | Human | Esophagus | ESCC | 2.02e-11 | 3.70e-01 | 0.1149 |
| 10120 | ACTR1B | P16T-E | Human | Esophagus | ESCC | 7.70e-30 | 5.02e-01 | 0.1153 |
| 10120 | ACTR1B | P17T-E | Human | Esophagus | ESCC | 1.85e-05 | 4.17e-01 | 0.1278 |
| 10120 | ACTR1B | P19T-E | Human | Esophagus | ESCC | 3.53e-05 | 6.43e-01 | 0.1662 |
| 10120 | ACTR1B | P20T-E | Human | Esophagus | ESCC | 1.05e-11 | 2.90e-01 | 0.1124 |
| 10120 | ACTR1B | P21T-E | Human | Esophagus | ESCC | 1.62e-37 | 6.18e-01 | 0.1617 |
| Page: 1 2 3 4 5 6 |
| Tissue | Expression Dynamics | Abbreviation |
| Esophagus | 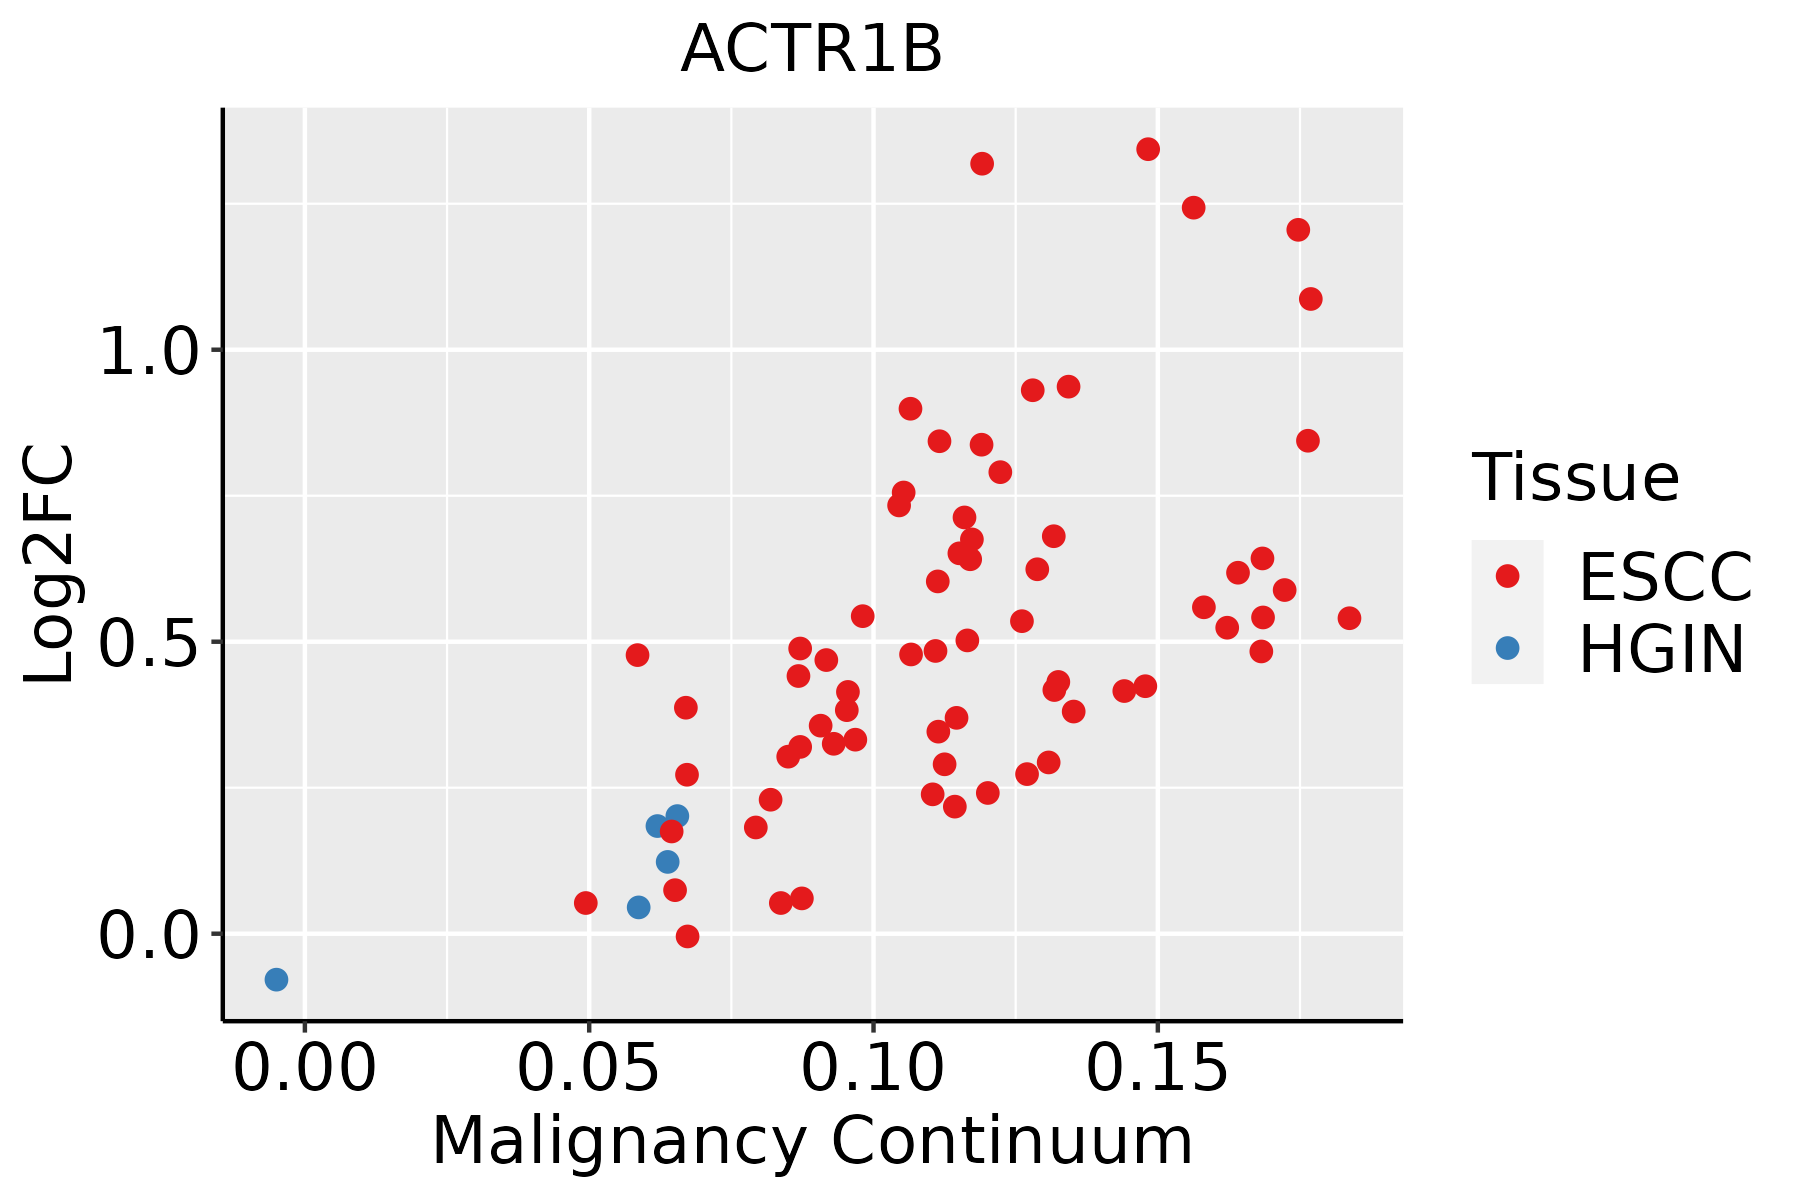 | ESCC: Esophageal squamous cell carcinoma |
| HGIN: High-grade intraepithelial neoplasias | ||
| LGIN: Low-grade intraepithelial neoplasias | ||
| Liver | 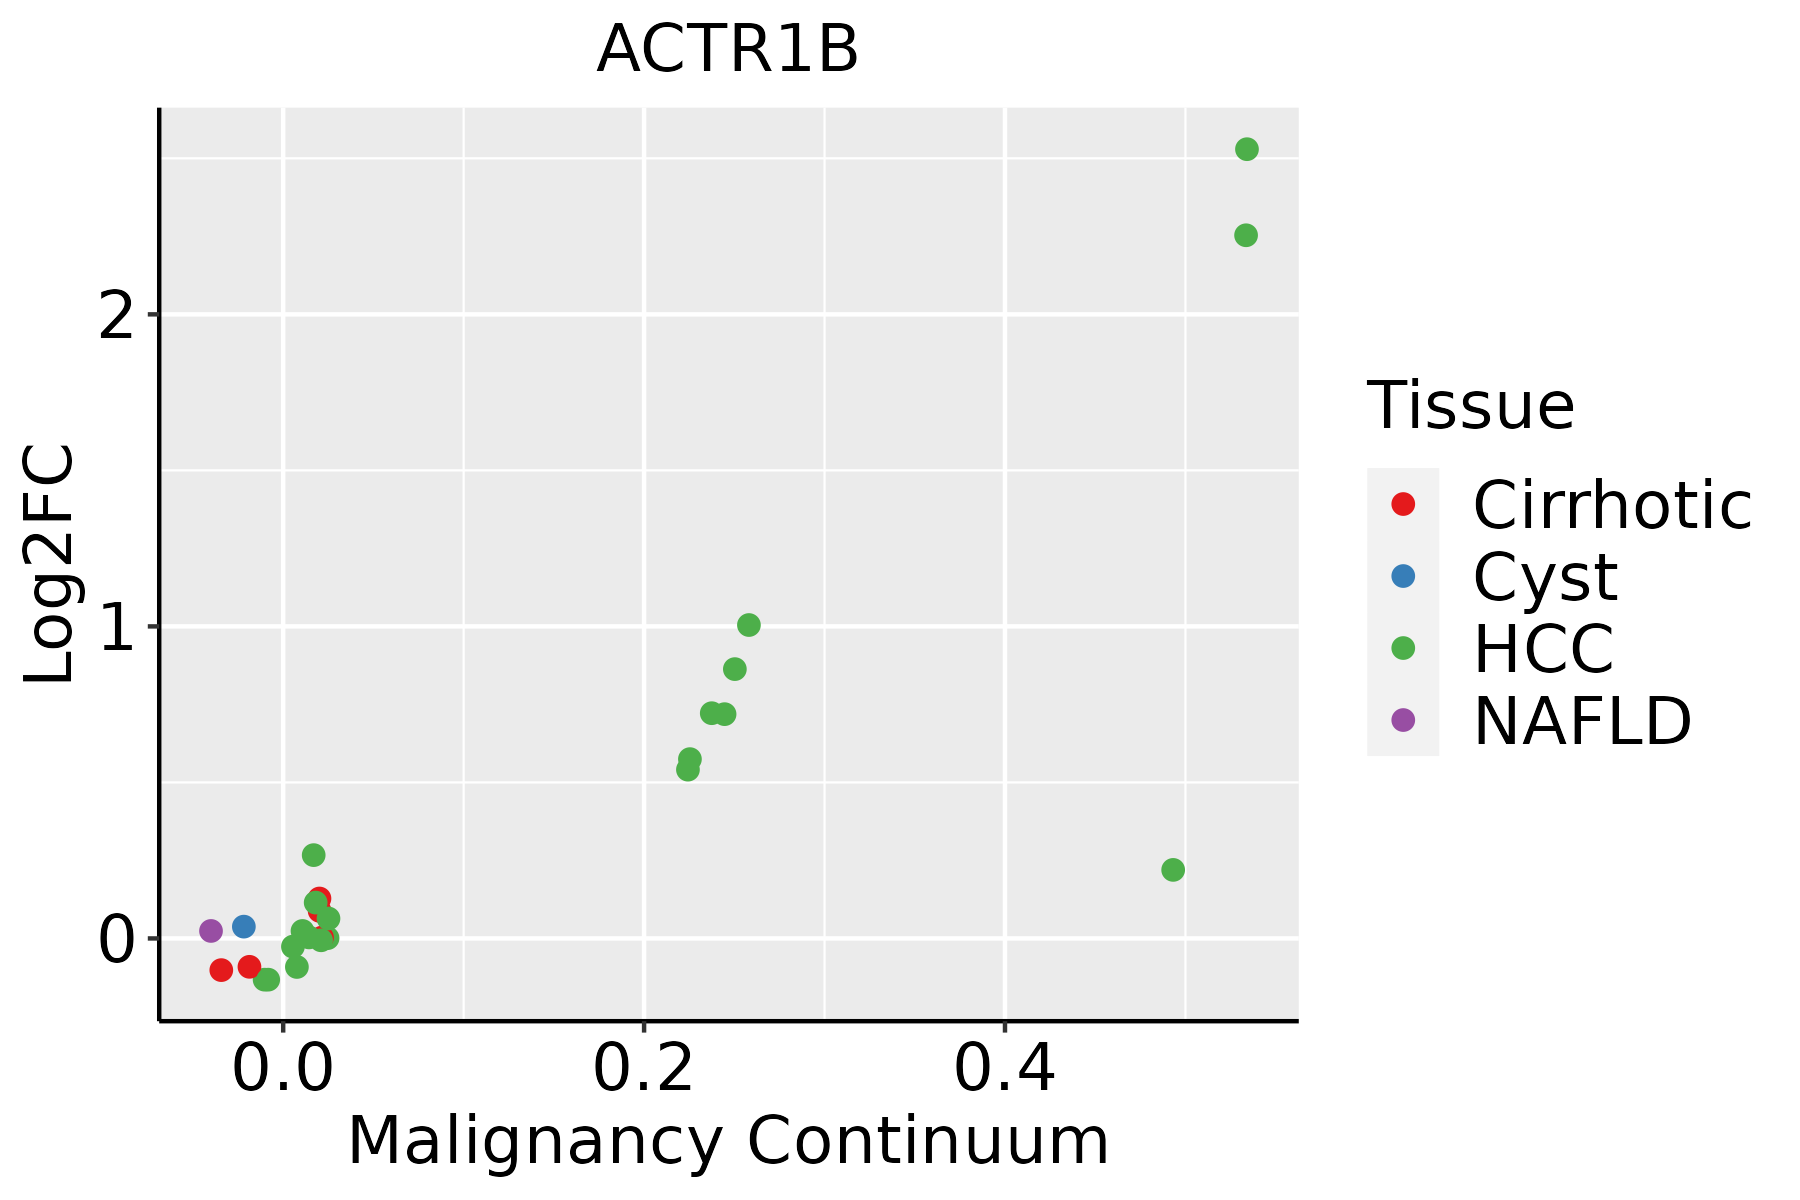 | HCC: Hepatocellular carcinoma |
| NAFLD: Non-alcoholic fatty liver disease | ||
| Oral Cavity | 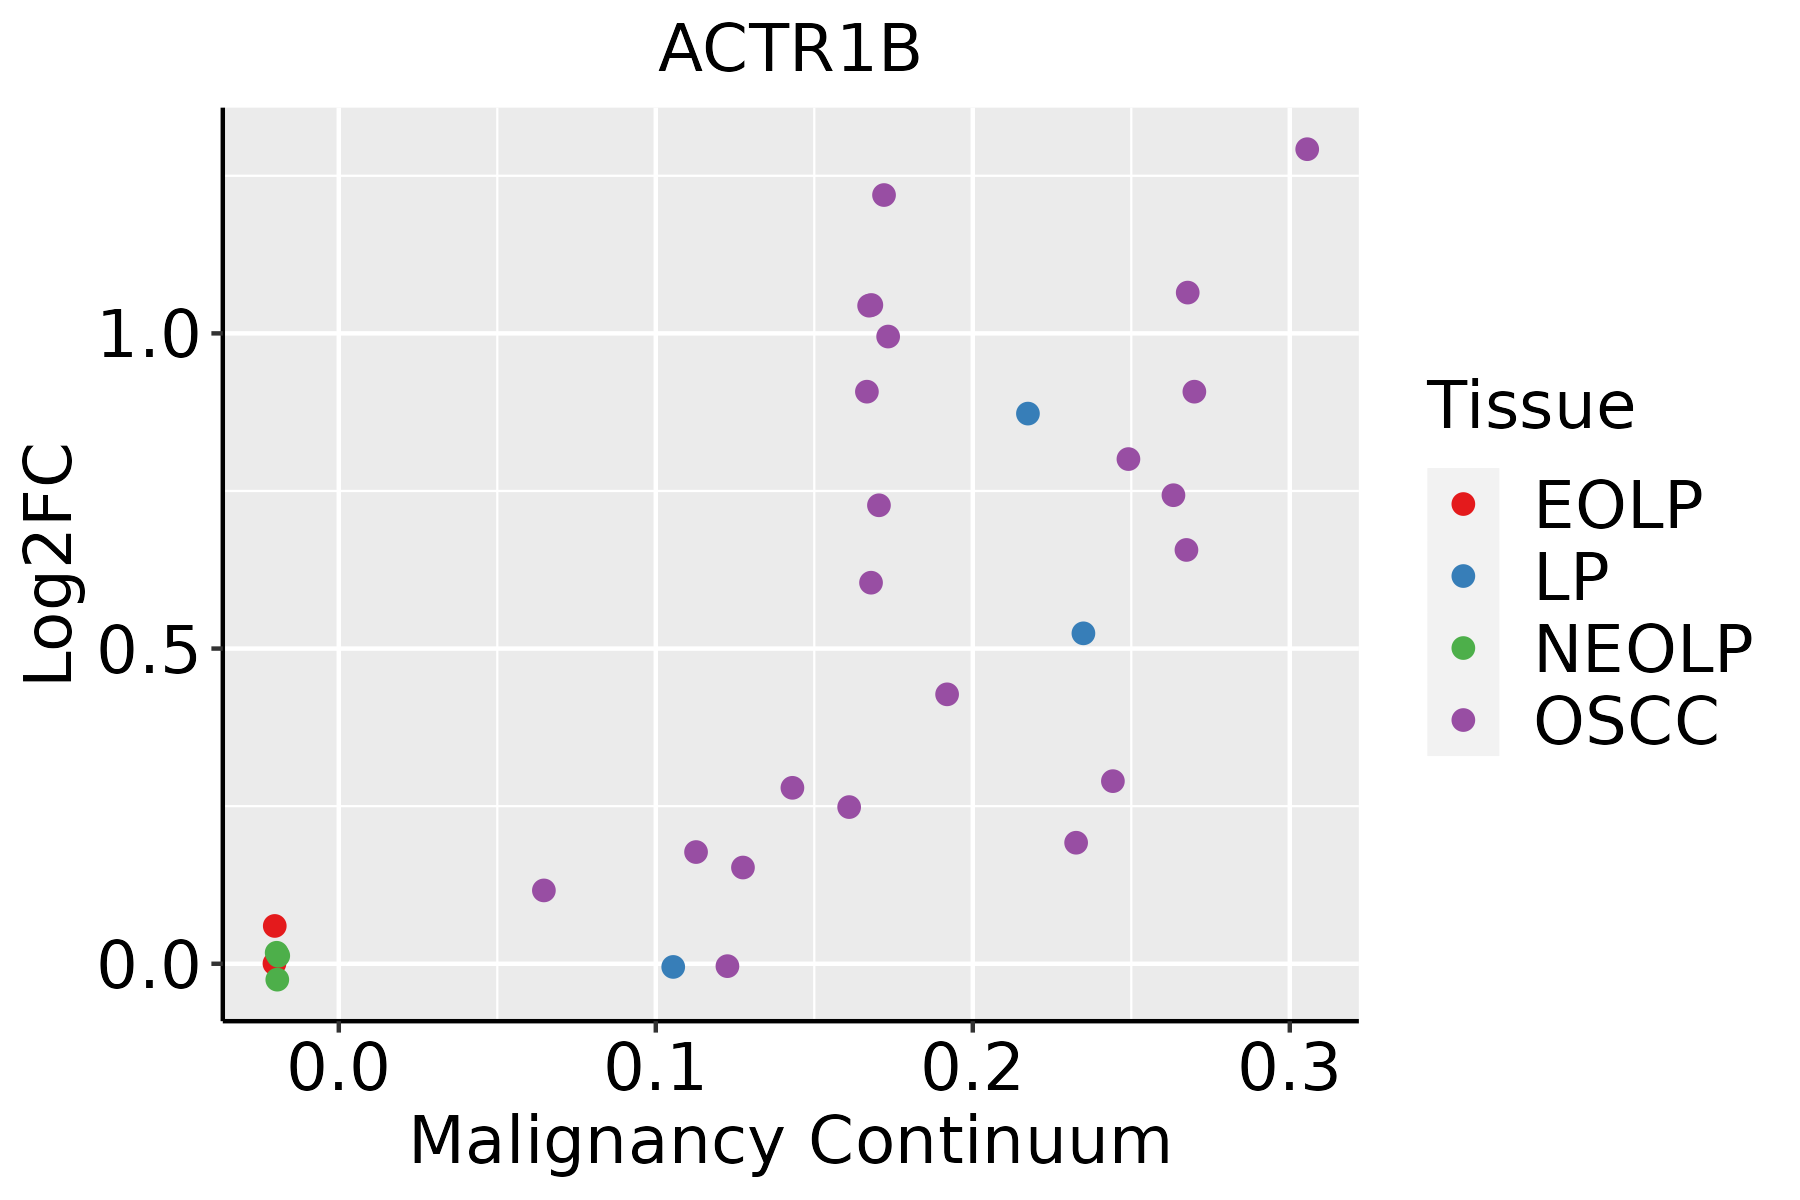 | EOLP: Erosive Oral lichen planus |
| LP: leukoplakia | ||
| NEOLP: Non-erosive oral lichen planus | ||
| OSCC: Oral squamous cell carcinoma | ||
| Thyroid | 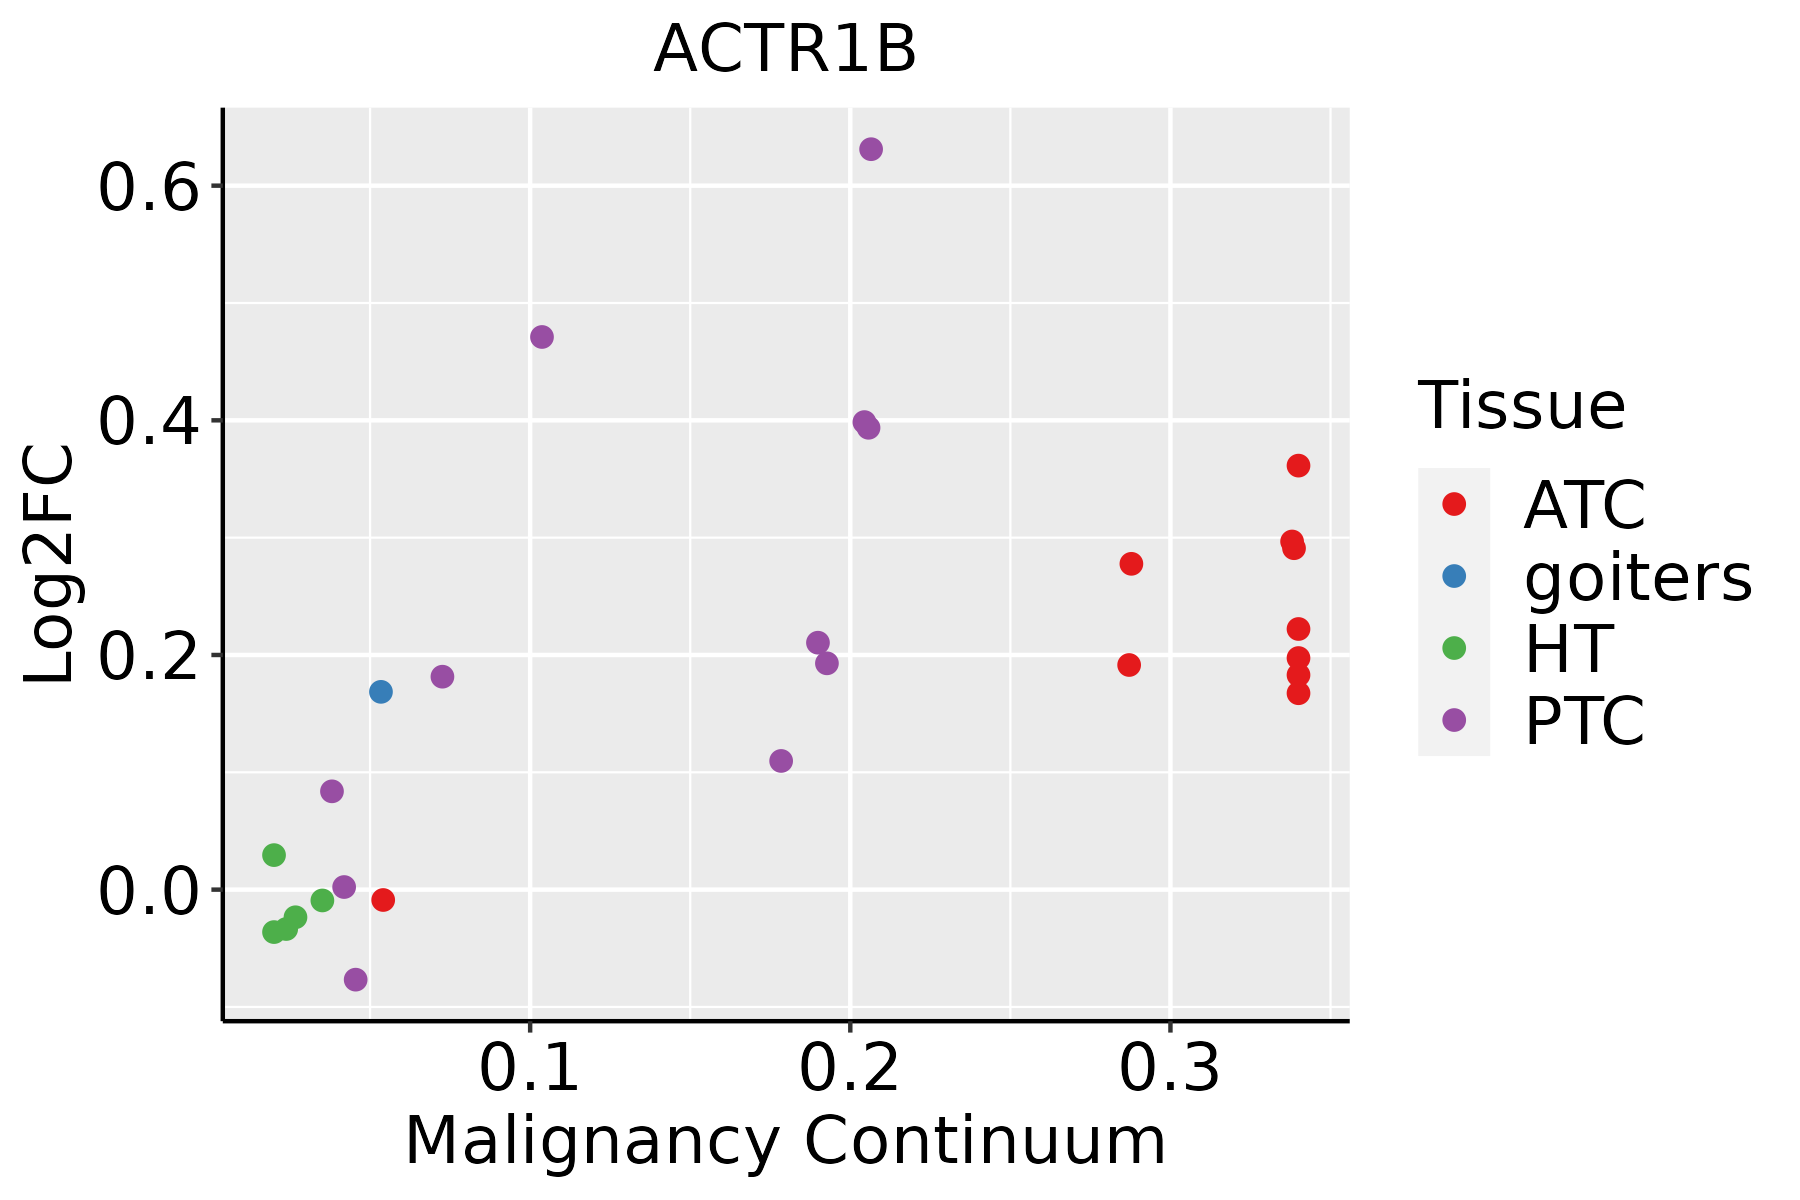 | ATC: Anaplastic thyroid cancer |
| HT: Hashimoto's thyroiditis | ||
| PTC: Papillary thyroid cancer |
| ∗log2FC in expression of this searched gene in stem-like cells from each diseased tissue sample relative to stem-like cells in normal samples in each tissue plotted against the malignancy continuum. Samples are colored based on if they are from different disease stage. |
Top |
Malignant transformation related pathway analysis |
| Find out the enriched GO biological processes and KEGG pathways involved in transition from healthy to precancer to cancer |
| Tissue | Disease Stage | Enriched GO biological Processes |
| Colorectum | AD |  |
| Colorectum | SER |  |
| Colorectum | MSS |  |
| Colorectum | MSI-H |  |
| Colorectum | FAP |  |
| ∗Top 15 enriched GO BP terms are showed in the bar plot of each disease state in each tissue. Each row represents a significant GO biological process which is colored according to the -log10(p.adjust). |
| Page: 1 2 3 4 5 6 7 8 9 |
| GO ID | Tissue | Disease Stage | Description | Gene Ratio | Bg Ratio | pvalue | p.adjust | Count |
| Page: 1 |
| Pathway ID | Tissue | Disease Stage | Description | Gene Ratio | Bg Ratio | pvalue | p.adjust | qvalue | Count |
| hsa05014210 | Esophagus | ESCC | Amyotrophic lateral sclerosis | 266/4205 | 364/8465 | 1.31e-20 | 2.20e-18 | 1.13e-18 | 266 |
| hsa05132211 | Esophagus | ESCC | Salmonella infection | 191/4205 | 249/8465 | 6.51e-19 | 5.45e-17 | 2.79e-17 | 191 |
| hsa05016210 | Esophagus | ESCC | Huntington disease | 226/4205 | 306/8465 | 1.38e-18 | 8.72e-17 | 4.46e-17 | 226 |
| hsa05022210 | Esophagus | ESCC | Pathways of neurodegeneration - multiple diseases | 318/4205 | 476/8465 | 6.10e-15 | 2.04e-13 | 1.05e-13 | 318 |
| hsa0501438 | Esophagus | ESCC | Amyotrophic lateral sclerosis | 266/4205 | 364/8465 | 1.31e-20 | 2.20e-18 | 1.13e-18 | 266 |
| hsa05132310 | Esophagus | ESCC | Salmonella infection | 191/4205 | 249/8465 | 6.51e-19 | 5.45e-17 | 2.79e-17 | 191 |
| hsa0501638 | Esophagus | ESCC | Huntington disease | 226/4205 | 306/8465 | 1.38e-18 | 8.72e-17 | 4.46e-17 | 226 |
| hsa0502238 | Esophagus | ESCC | Pathways of neurodegeneration - multiple diseases | 318/4205 | 476/8465 | 6.10e-15 | 2.04e-13 | 1.05e-13 | 318 |
| hsa0501614 | Liver | Cirrhotic | Huntington disease | 172/2530 | 306/8465 | 1.65e-22 | 1.10e-20 | 6.77e-21 | 172 |
| hsa0501414 | Liver | Cirrhotic | Amyotrophic lateral sclerosis | 187/2530 | 364/8465 | 1.56e-18 | 6.50e-17 | 4.01e-17 | 187 |
| hsa0502214 | Liver | Cirrhotic | Pathways of neurodegeneration - multiple diseases | 217/2530 | 476/8465 | 7.30e-14 | 2.03e-12 | 1.25e-12 | 217 |
| hsa0513222 | Liver | Cirrhotic | Salmonella infection | 121/2530 | 249/8465 | 2.47e-10 | 5.13e-09 | 3.16e-09 | 121 |
| hsa0501615 | Liver | Cirrhotic | Huntington disease | 172/2530 | 306/8465 | 1.65e-22 | 1.10e-20 | 6.77e-21 | 172 |
| hsa0501415 | Liver | Cirrhotic | Amyotrophic lateral sclerosis | 187/2530 | 364/8465 | 1.56e-18 | 6.50e-17 | 4.01e-17 | 187 |
| hsa0502215 | Liver | Cirrhotic | Pathways of neurodegeneration - multiple diseases | 217/2530 | 476/8465 | 7.30e-14 | 2.03e-12 | 1.25e-12 | 217 |
| hsa0513232 | Liver | Cirrhotic | Salmonella infection | 121/2530 | 249/8465 | 2.47e-10 | 5.13e-09 | 3.16e-09 | 121 |
| hsa0501622 | Liver | HCC | Huntington disease | 219/4020 | 306/8465 | 3.06e-18 | 3.42e-16 | 1.90e-16 | 219 |
| hsa0501422 | Liver | HCC | Amyotrophic lateral sclerosis | 252/4020 | 364/8465 | 8.85e-18 | 7.41e-16 | 4.12e-16 | 252 |
| hsa0513242 | Liver | HCC | Salmonella infection | 178/4020 | 249/8465 | 5.90e-15 | 1.98e-13 | 1.10e-13 | 178 |
| hsa0502222 | Liver | HCC | Pathways of neurodegeneration - multiple diseases | 298/4020 | 476/8465 | 6.59e-12 | 1.30e-10 | 7.22e-11 | 298 |
| Page: 1 2 |
Top |
Cell-cell communication analysis |
| Identification of potential cell-cell interactions between two cell types and their ligand-receptor pairs for different disease states |
| Ligand | Receptor | LRpair | Pathway | Tissue | Disease Stage |
| Page: 1 |
Top |
Single-cell gene regulatory network inference analysis |
| Find out the significant the regulons (TFs) and the target genes of each regulon across cell types for different disease states |
| TF | Cell Type | Tissue | Disease Stage | Target Gene | RSS | Regulon Activity |
| ∗The dot plots of a searched regulon are shown for all cell subpopulations in each disease state of each tissue based on the regulon specific score inferred using pySCENIC and by calculating the average expression. |
| Page: 1 |
Top |
Somatic mutation of malignant transformation related genes |
| Annotation of somatic variants for genes involved in malignant transformation |
| Hugo Symbol | Variant Class | Variant Classification | dbSNP RS | HGVSc | HGVSp | HGVSp Short | SWISSPROT | BIOTYPE | SIFT | PolyPhen | Tumor Sample Barcode | Tissue | Histology | Sex | Age | Stage | Therapy Types | Drugs | Outcome |
| ACTR1B | SNV | Missense_Mutation | novel | c.651N>G | p.Ile217Met | p.I217M | P42025 | protein_coding | tolerated(0.1) | benign(0.383) | TCGA-A7-A4SE-01 | Breast | breast invasive carcinoma | Female | <65 | I/II | Chemotherapy | adriamycin | CR |
| ACTR1B | SNV | Missense_Mutation | c.947N>A | p.Ser316Asn | p.S316N | P42025 | protein_coding | tolerated(0.28) | benign(0.009) | TCGA-BH-A0HF-01 | Breast | breast invasive carcinoma | Female | >=65 | I/II | Hormone Therapy | arimidex | SD | |
| ACTR1B | insertion | Frame_Shift_Ins | novel | c.253_254insCC | p.Asp85AlafsTer75 | p.D85Afs*75 | P42025 | protein_coding | TCGA-AN-A0FX-01 | Breast | breast invasive carcinoma | Female | <65 | I/II | Unknown | Unknown | SD | ||
| ACTR1B | insertion | Nonsense_Mutation | novel | c.251_252insGGGATGGGGCCCTCAGGAGGGGTAGGAGGCTGAGCTGCCTGTG | p.Asn84LysfsTer9 | p.N84Kfs*9 | P42025 | protein_coding | TCGA-AN-A0FX-01 | Breast | breast invasive carcinoma | Female | <65 | I/II | Unknown | Unknown | SD | ||
| ACTR1B | deletion | Frame_Shift_Del | novel | c.716delT | p.Val239GlyfsTer80 | p.V239Gfs*80 | P42025 | protein_coding | TCGA-D8-A27V-01 | Breast | breast invasive carcinoma | Female | <65 | I/II | Hormone Therapy | tamoxiphen | SD | ||
| ACTR1B | SNV | Missense_Mutation | rs559419020 | c.1106N>A | p.Arg369His | p.R369H | P42025 | protein_coding | deleterious(0.02) | probably_damaging(0.937) | TCGA-A6-2686-01 | Colorectum | colon adenocarcinoma | Female | >=65 | I/II | Unknown | Unknown | SD |
| ACTR1B | SNV | Missense_Mutation | c.662C>T | p.Ala221Val | p.A221V | P42025 | protein_coding | tolerated(0.16) | benign(0.009) | TCGA-AA-3510-01 | Colorectum | colon adenocarcinoma | Male | >=65 | I/II | Unknown | Unknown | SD | |
| ACTR1B | SNV | Missense_Mutation | novel | c.815N>C | p.Ser272Thr | p.S272T | P42025 | protein_coding | tolerated(0.35) | benign(0) | TCGA-AA-3673-01 | Colorectum | colon adenocarcinoma | Female | <65 | I/II | Unknown | Unknown | SD |
| ACTR1B | SNV | Missense_Mutation | c.199N>T | p.Gly67Trp | p.G67W | P42025 | protein_coding | deleterious(0) | probably_damaging(1) | TCGA-AA-3697-01 | Colorectum | colon adenocarcinoma | Male | >=65 | I/II | Unknown | Unknown | SD | |
| ACTR1B | SNV | Missense_Mutation | rs372634354 | c.263N>A | p.Arg88His | p.R88H | P42025 | protein_coding | tolerated(0.09) | benign(0.027) | TCGA-AA-3715-01 | Colorectum | colon adenocarcinoma | Male | >=65 | I/II | Unknown | Unknown | PD |
| Page: 1 2 3 4 5 |
Top |
Related drugs of malignant transformation related genes |
| Identification of chemicals and drugs interact with genes involved in malignant transfromation |
| (DGIdb 4.0) |
| Entrez ID | Symbol | Category | Interaction Types | Drug Claim Name | Drug Name | PMIDs |
| Page: 1 |

Copyright 2023-Present -The University of Texas Health Science Center at Houston |