
|
|||||
|
 | |
| |
| |
| |
| |
| |
|
Gene: ACTR1A |
Gene summary for ACTR1A |
| Gene information | Species | Human | Gene symbol | ACTR1A | Gene ID | 10121 |
| Gene name | actin related protein 1A | |
| Gene Alias | ARP1 | |
| Cytomap | 10q24.32 | |
| Gene Type | protein-coding | GO ID | GO:0000003 | UniProtAcc | P61163 |
Top |
Malignant transformation analysis |
| Identification of the aberrant gene expression in precancerous and cancerous lesions by comparing the gene expression of stem-like cells in diseased tissues with normal stem cells |
| Entrez ID | Symbol | Replicates | Species | Organ | Tissue | Adj P-value | Log2FC | Malignancy |
| 10121 | ACTR1A | HTA11_2487_2000001011 | Human | Colorectum | SER | 1.16e-03 | 2.93e-01 | -0.1808 |
| 10121 | ACTR1A | HTA11_1938_2000001011 | Human | Colorectum | AD | 4.39e-03 | 2.00e-01 | -0.0811 |
| 10121 | ACTR1A | HTA11_347_2000001011 | Human | Colorectum | AD | 7.96e-05 | 2.45e-01 | -0.1954 |
| 10121 | ACTR1A | HTA11_696_2000001011 | Human | Colorectum | AD | 1.52e-02 | 2.36e-01 | -0.1464 |
| 10121 | ACTR1A | HTA11_1391_2000001011 | Human | Colorectum | AD | 1.44e-05 | 3.12e-01 | -0.059 |
| 10121 | ACTR1A | HTA11_99999965062_69753 | Human | Colorectum | MSI-H | 9.59e-03 | 6.79e-01 | 0.3487 |
| 10121 | ACTR1A | HTA11_99999965104_69814 | Human | Colorectum | MSS | 3.86e-03 | 2.63e-01 | 0.281 |
| 10121 | ACTR1A | LZE4T | Human | Esophagus | ESCC | 3.31e-10 | 3.31e-01 | 0.0811 |
| 10121 | ACTR1A | LZE5T | Human | Esophagus | ESCC | 2.13e-09 | 4.22e-01 | 0.0514 |
| 10121 | ACTR1A | LZE7T | Human | Esophagus | ESCC | 1.61e-04 | 4.28e-01 | 0.0667 |
| 10121 | ACTR1A | LZE8T | Human | Esophagus | ESCC | 6.68e-07 | 3.03e-01 | 0.067 |
| 10121 | ACTR1A | LZE20T | Human | Esophagus | ESCC | 1.10e-02 | 2.97e-01 | 0.0662 |
| 10121 | ACTR1A | LZE22T | Human | Esophagus | ESCC | 4.21e-04 | 2.96e-01 | 0.068 |
| 10121 | ACTR1A | LZE24T | Human | Esophagus | ESCC | 7.71e-30 | 8.14e-01 | 0.0596 |
| 10121 | ACTR1A | LZE6T | Human | Esophagus | ESCC | 8.55e-11 | 5.22e-01 | 0.0845 |
| 10121 | ACTR1A | P1T-E | Human | Esophagus | ESCC | 1.78e-05 | 4.02e-01 | 0.0875 |
| 10121 | ACTR1A | P2T-E | Human | Esophagus | ESCC | 8.41e-39 | 7.55e-01 | 0.1177 |
| 10121 | ACTR1A | P4T-E | Human | Esophagus | ESCC | 1.99e-28 | 8.61e-01 | 0.1323 |
| 10121 | ACTR1A | P5T-E | Human | Esophagus | ESCC | 5.89e-26 | 6.56e-01 | 0.1327 |
| 10121 | ACTR1A | P8T-E | Human | Esophagus | ESCC | 1.05e-20 | 4.22e-01 | 0.0889 |
| Page: 1 2 3 4 5 6 7 |
| Tissue | Expression Dynamics | Abbreviation |
| Colorectum (GSE201348) |  | FAP: Familial adenomatous polyposis |
| CRC: Colorectal cancer | ||
| Colorectum (HTA11) |  | AD: Adenomas |
| SER: Sessile serrated lesions | ||
| MSI-H: Microsatellite-high colorectal cancer | ||
| MSS: Microsatellite stable colorectal cancer | ||
| Esophagus |  | ESCC: Esophageal squamous cell carcinoma |
| HGIN: High-grade intraepithelial neoplasias | ||
| LGIN: Low-grade intraepithelial neoplasias | ||
| Liver | 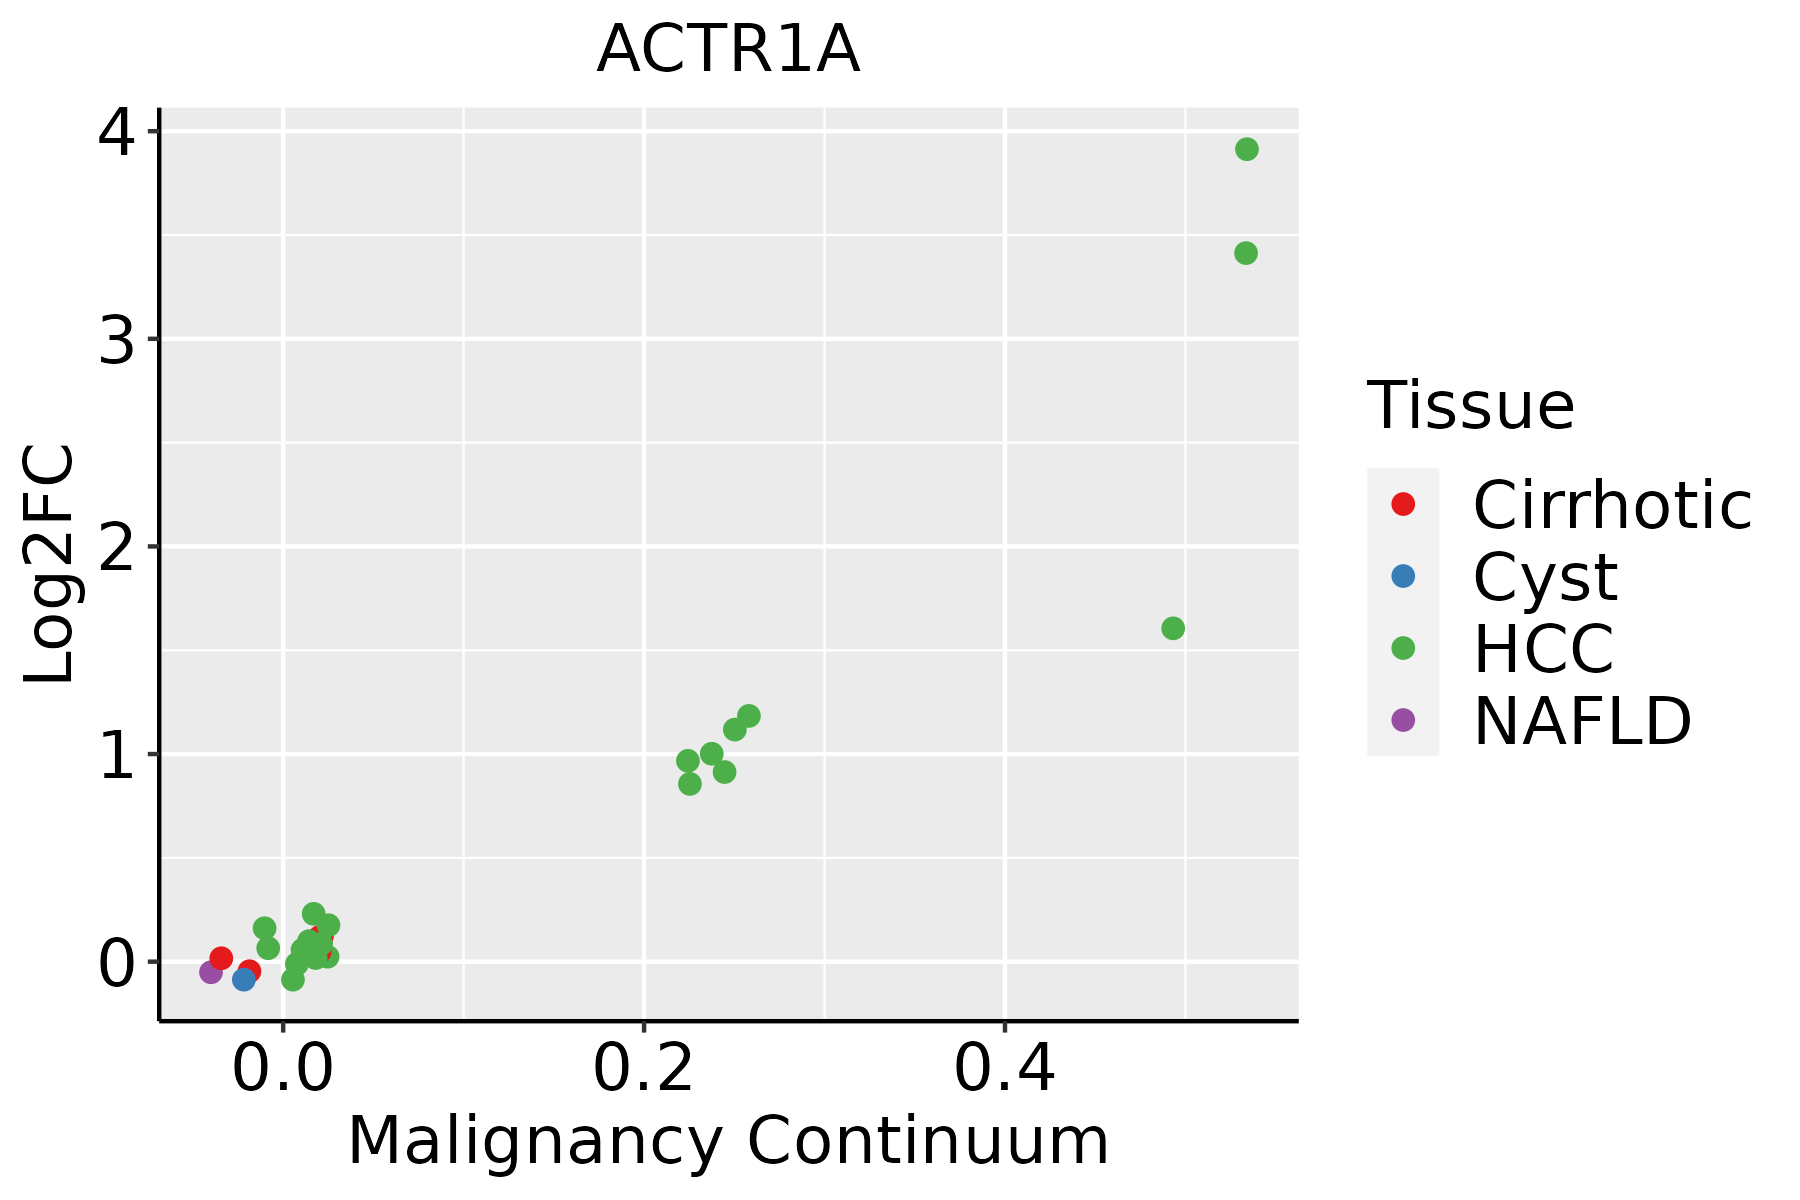 | HCC: Hepatocellular carcinoma |
| NAFLD: Non-alcoholic fatty liver disease | ||
| Oral Cavity |  | EOLP: Erosive Oral lichen planus |
| LP: leukoplakia | ||
| NEOLP: Non-erosive oral lichen planus | ||
| OSCC: Oral squamous cell carcinoma | ||
| Skin |  | AK: Actinic keratosis |
| cSCC: Cutaneous squamous cell carcinoma | ||
| SCCIS:squamous cell carcinoma in situ | ||
| Thyroid | 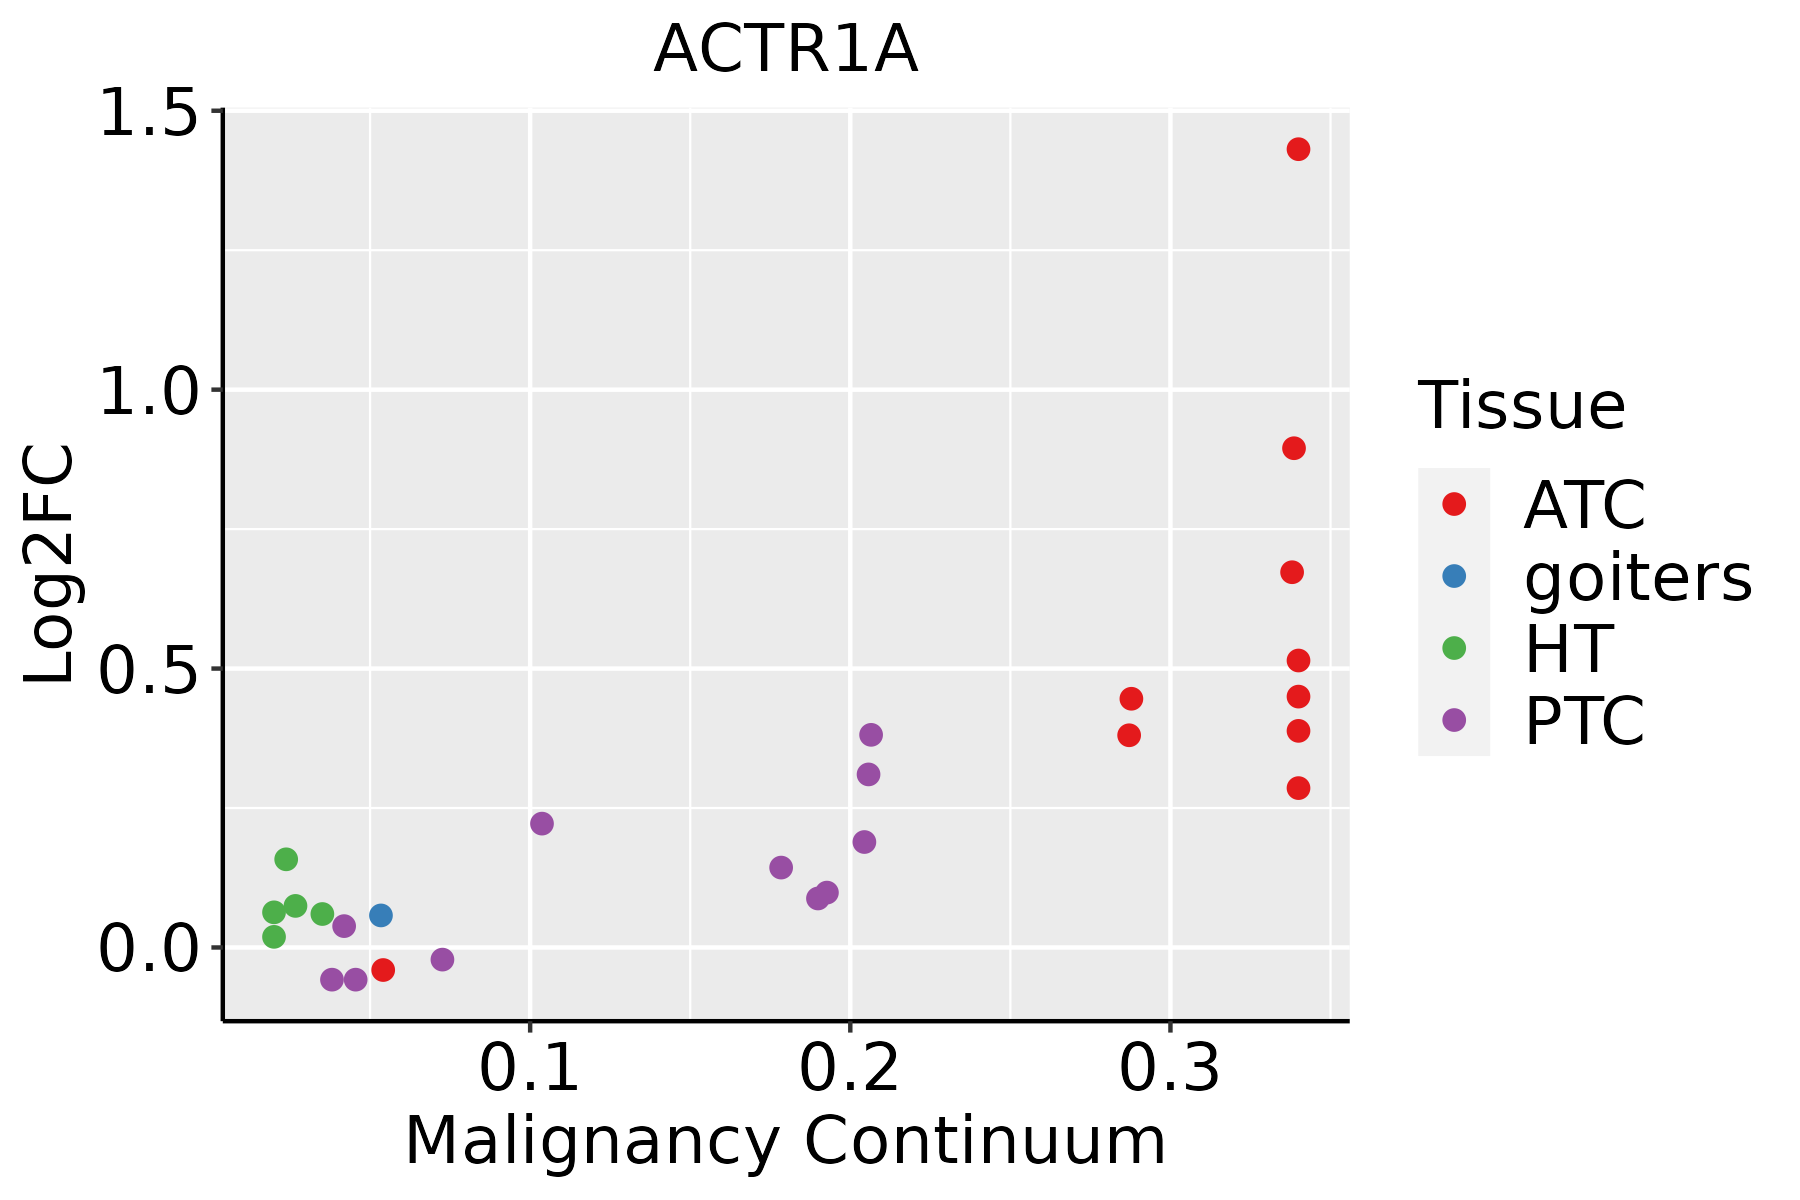 | ATC: Anaplastic thyroid cancer |
| HT: Hashimoto's thyroiditis | ||
| PTC: Papillary thyroid cancer |
| ∗log2FC in expression of this searched gene in stem-like cells from each diseased tissue sample relative to stem-like cells in normal samples in each tissue plotted against the malignancy continuum. Samples are colored based on if they are from different disease stage. |
Top |
Malignant transformation related pathway analysis |
| Find out the enriched GO biological processes and KEGG pathways involved in transition from healthy to precancer to cancer |
| Tissue | Disease Stage | Enriched GO biological Processes |
| Colorectum | AD |  |
| Colorectum | SER |  |
| Colorectum | MSS |  |
| Colorectum | MSI-H |  |
| Colorectum | FAP |  |
| ∗Top 15 enriched GO BP terms are showed in the bar plot of each disease state in each tissue. Each row represents a significant GO biological process which is colored according to the -log10(p.adjust). |
| Page: 1 2 3 4 5 6 7 8 9 |
| GO ID | Tissue | Disease Stage | Description | Gene Ratio | Bg Ratio | pvalue | p.adjust | Count |
| Page: 1 |
| Pathway ID | Tissue | Disease Stage | Description | Gene Ratio | Bg Ratio | pvalue | p.adjust | qvalue | Count |
| hsa05016 | Colorectum | AD | Huntington disease | 147/2092 | 306/8465 | 1.93e-19 | 9.26e-18 | 5.91e-18 | 147 |
| hsa05014 | Colorectum | AD | Amyotrophic lateral sclerosis | 164/2092 | 364/8465 | 4.28e-18 | 1.27e-16 | 8.09e-17 | 164 |
| hsa05022 | Colorectum | AD | Pathways of neurodegeneration - multiple diseases | 201/2092 | 476/8465 | 4.54e-18 | 1.27e-16 | 8.09e-17 | 201 |
| hsa05132 | Colorectum | AD | Salmonella infection | 102/2092 | 249/8465 | 7.65e-09 | 1.28e-07 | 8.17e-08 | 102 |
| hsa050161 | Colorectum | AD | Huntington disease | 147/2092 | 306/8465 | 1.93e-19 | 9.26e-18 | 5.91e-18 | 147 |
| hsa050141 | Colorectum | AD | Amyotrophic lateral sclerosis | 164/2092 | 364/8465 | 4.28e-18 | 1.27e-16 | 8.09e-17 | 164 |
| hsa050221 | Colorectum | AD | Pathways of neurodegeneration - multiple diseases | 201/2092 | 476/8465 | 4.54e-18 | 1.27e-16 | 8.09e-17 | 201 |
| hsa051321 | Colorectum | AD | Salmonella infection | 102/2092 | 249/8465 | 7.65e-09 | 1.28e-07 | 8.17e-08 | 102 |
| hsa050142 | Colorectum | SER | Amyotrophic lateral sclerosis | 138/1580 | 364/8465 | 9.89e-19 | 2.99e-17 | 2.17e-17 | 138 |
| hsa051322 | Colorectum | SER | Salmonella infection | 77/1580 | 249/8465 | 1.56e-06 | 2.35e-05 | 1.71e-05 | 77 |
| hsa050143 | Colorectum | SER | Amyotrophic lateral sclerosis | 138/1580 | 364/8465 | 9.89e-19 | 2.99e-17 | 2.17e-17 | 138 |
| hsa051323 | Colorectum | SER | Salmonella infection | 77/1580 | 249/8465 | 1.56e-06 | 2.35e-05 | 1.71e-05 | 77 |
| hsa050164 | Colorectum | MSS | Huntington disease | 141/1875 | 306/8465 | 2.90e-21 | 1.62e-19 | 9.92e-20 | 141 |
| hsa050224 | Colorectum | MSS | Pathways of neurodegeneration - multiple diseases | 192/1875 | 476/8465 | 2.79e-20 | 1.04e-18 | 6.36e-19 | 192 |
| hsa050144 | Colorectum | MSS | Amyotrophic lateral sclerosis | 156/1875 | 364/8465 | 1.43e-19 | 4.62e-18 | 2.83e-18 | 156 |
| hsa051324 | Colorectum | MSS | Salmonella infection | 92/1875 | 249/8465 | 5.23e-08 | 9.74e-07 | 5.97e-07 | 92 |
| hsa050165 | Colorectum | MSS | Huntington disease | 141/1875 | 306/8465 | 2.90e-21 | 1.62e-19 | 9.92e-20 | 141 |
| hsa050225 | Colorectum | MSS | Pathways of neurodegeneration - multiple diseases | 192/1875 | 476/8465 | 2.79e-20 | 1.04e-18 | 6.36e-19 | 192 |
| hsa050145 | Colorectum | MSS | Amyotrophic lateral sclerosis | 156/1875 | 364/8465 | 1.43e-19 | 4.62e-18 | 2.83e-18 | 156 |
| hsa051325 | Colorectum | MSS | Salmonella infection | 92/1875 | 249/8465 | 5.23e-08 | 9.74e-07 | 5.97e-07 | 92 |
| Page: 1 2 3 4 |
Top |
Cell-cell communication analysis |
| Identification of potential cell-cell interactions between two cell types and their ligand-receptor pairs for different disease states |
| Ligand | Receptor | LRpair | Pathway | Tissue | Disease Stage |
| Page: 1 |
Top |
Single-cell gene regulatory network inference analysis |
| Find out the significant the regulons (TFs) and the target genes of each regulon across cell types for different disease states |
| TF | Cell Type | Tissue | Disease Stage | Target Gene | RSS | Regulon Activity |
| ∗The dot plots of a searched regulon are shown for all cell subpopulations in each disease state of each tissue based on the regulon specific score inferred using pySCENIC and by calculating the average expression. |
| Page: 1 |
Top |
Somatic mutation of malignant transformation related genes |
| Annotation of somatic variants for genes involved in malignant transformation |
| Hugo Symbol | Variant Class | Variant Classification | dbSNP RS | HGVSc | HGVSp | HGVSp Short | SWISSPROT | BIOTYPE | SIFT | PolyPhen | Tumor Sample Barcode | Tissue | Histology | Sex | Age | Stage | Therapy Types | Drugs | Outcome |
| ACTR1A | SNV | Missense_Mutation | c.1109C>T | p.Ser370Phe | p.S370F | P61163 | protein_coding | deleterious(0.01) | benign(0.218) | TCGA-BH-A18G-01 | Breast | breast invasive carcinoma | Female | >=65 | I/II | Unknown | Unknown | SD | |
| ACTR1A | SNV | Missense_Mutation | c.806N>A | p.Gly269Glu | p.G269E | P61163 | protein_coding | deleterious(0) | probably_damaging(0.989) | TCGA-C8-A12Q-01 | Breast | breast invasive carcinoma | Female | >=65 | III/IV | Unknown | Unknown | PD | |
| ACTR1A | SNV | Missense_Mutation | c.53N>G | p.Ser18Cys | p.S18C | P61163 | protein_coding | deleterious(0) | probably_damaging(0.993) | TCGA-C8-A26V-01 | Breast | breast invasive carcinoma | Female | <65 | III/IV | Hormone Therapy | tamoxiphen | CR | |
| ACTR1A | insertion | Nonsense_Mutation | novel | c.211_212insACCTATGTCTTTTAGAATTCAAAGCCTGTGCTCATTAACTTCTT | p.Ile71AsnfsTer13 | p.I71Nfs*13 | P61163 | protein_coding | TCGA-A8-A08H-01 | Breast | breast invasive carcinoma | Female | >=65 | I/II | Unknown | Unknown | SD | ||
| ACTR1A | SNV | Missense_Mutation | c.655N>C | p.Glu219Gln | p.E219Q | P61163 | protein_coding | deleterious(0.02) | probably_damaging(0.999) | TCGA-EK-A2R8-01 | Cervix | cervical & endocervical cancer | Female | <65 | I/II | Unknown | Unknown | SD | |
| ACTR1A | SNV | Missense_Mutation | c.514N>A | p.Glu172Lys | p.E172K | P61163 | protein_coding | deleterious(0.01) | benign(0.167) | TCGA-IR-A3LK-01 | Cervix | cervical & endocervical cancer | Female | >=65 | I/II | Chemotherapy | cisplatin | PD | |
| ACTR1A | SNV | Missense_Mutation | rs764802984 | c.238N>A | p.Val80Ile | p.V80I | P61163 | protein_coding | tolerated(0.18) | benign(0.026) | TCGA-A6-5661-01 | Colorectum | colon adenocarcinoma | Female | >=65 | I/II | Unknown | Unknown | SD |
| ACTR1A | SNV | Missense_Mutation | c.1099N>A | p.Gly367Ser | p.G367S | P61163 | protein_coding | deleterious(0.04) | probably_damaging(0.927) | TCGA-AA-3492-01 | Colorectum | colon adenocarcinoma | Female | >=65 | I/II | Unknown | Unknown | SD | |
| ACTR1A | SNV | Missense_Mutation | novel | c.842N>G | p.Phe281Cys | p.F281C | P61163 | protein_coding | tolerated(0.09) | possibly_damaging(0.762) | TCGA-AA-3984-01 | Colorectum | colon adenocarcinoma | Female | <65 | I/II | Unknown | Unknown | SD |
| ACTR1A | SNV | Missense_Mutation | novel | c.106N>T | p.Pro36Ser | p.P36S | P61163 | protein_coding | tolerated(0.09) | benign(0.018) | TCGA-AA-3984-01 | Colorectum | colon adenocarcinoma | Female | <65 | I/II | Unknown | Unknown | SD |
| Page: 1 2 3 4 5 |
Top |
Related drugs of malignant transformation related genes |
| Identification of chemicals and drugs interact with genes involved in malignant transfromation |
| (DGIdb 4.0) |
| Entrez ID | Symbol | Category | Interaction Types | Drug Claim Name | Drug Name | PMIDs |
| Page: 1 |

Copyright 2023-Present -The University of Texas Health Science Center at Houston |