
|
|||||
|
 | |
| |
| |
| |
| |
| |
|
Gene: ACTN1 |
Gene summary for ACTN1 |
| Gene information | Species | Human | Gene symbol | ACTN1 | Gene ID | 87 |
| Gene name | actinin alpha 1 | |
| Gene Alias | BDPLT15 | |
| Cytomap | 14q24.1 | |
| Gene Type | protein-coding | GO ID | GO:0000902 | UniProtAcc | A0A024R694 |
Top |
Malignant transformation analysis |
| Identification of the aberrant gene expression in precancerous and cancerous lesions by comparing the gene expression of stem-like cells in diseased tissues with normal stem cells |
| Entrez ID | Symbol | Replicates | Species | Organ | Tissue | Adj P-value | Log2FC | Malignancy |
| 87 | ACTN1 | GSM4909294 | Human | Breast | IDC | 6.38e-12 | -4.65e-01 | 0.2022 |
| 87 | ACTN1 | GSM4909296 | Human | Breast | IDC | 2.94e-11 | -3.28e-01 | 0.1524 |
| 87 | ACTN1 | GSM4909297 | Human | Breast | IDC | 5.28e-15 | -3.99e-01 | 0.1517 |
| 87 | ACTN1 | GSM4909301 | Human | Breast | IDC | 1.89e-05 | -3.89e-01 | 0.1577 |
| 87 | ACTN1 | GSM4909308 | Human | Breast | IDC | 2.29e-04 | -3.35e-01 | 0.158 |
| 87 | ACTN1 | GSM4909311 | Human | Breast | IDC | 4.13e-25 | -4.56e-01 | 0.1534 |
| 87 | ACTN1 | GSM4909312 | Human | Breast | IDC | 1.03e-07 | -3.28e-01 | 0.1552 |
| 87 | ACTN1 | GSM4909319 | Human | Breast | IDC | 3.45e-29 | -4.62e-01 | 0.1563 |
| 87 | ACTN1 | GSM4909320 | Human | Breast | IDC | 7.53e-05 | -4.58e-01 | 0.1575 |
| 87 | ACTN1 | GSM4909321 | Human | Breast | IDC | 1.01e-23 | -5.32e-01 | 0.1559 |
| 87 | ACTN1 | brca1 | Human | Breast | Precancer | 4.26e-18 | 5.40e-01 | -0.0338 |
| 87 | ACTN1 | brca2 | Human | Breast | Precancer | 4.66e-09 | 3.88e-01 | -0.024 |
| 87 | ACTN1 | brca3 | Human | Breast | Precancer | 1.43e-26 | 6.08e-01 | -0.0263 |
| 87 | ACTN1 | NCCBC14 | Human | Breast | DCIS | 1.46e-06 | -1.09e-01 | 0.2021 |
| 87 | ACTN1 | NCCBC5 | Human | Breast | DCIS | 5.86e-14 | -4.65e-01 | 0.2046 |
| 87 | ACTN1 | P1 | Human | Breast | IDC | 6.54e-14 | -4.20e-01 | 0.1527 |
| 87 | ACTN1 | P2 | Human | Breast | IDC | 2.22e-04 | -1.94e-01 | 0.21 |
| 87 | ACTN1 | DCIS2 | Human | Breast | DCIS | 4.20e-55 | 3.80e-01 | 0.0085 |
| 87 | ACTN1 | Tumor | Human | Cervix | CC | 1.51e-11 | 4.85e-01 | 0.1241 |
| 87 | ACTN1 | sample3 | Human | Cervix | CC | 7.81e-15 | 5.33e-01 | 0.1387 |
| Page: 1 2 3 4 5 6 7 8 9 10 |
| Tissue | Expression Dynamics | Abbreviation |
| Breast | 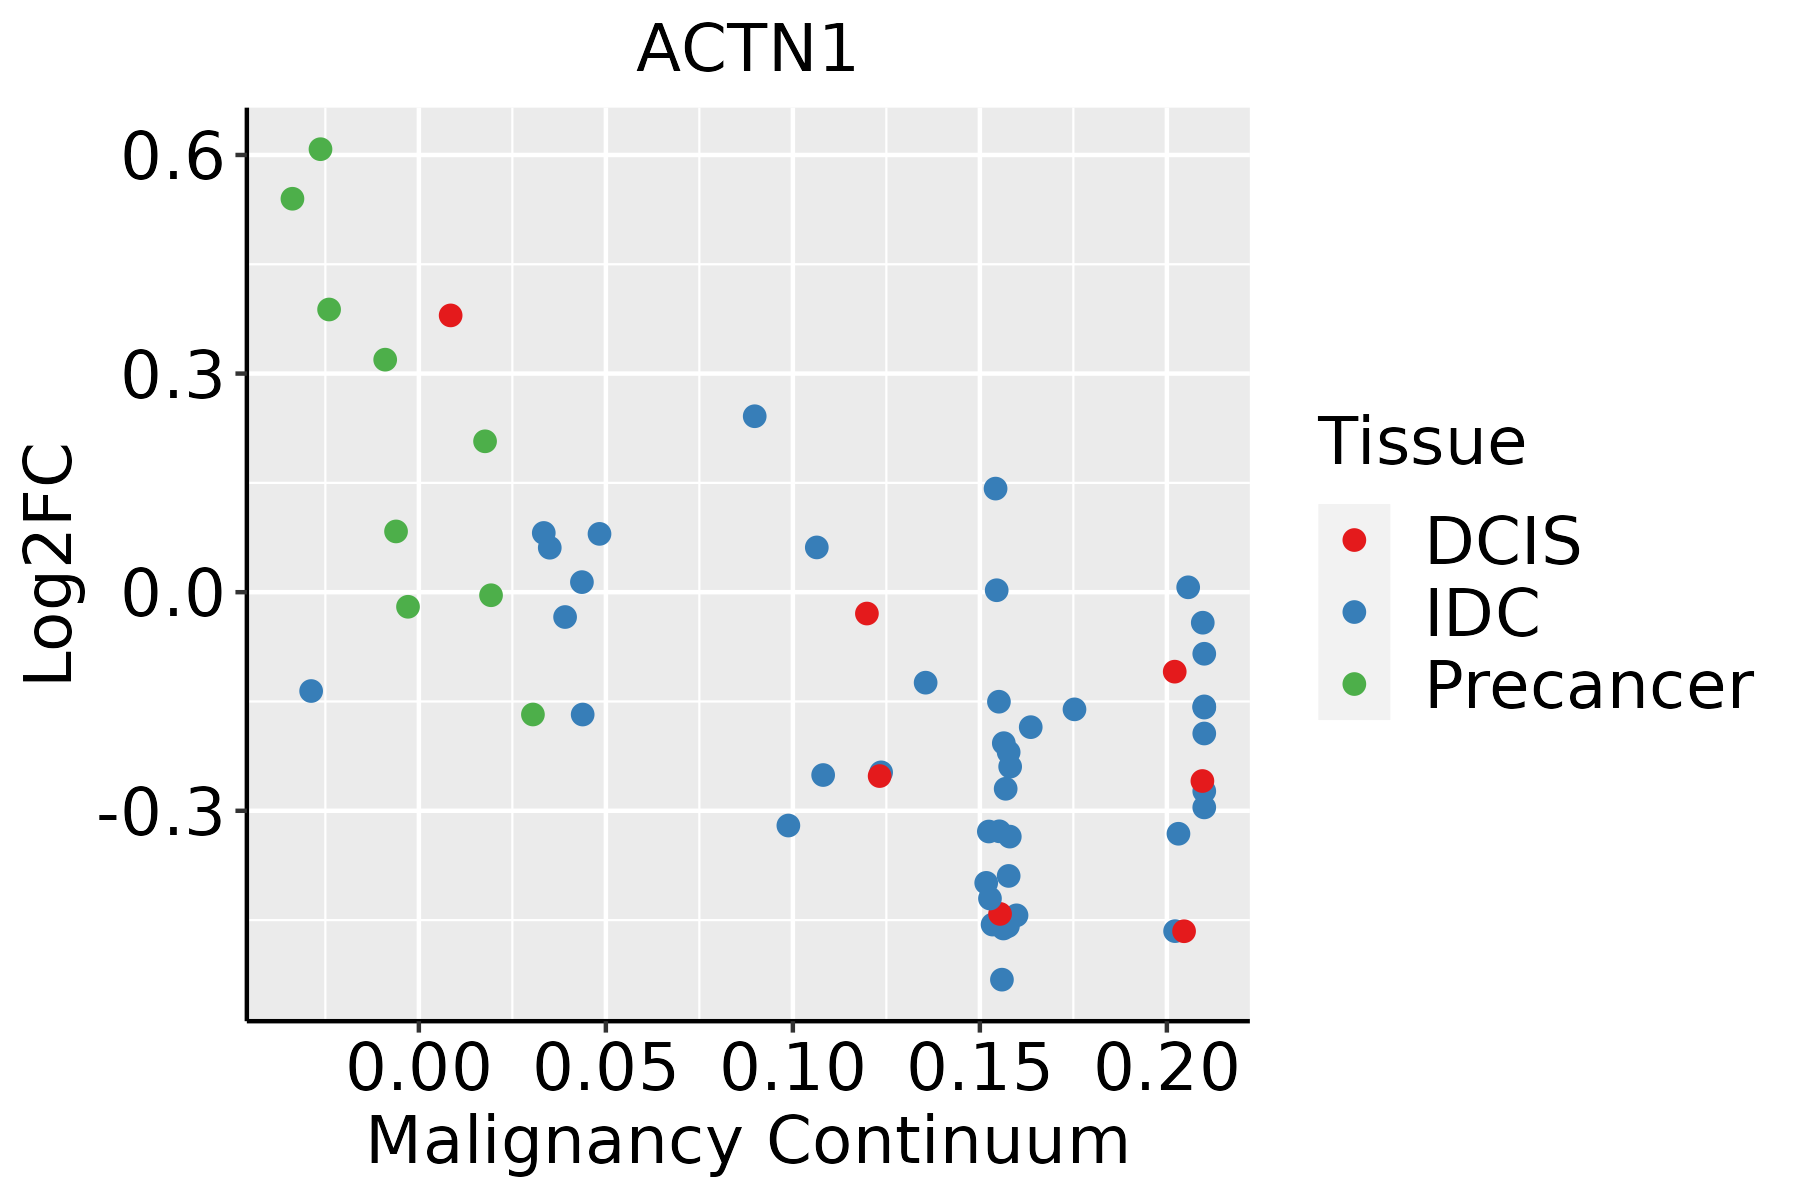 | IDC: Invasive ductal carcinoma |
| DCIS: Ductal carcinoma in situ | ||
| Precancer(BRCA1-mut): Precancerous lesion from BRCA1 mutation carriers | ||
| Cervix | 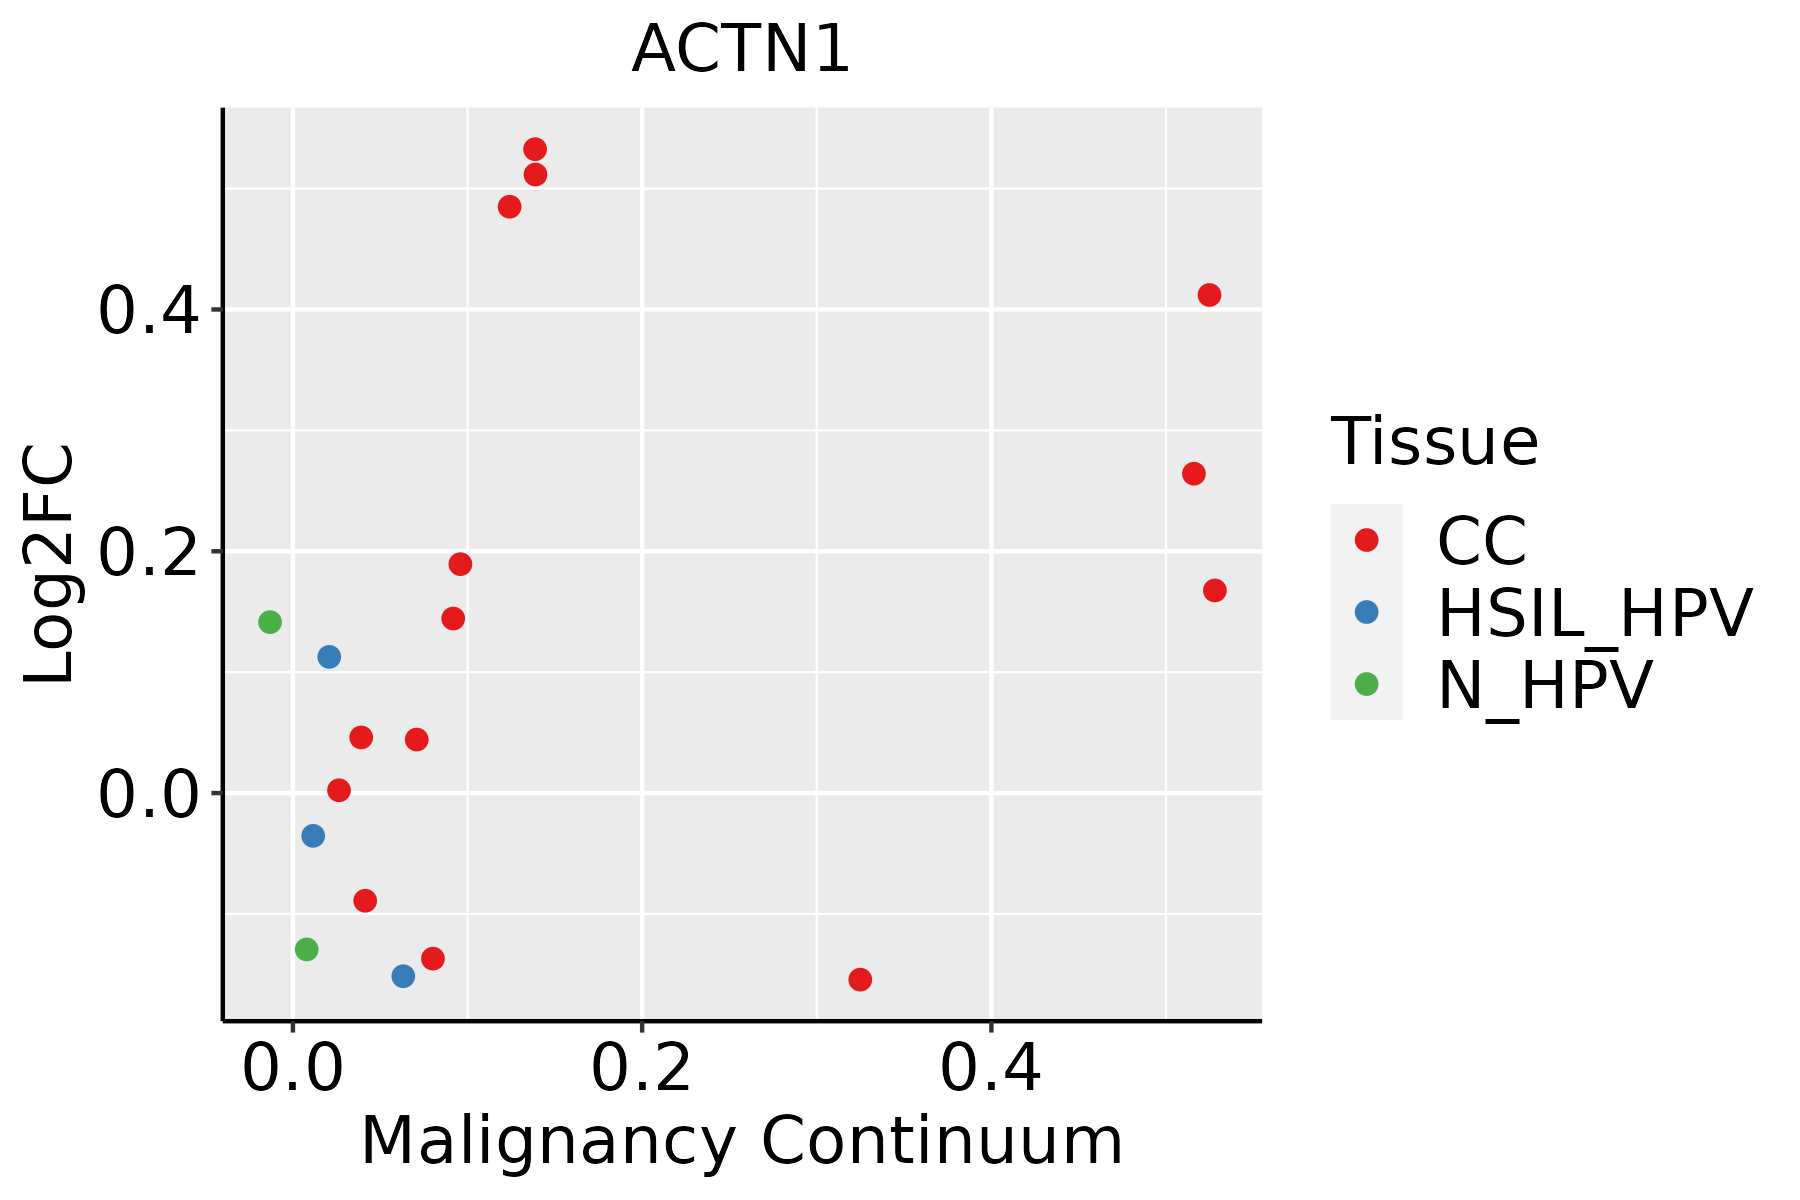 | CC: Cervix cancer |
| HSIL_HPV: HPV-infected high-grade squamous intraepithelial lesions | ||
| N_HPV: HPV-infected normal cervix | ||
| Colorectum (GSE201348) |  | FAP: Familial adenomatous polyposis |
| CRC: Colorectal cancer | ||
| Colorectum (HTA11) | 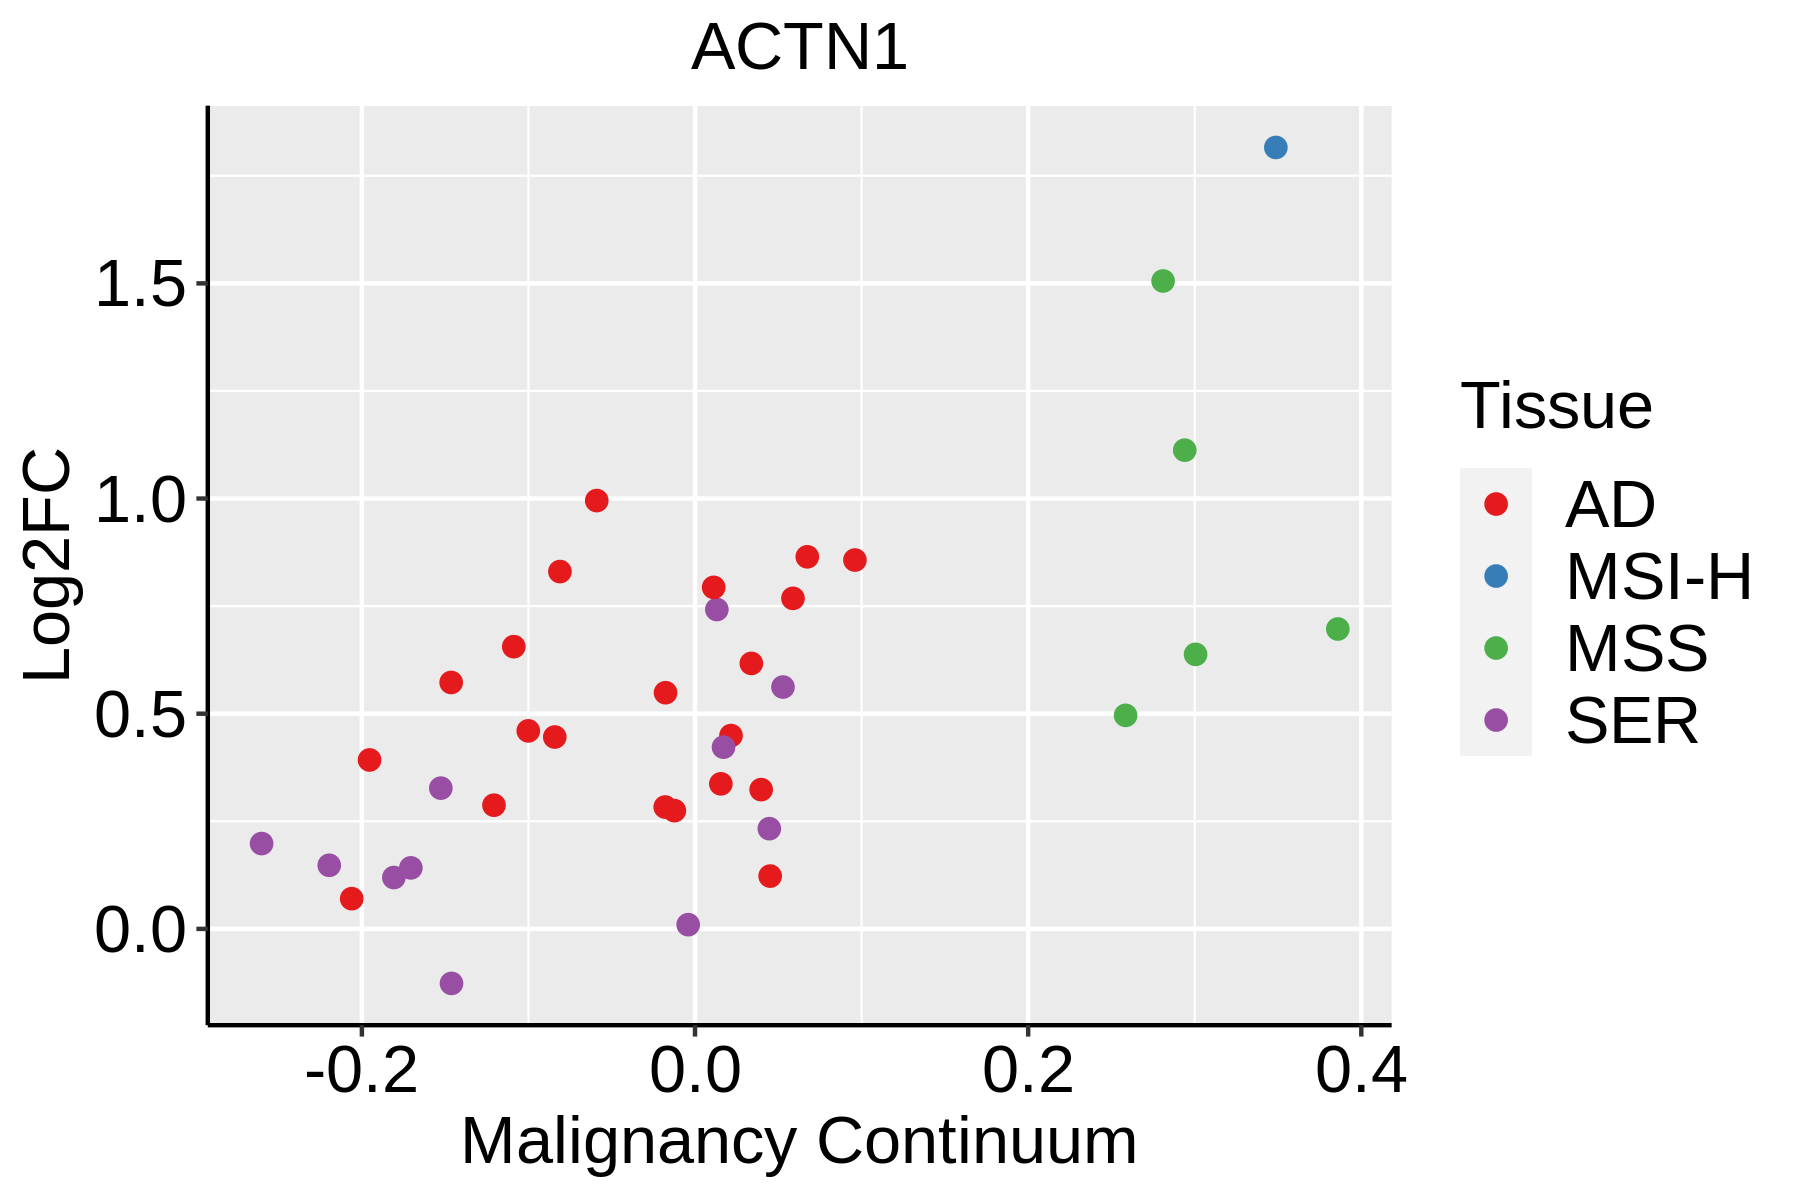 | AD: Adenomas |
| SER: Sessile serrated lesions | ||
| MSI-H: Microsatellite-high colorectal cancer | ||
| MSS: Microsatellite stable colorectal cancer | ||
| Esophagus | 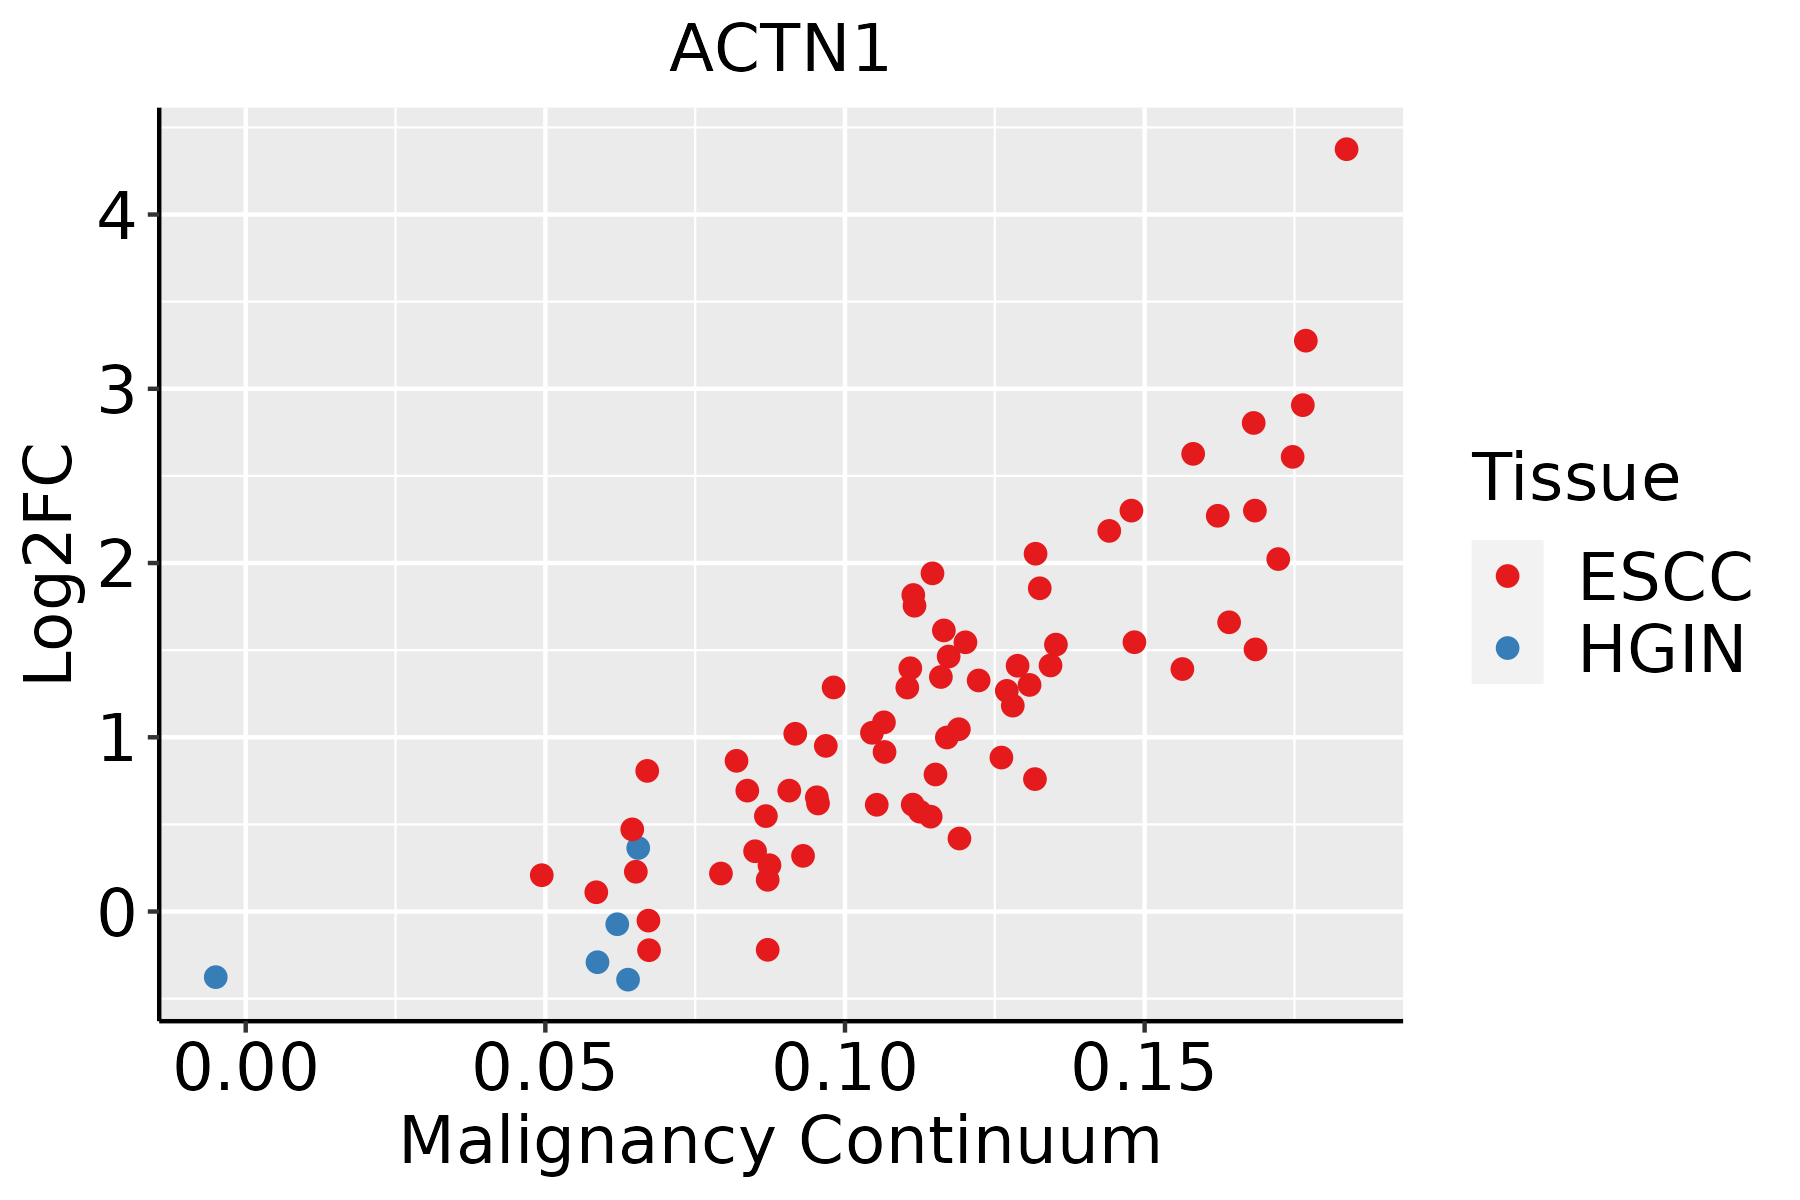 | ESCC: Esophageal squamous cell carcinoma |
| HGIN: High-grade intraepithelial neoplasias | ||
| LGIN: Low-grade intraepithelial neoplasias | ||
| Liver | 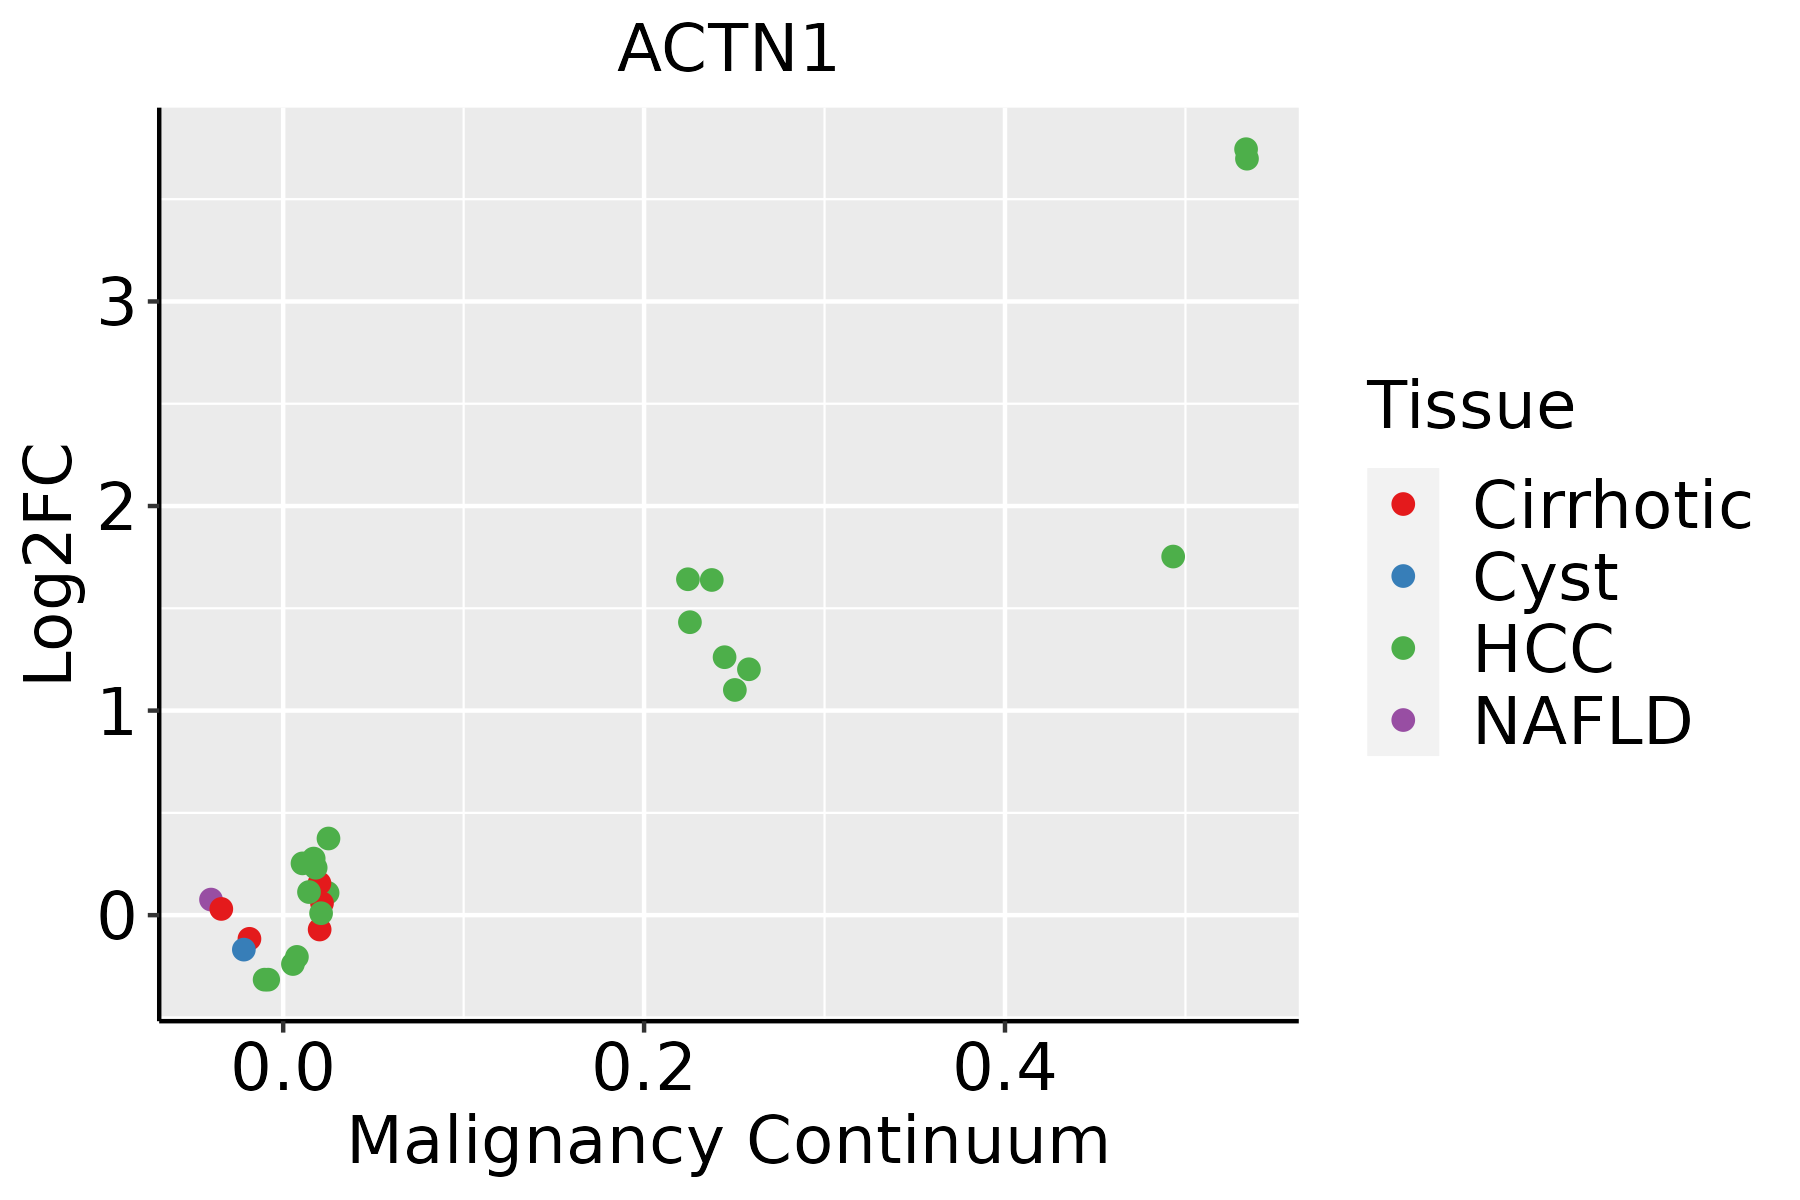 | HCC: Hepatocellular carcinoma |
| NAFLD: Non-alcoholic fatty liver disease | ||
| Oral Cavity | 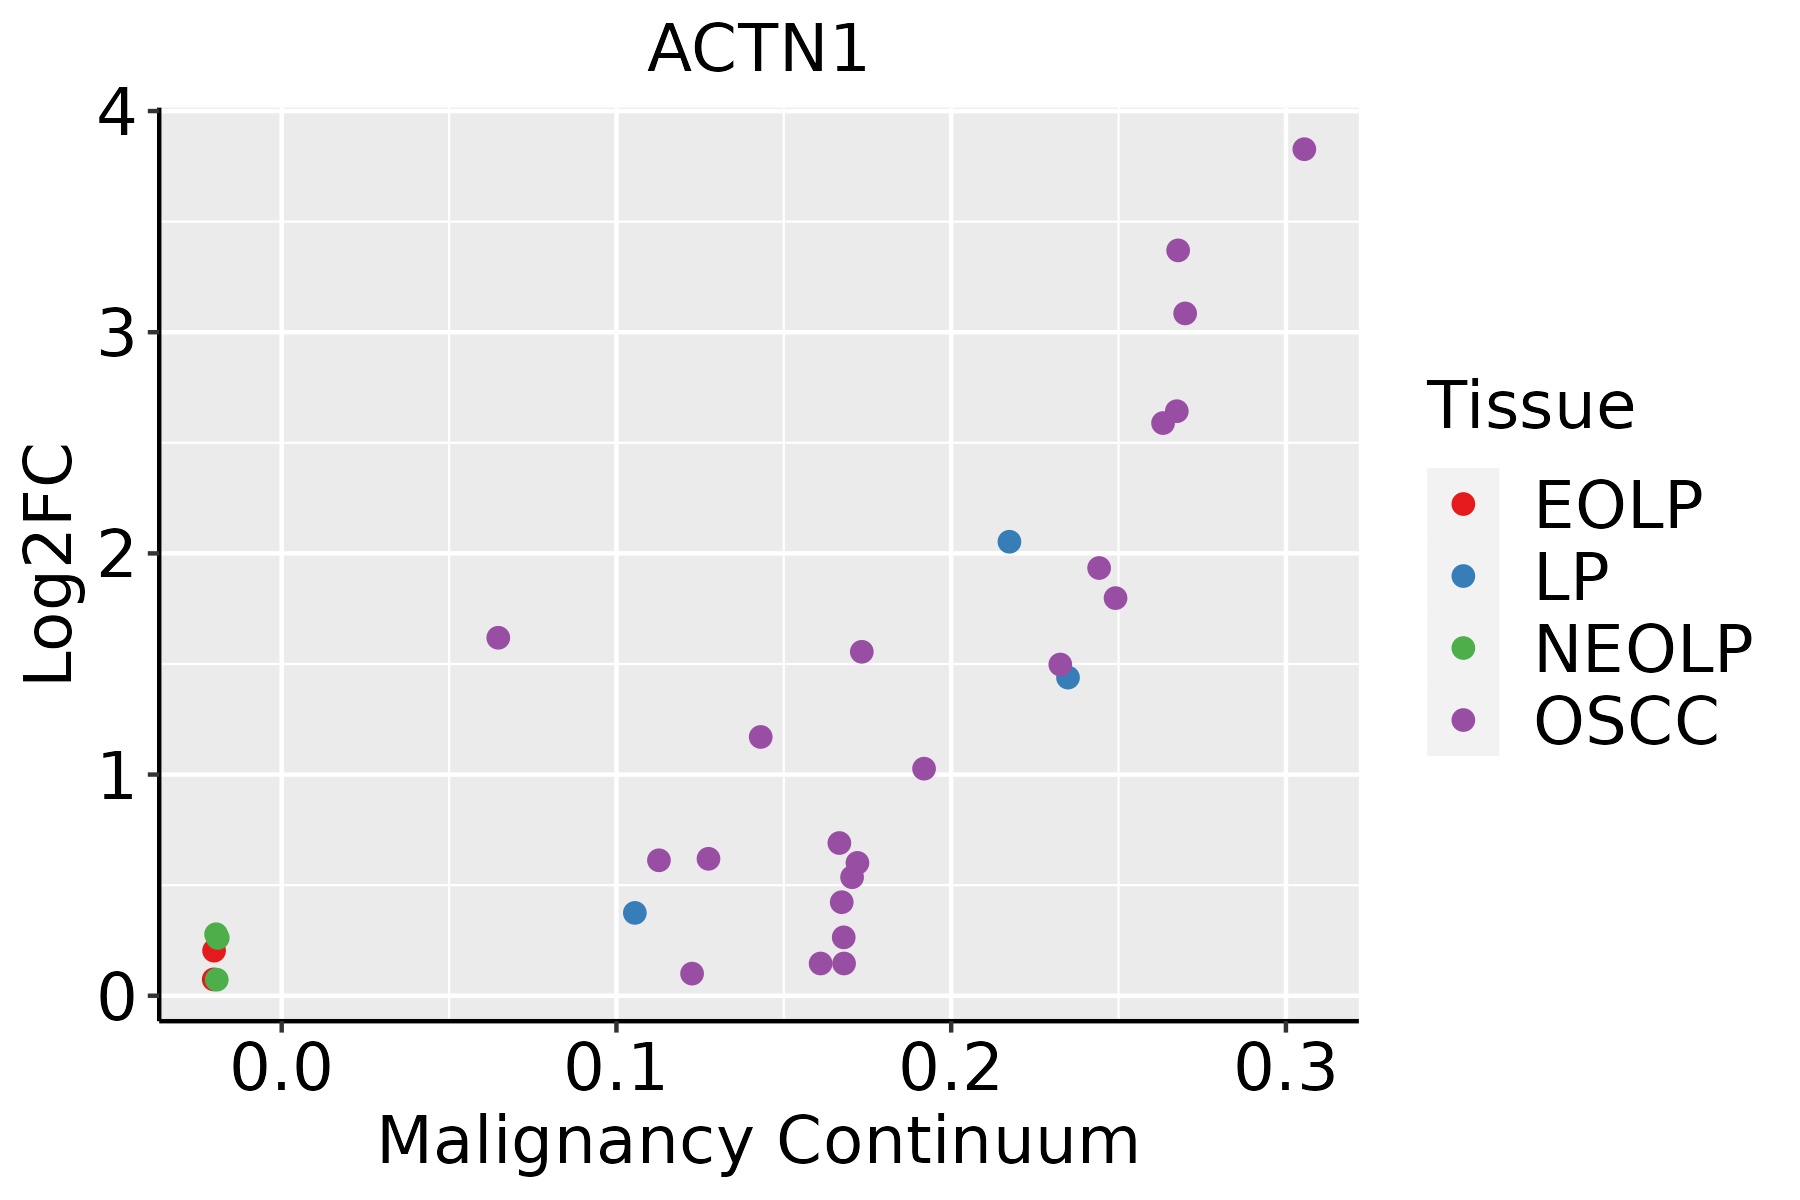 | EOLP: Erosive Oral lichen planus |
| LP: leukoplakia | ||
| NEOLP: Non-erosive oral lichen planus | ||
| OSCC: Oral squamous cell carcinoma | ||
| Prostate | 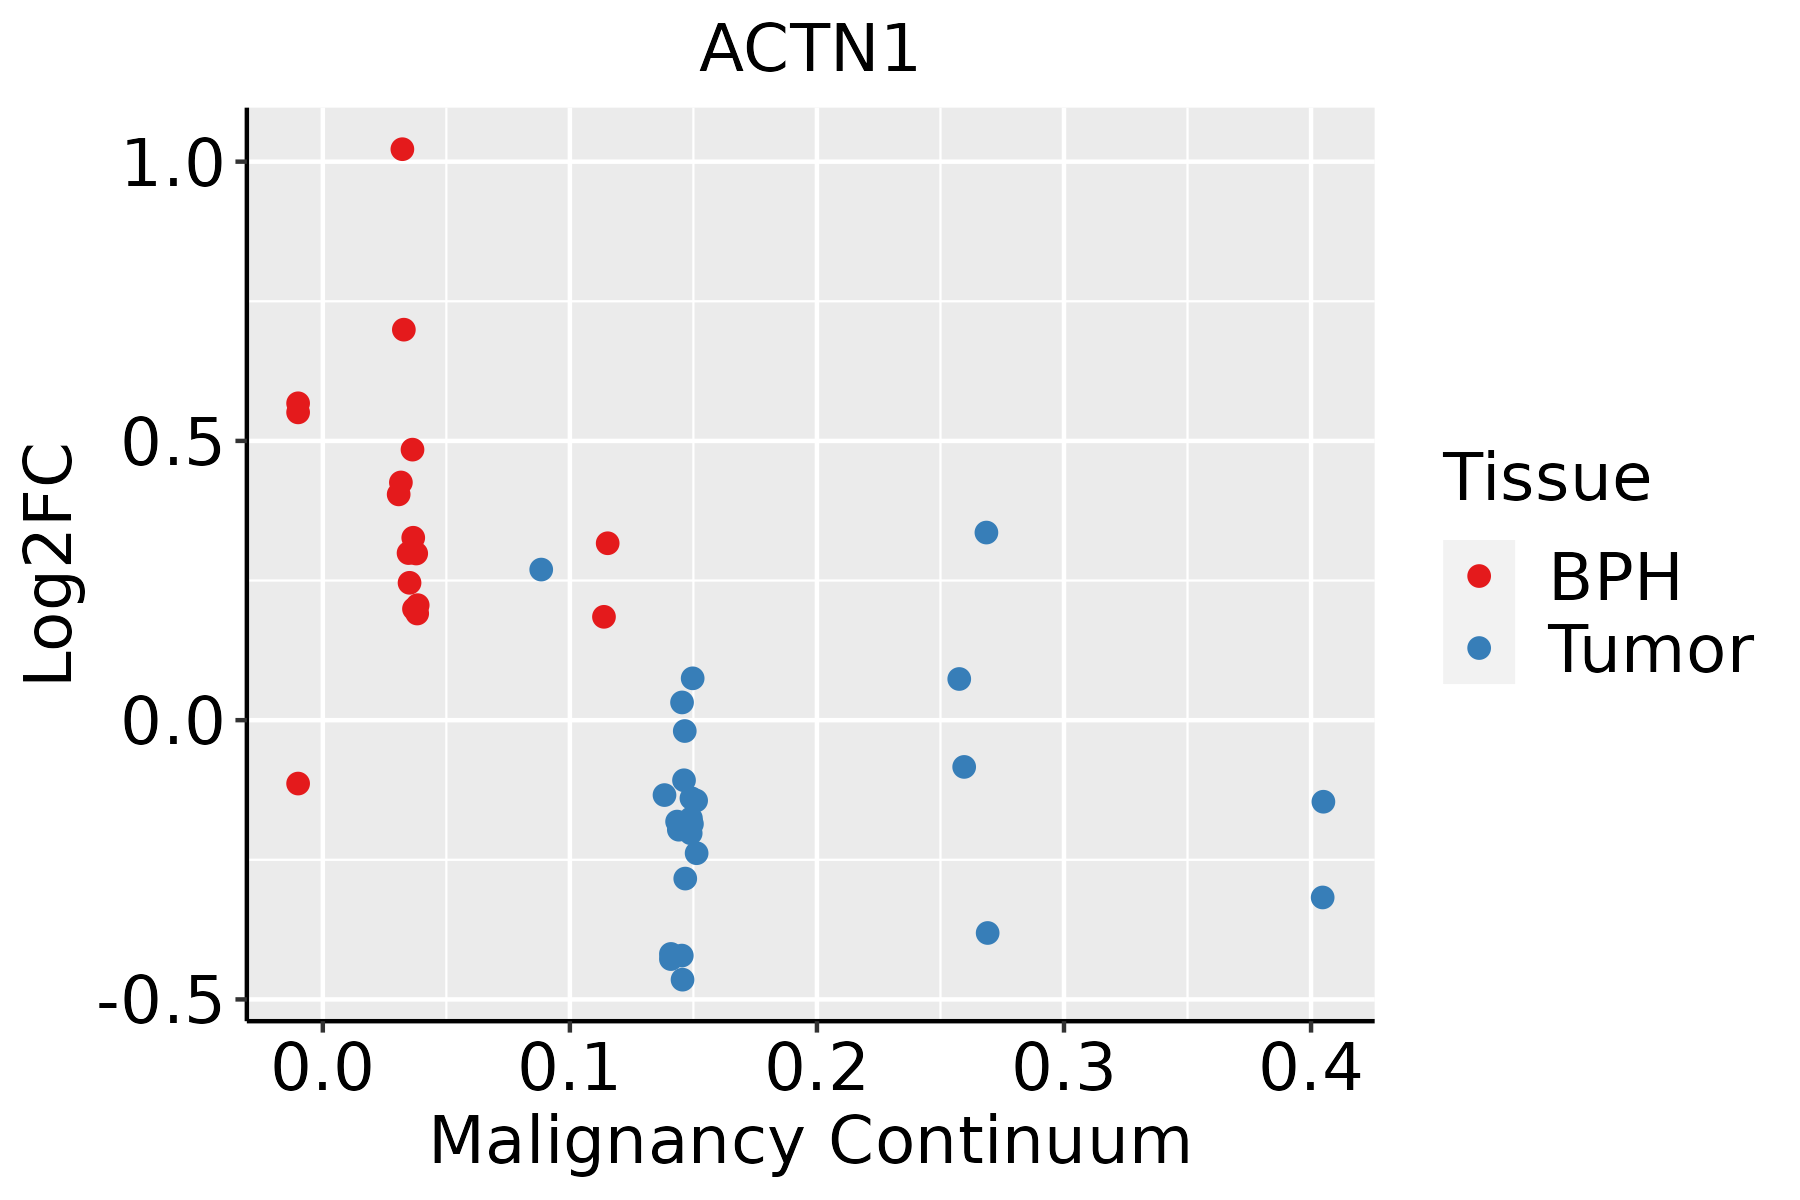 | BPH: Benign Prostatic Hyperplasia |
| Skin | 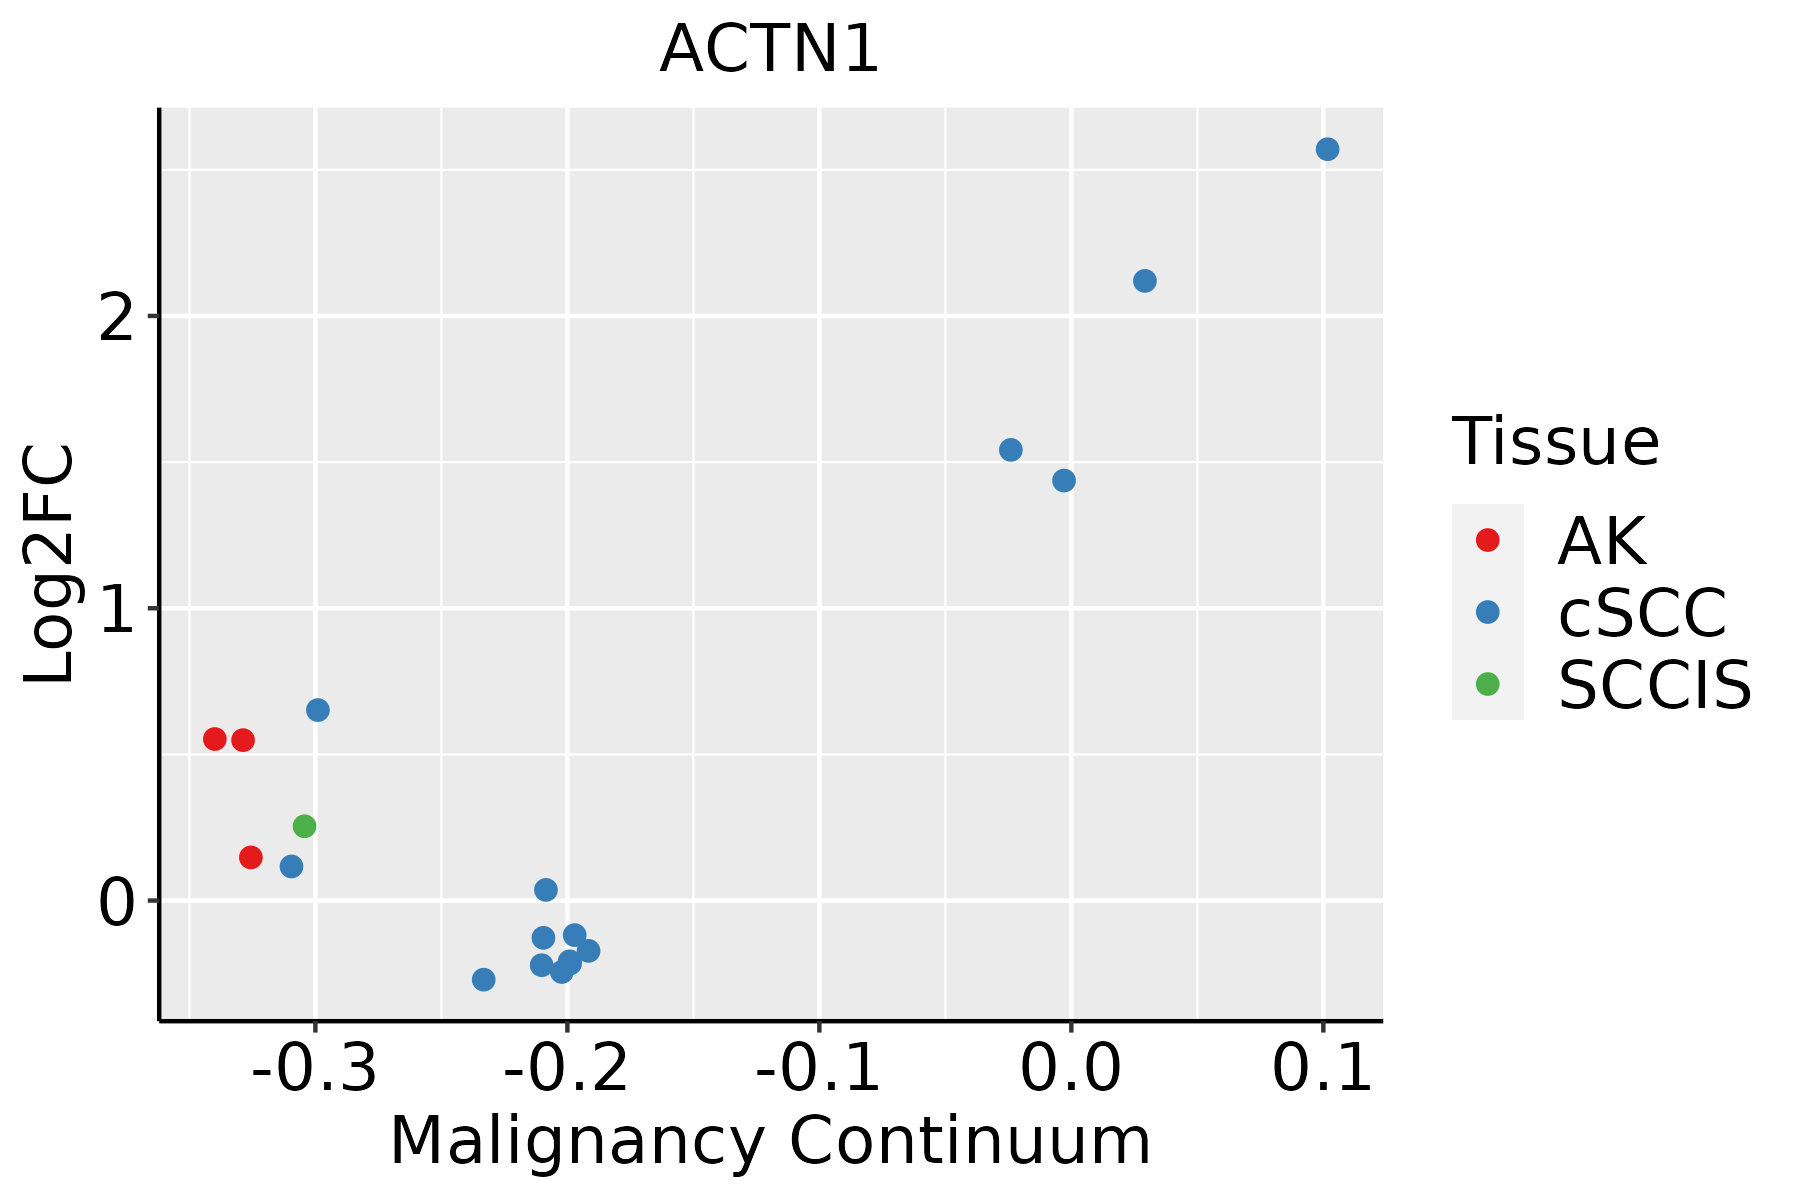 | AK: Actinic keratosis |
| cSCC: Cutaneous squamous cell carcinoma | ||
| SCCIS:squamous cell carcinoma in situ | ||
| Thyroid | 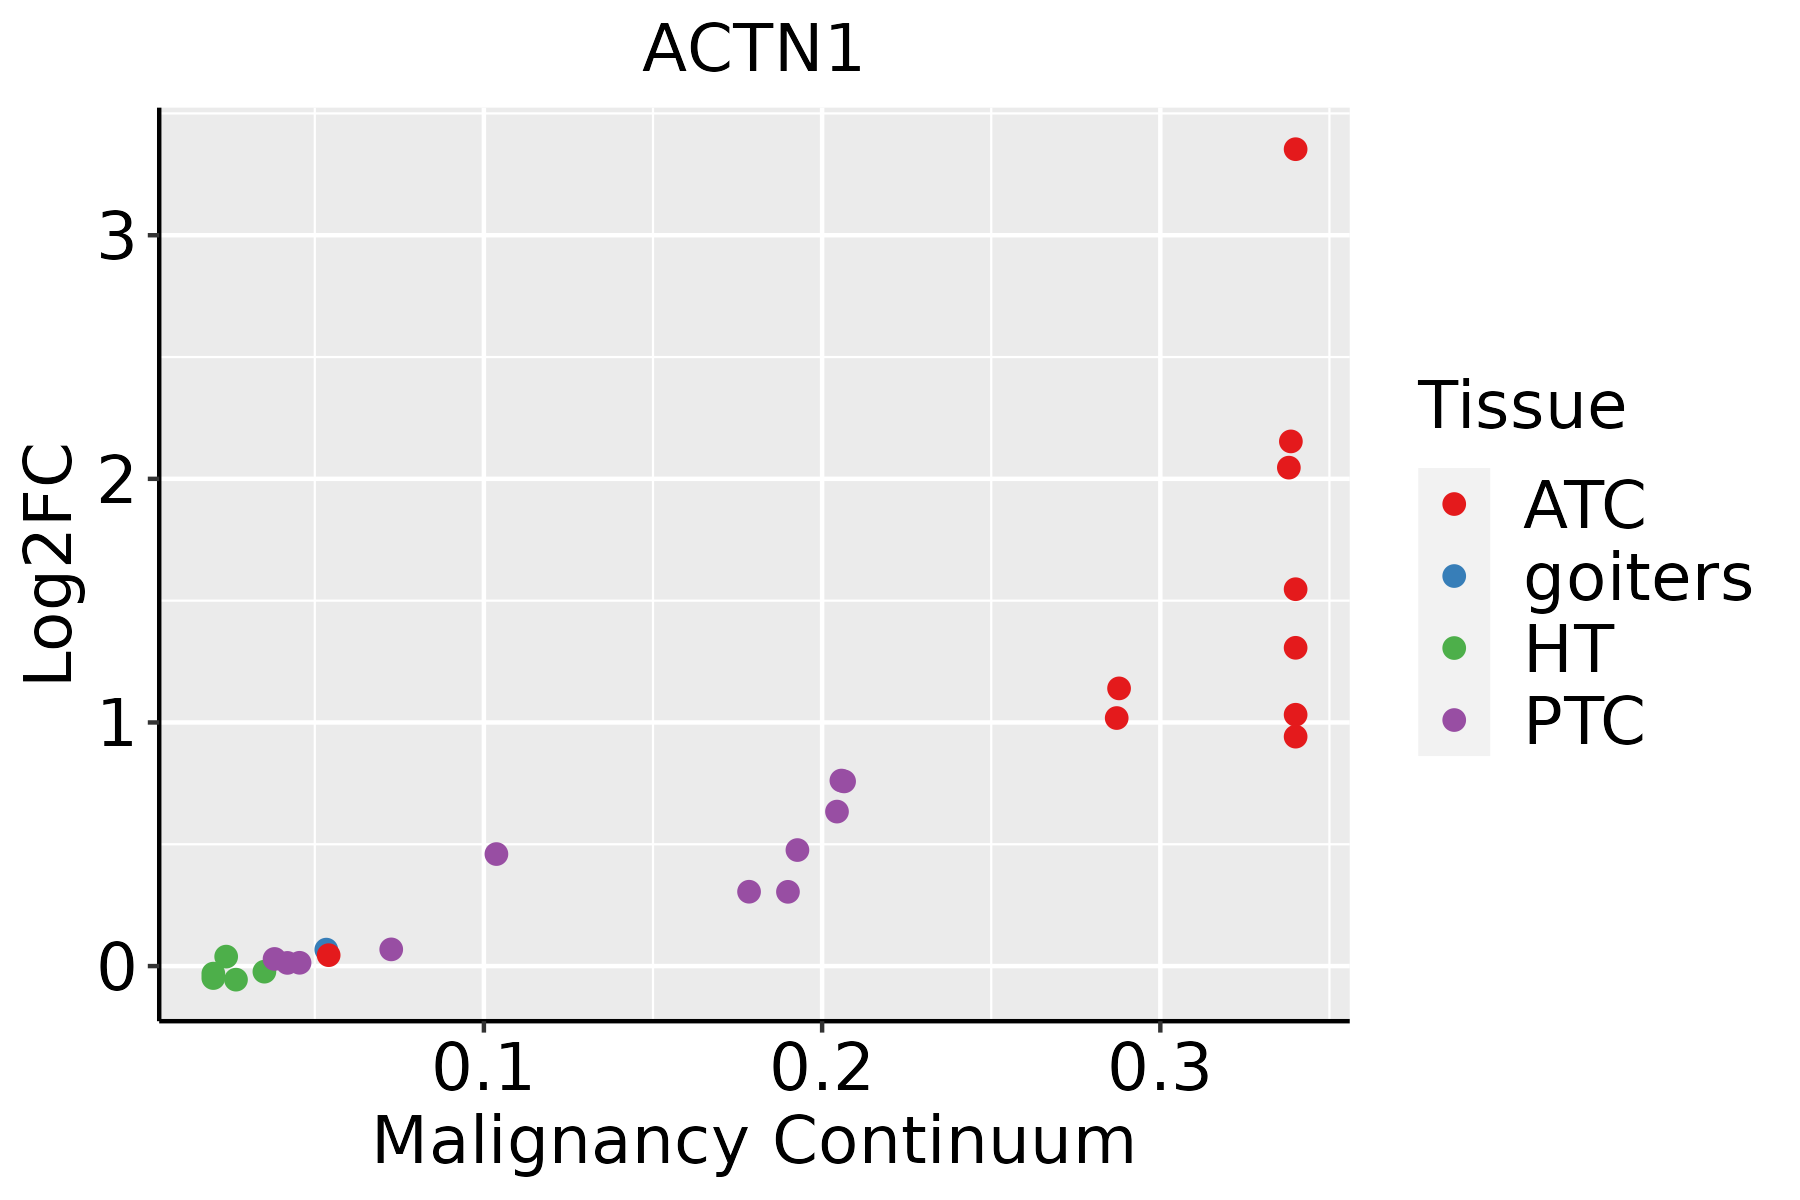 | ATC: Anaplastic thyroid cancer |
| HT: Hashimoto's thyroiditis | ||
| PTC: Papillary thyroid cancer |
| ∗log2FC in expression of this searched gene in stem-like cells from each diseased tissue sample relative to stem-like cells in normal samples in each tissue plotted against the malignancy continuum. Samples are colored based on if they are from different disease stage. |
Top |
Malignant transformation related pathway analysis |
| Find out the enriched GO biological processes and KEGG pathways involved in transition from healthy to precancer to cancer |
| Tissue | Disease Stage | Enriched GO biological Processes |
| Colorectum | AD |  |
| Colorectum | SER |  |
| Colorectum | MSS |  |
| Colorectum | MSI-H |  |
| Colorectum | FAP |  |
| ∗Top 15 enriched GO BP terms are showed in the bar plot of each disease state in each tissue. Each row represents a significant GO biological process which is colored according to the -log10(p.adjust). |
| Page: 1 2 3 4 5 6 7 8 9 |
| GO ID | Tissue | Disease Stage | Description | Gene Ratio | Bg Ratio | pvalue | p.adjust | Count |
| GO:00300999 | Breast | Precancer | myeloid cell differentiation | 45/1080 | 381/18723 | 4.00e-06 | 1.25e-04 | 45 |
| GO:00070159 | Breast | Precancer | actin filament organization | 44/1080 | 442/18723 | 3.02e-04 | 4.35e-03 | 44 |
| GO:00510179 | Breast | Precancer | actin filament bundle assembly | 18/1080 | 157/18723 | 4.17e-03 | 3.28e-02 | 18 |
| GO:01501158 | Breast | Precancer | cell-substrate junction organization | 13/1080 | 101/18723 | 5.30e-03 | 3.94e-02 | 13 |
| GO:00615729 | Breast | Precancer | actin filament bundle organization | 18/1080 | 161/18723 | 5.43e-03 | 4.01e-02 | 18 |
| GO:003009914 | Breast | IDC | myeloid cell differentiation | 54/1434 | 381/18723 | 8.07e-06 | 2.39e-04 | 54 |
| GO:00512712 | Breast | IDC | negative regulation of cellular component movement | 48/1434 | 367/18723 | 1.88e-04 | 3.12e-03 | 48 |
| GO:000701514 | Breast | IDC | actin filament organization | 55/1434 | 442/18723 | 2.45e-04 | 3.84e-03 | 55 |
| GO:005101714 | Breast | IDC | actin filament bundle assembly | 24/1434 | 157/18723 | 8.73e-04 | 1.01e-02 | 24 |
| GO:006157214 | Breast | IDC | actin filament bundle organization | 24/1434 | 161/18723 | 1.25e-03 | 1.33e-02 | 24 |
| GO:00426923 | Breast | IDC | muscle cell differentiation | 44/1434 | 384/18723 | 4.77e-03 | 3.66e-02 | 44 |
| GO:003009924 | Breast | DCIS | myeloid cell differentiation | 55/1390 | 381/18723 | 1.50e-06 | 5.68e-05 | 55 |
| GO:000701524 | Breast | DCIS | actin filament organization | 56/1390 | 442/18723 | 5.90e-05 | 1.19e-03 | 56 |
| GO:005127111 | Breast | DCIS | negative regulation of cellular component movement | 48/1390 | 367/18723 | 8.97e-05 | 1.69e-03 | 48 |
| GO:005101724 | Breast | DCIS | actin filament bundle assembly | 25/1390 | 157/18723 | 2.31e-04 | 3.65e-03 | 25 |
| GO:006157224 | Breast | DCIS | actin filament bundle organization | 25/1390 | 161/18723 | 3.43e-04 | 4.90e-03 | 25 |
| GO:004269211 | Breast | DCIS | muscle cell differentiation | 43/1390 | 384/18723 | 4.56e-03 | 3.49e-02 | 43 |
| GO:00315898 | Cervix | CC | cell-substrate adhesion | 96/2311 | 363/18723 | 1.48e-13 | 8.85e-11 | 96 |
| GO:000701510 | Cervix | CC | actin filament organization | 109/2311 | 442/18723 | 4.92e-13 | 2.45e-10 | 109 |
| GO:01501159 | Cervix | CC | cell-substrate junction organization | 37/2311 | 101/18723 | 3.20e-10 | 4.46e-08 | 37 |
| Page: 1 2 3 4 5 6 7 8 9 10 11 |
| Pathway ID | Tissue | Disease Stage | Description | Gene Ratio | Bg Ratio | pvalue | p.adjust | qvalue | Count |
| hsa0513118 | Breast | Precancer | Shigellosis | 44/684 | 247/8465 | 3.91e-07 | 6.86e-06 | 5.26e-06 | 44 |
| hsa0453018 | Breast | Precancer | Tight junction | 31/684 | 169/8465 | 1.13e-05 | 1.26e-04 | 9.64e-05 | 31 |
| hsa0467018 | Breast | Precancer | Leukocyte transendothelial migration | 20/684 | 114/8465 | 7.26e-04 | 5.33e-03 | 4.09e-03 | 20 |
| hsa0452018 | Breast | Precancer | Adherens junction | 17/684 | 93/8465 | 1.11e-03 | 7.57e-03 | 5.80e-03 | 17 |
| hsa052036 | Breast | Precancer | Viral carcinogenesis | 27/684 | 204/8465 | 7.19e-03 | 4.06e-02 | 3.11e-02 | 27 |
| hsa0513119 | Breast | Precancer | Shigellosis | 44/684 | 247/8465 | 3.91e-07 | 6.86e-06 | 5.26e-06 | 44 |
| hsa0453019 | Breast | Precancer | Tight junction | 31/684 | 169/8465 | 1.13e-05 | 1.26e-04 | 9.64e-05 | 31 |
| hsa0467019 | Breast | Precancer | Leukocyte transendothelial migration | 20/684 | 114/8465 | 7.26e-04 | 5.33e-03 | 4.09e-03 | 20 |
| hsa0452019 | Breast | Precancer | Adherens junction | 17/684 | 93/8465 | 1.11e-03 | 7.57e-03 | 5.80e-03 | 17 |
| hsa0520312 | Breast | Precancer | Viral carcinogenesis | 27/684 | 204/8465 | 7.19e-03 | 4.06e-02 | 3.11e-02 | 27 |
| hsa0453024 | Breast | IDC | Tight junction | 38/867 | 169/8465 | 2.07e-06 | 3.20e-05 | 2.39e-05 | 38 |
| hsa0520322 | Breast | IDC | Viral carcinogenesis | 34/867 | 204/8465 | 2.82e-03 | 1.86e-02 | 1.39e-02 | 34 |
| hsa0481014 | Breast | IDC | Regulation of actin cytoskeleton | 36/867 | 229/8465 | 5.79e-03 | 3.13e-02 | 2.34e-02 | 36 |
| hsa045109 | Breast | IDC | Focal adhesion | 32/867 | 203/8465 | 8.60e-03 | 4.23e-02 | 3.17e-02 | 32 |
| hsa0453034 | Breast | IDC | Tight junction | 38/867 | 169/8465 | 2.07e-06 | 3.20e-05 | 2.39e-05 | 38 |
| hsa0520332 | Breast | IDC | Viral carcinogenesis | 34/867 | 204/8465 | 2.82e-03 | 1.86e-02 | 1.39e-02 | 34 |
| hsa0481015 | Breast | IDC | Regulation of actin cytoskeleton | 36/867 | 229/8465 | 5.79e-03 | 3.13e-02 | 2.34e-02 | 36 |
| hsa0451013 | Breast | IDC | Focal adhesion | 32/867 | 203/8465 | 8.60e-03 | 4.23e-02 | 3.17e-02 | 32 |
| hsa0453044 | Breast | DCIS | Tight junction | 37/846 | 169/8465 | 3.07e-06 | 4.20e-05 | 3.09e-05 | 37 |
| hsa0513144 | Breast | DCIS | Shigellosis | 46/846 | 247/8465 | 2.06e-05 | 2.38e-04 | 1.75e-04 | 46 |
| Page: 1 2 3 4 5 6 7 8 |
Top |
Cell-cell communication analysis |
| Identification of potential cell-cell interactions between two cell types and their ligand-receptor pairs for different disease states |
| Ligand | Receptor | LRpair | Pathway | Tissue | Disease Stage |
| Page: 1 |
Top |
Single-cell gene regulatory network inference analysis |
| Find out the significant the regulons (TFs) and the target genes of each regulon across cell types for different disease states |
| TF | Cell Type | Tissue | Disease Stage | Target Gene | RSS | Regulon Activity |
| ∗The dot plots of a searched regulon are shown for all cell subpopulations in each disease state of each tissue based on the regulon specific score inferred using pySCENIC and by calculating the average expression. |
| Page: 1 |
Top |
Somatic mutation of malignant transformation related genes |
| Annotation of somatic variants for genes involved in malignant transformation |
| Hugo Symbol | Variant Class | Variant Classification | dbSNP RS | HGVSc | HGVSp | HGVSp Short | SWISSPROT | BIOTYPE | SIFT | PolyPhen | Tumor Sample Barcode | Tissue | Histology | Sex | Age | Stage | Therapy Types | Drugs | Outcome |
| ACTN1 | SNV | Missense_Mutation | novel | c.1780A>G | p.Thr594Ala | p.T594A | P12814 | protein_coding | tolerated(0.14) | benign(0.001) | TCGA-A2-A3XV-01 | Breast | breast invasive carcinoma | Female | <65 | I/II | Chemotherapy | carboplatin | CR |
| ACTN1 | SNV | Missense_Mutation | c.2600N>C | p.Met867Thr | p.M867T | P12814 | protein_coding | tolerated(0.08) | benign(0) | TCGA-D8-A1XK-01 | Breast | breast invasive carcinoma | Female | <65 | I/II | Chemotherapy | doxorubicine+cyclophosphamide | SD | |
| ACTN1 | SNV | Missense_Mutation | rs760908092 | c.950N>A | p.Arg317Gln | p.R317Q | P12814 | protein_coding | deleterious(0.04) | probably_damaging(0.999) | TCGA-D8-A1XK-01 | Breast | breast invasive carcinoma | Female | <65 | I/II | Chemotherapy | doxorubicine+cyclophosphamide | SD |
| ACTN1 | SNV | Missense_Mutation | rs373084944 | c.1894N>A | p.Arg632Ser | p.R632S | P12814 | protein_coding | deleterious(0.03) | probably_damaging(1) | TCGA-C5-A1M6-01 | Cervix | cervical & endocervical cancer | Female | <65 | I/II | Chemotherapy | cisplatin | PD |
| ACTN1 | SNV | Missense_Mutation | rs148344567 | c.2614C>T | p.Arg872Cys | p.R872C | P12814 | protein_coding | deleterious(0) | probably_damaging(0.987) | TCGA-DS-A1OB-01 | Cervix | cervical & endocervical cancer | Female | <65 | I/II | Chemotherapy | carboplatin | PD |
| ACTN1 | SNV | Missense_Mutation | novel | c.1537N>C | p.Glu513Gln | p.E513Q | P12814 | protein_coding | deleterious(0.03) | possibly_damaging(0.536) | TCGA-ZJ-AAXB-01 | Cervix | cervical & endocervical cancer | Female | <65 | I/II | Unknown | Unknown | SD |
| ACTN1 | SNV | Missense_Mutation | rs377766289 | c.2395N>T | p.Arg799Cys | p.R799C | P12814 | protein_coding | deleterious_low_confidence(0) | probably_damaging(0.927) | TCGA-5M-AAT6-01 | Colorectum | colon adenocarcinoma | Female | <65 | III/IV | Unknown | Unknown | PD |
| ACTN1 | SNV | Missense_Mutation | rs372651589 | c.1495N>T | p.Arg499Trp | p.R499W | P12814 | protein_coding | deleterious(0) | probably_damaging(0.926) | TCGA-A6-2672-01 | Colorectum | colon adenocarcinoma | Female | >=65 | III/IV | Unknown | Unknown | SD |
| ACTN1 | SNV | Missense_Mutation | rs201419872 | c.2173N>A | p.Ala725Thr | p.A725T | P12814 | protein_coding | tolerated(0.23) | possibly_damaging(0.607) | TCGA-AA-3510-01 | Colorectum | colon adenocarcinoma | Male | >=65 | I/II | Unknown | Unknown | SD |
| ACTN1 | SNV | Missense_Mutation | rs148344567 | c.2614N>T | p.Arg872Cys | p.R872C | P12814 | protein_coding | deleterious(0) | probably_damaging(0.987) | TCGA-AA-3864-01 | Colorectum | colon adenocarcinoma | Male | >=65 | I/II | Unknown | Unknown | SD |
| Page: 1 2 3 4 5 6 7 8 9 10 |
Top |
Related drugs of malignant transformation related genes |
| Identification of chemicals and drugs interact with genes involved in malignant transfromation |
| (DGIdb 4.0) |
| Entrez ID | Symbol | Category | Interaction Types | Drug Claim Name | Drug Name | PMIDs |
| Page: 1 |

Copyright 2023-Present -The University of Texas Health Science Center at Houston |