
|
|||||
|
 | |
| |
| |
| |
| |
| |
|
Gene: ACTL6A |
Gene summary for ACTL6A |
| Gene information | Species | Human | Gene symbol | ACTL6A | Gene ID | 86 |
| Gene name | actin like 6A | |
| Gene Alias | ACTL6 | |
| Cytomap | 3q26.33 | |
| Gene Type | protein-coding | GO ID | GO:0001654 | UniProtAcc | O96019 |
Top |
Malignant transformation analysis |
| Identification of the aberrant gene expression in precancerous and cancerous lesions by comparing the gene expression of stem-like cells in diseased tissues with normal stem cells |
| Entrez ID | Symbol | Replicates | Species | Organ | Tissue | Adj P-value | Log2FC | Malignancy |
| 86 | ACTL6A | LZE2T | Human | Esophagus | ESCC | 1.26e-06 | 1.48e+00 | 0.082 |
| 86 | ACTL6A | LZE4T | Human | Esophagus | ESCC | 3.50e-24 | 8.44e-01 | 0.0811 |
| 86 | ACTL6A | LZE7T | Human | Esophagus | ESCC | 8.72e-12 | 1.08e+00 | 0.0667 |
| 86 | ACTL6A | LZE8T | Human | Esophagus | ESCC | 7.84e-06 | 4.06e-01 | 0.067 |
| 86 | ACTL6A | LZE20T | Human | Esophagus | ESCC | 2.00e-02 | 3.54e-01 | 0.0662 |
| 86 | ACTL6A | LZE22T | Human | Esophagus | ESCC | 4.46e-03 | 6.48e-01 | 0.068 |
| 86 | ACTL6A | LZE24T | Human | Esophagus | ESCC | 3.41e-27 | 8.26e-01 | 0.0596 |
| 86 | ACTL6A | LZE21T | Human | Esophagus | ESCC | 2.58e-10 | 9.31e-01 | 0.0655 |
| 86 | ACTL6A | LZE6T | Human | Esophagus | ESCC | 1.04e-11 | 9.00e-01 | 0.0845 |
| 86 | ACTL6A | P1T-E | Human | Esophagus | ESCC | 4.59e-07 | 6.01e-01 | 0.0875 |
| 86 | ACTL6A | P2T-E | Human | Esophagus | ESCC | 5.95e-90 | 1.81e+00 | 0.1177 |
| 86 | ACTL6A | P4T-E | Human | Esophagus | ESCC | 1.19e-54 | 1.68e+00 | 0.1323 |
| 86 | ACTL6A | P5T-E | Human | Esophagus | ESCC | 2.89e-59 | 1.57e+00 | 0.1327 |
| 86 | ACTL6A | P8T-E | Human | Esophagus | ESCC | 2.65e-34 | 8.41e-01 | 0.0889 |
| 86 | ACTL6A | P9T-E | Human | Esophagus | ESCC | 5.11e-18 | 6.51e-01 | 0.1131 |
| 86 | ACTL6A | P10T-E | Human | Esophagus | ESCC | 9.20e-56 | 1.17e+00 | 0.116 |
| 86 | ACTL6A | P11T-E | Human | Esophagus | ESCC | 3.41e-18 | 9.74e-01 | 0.1426 |
| 86 | ACTL6A | P12T-E | Human | Esophagus | ESCC | 3.20e-57 | 1.23e+00 | 0.1122 |
| 86 | ACTL6A | P15T-E | Human | Esophagus | ESCC | 7.15e-59 | 1.41e+00 | 0.1149 |
| 86 | ACTL6A | P16T-E | Human | Esophagus | ESCC | 6.09e-64 | 1.20e+00 | 0.1153 |
| Page: 1 2 3 4 5 6 |
| Tissue | Expression Dynamics | Abbreviation |
| Esophagus | 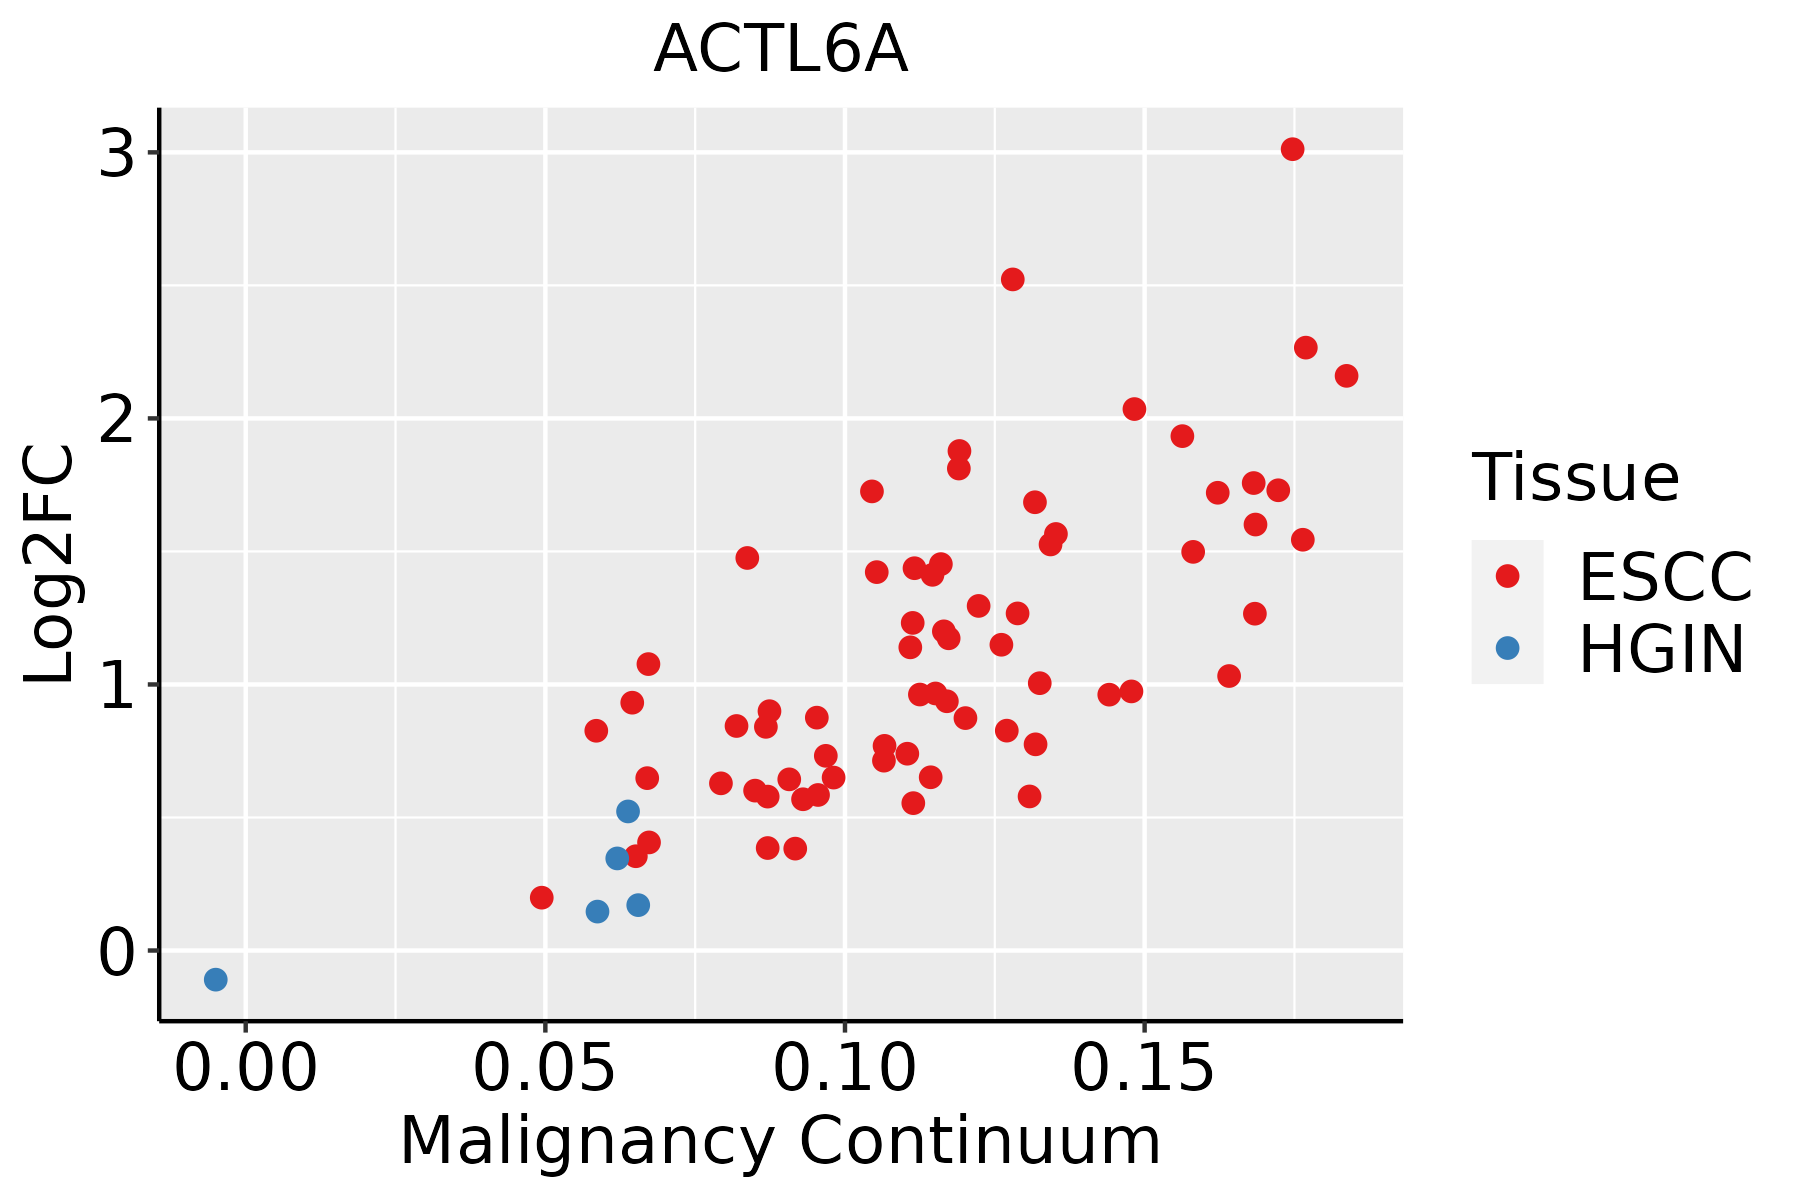 | ESCC: Esophageal squamous cell carcinoma |
| HGIN: High-grade intraepithelial neoplasias | ||
| LGIN: Low-grade intraepithelial neoplasias | ||
| Liver | 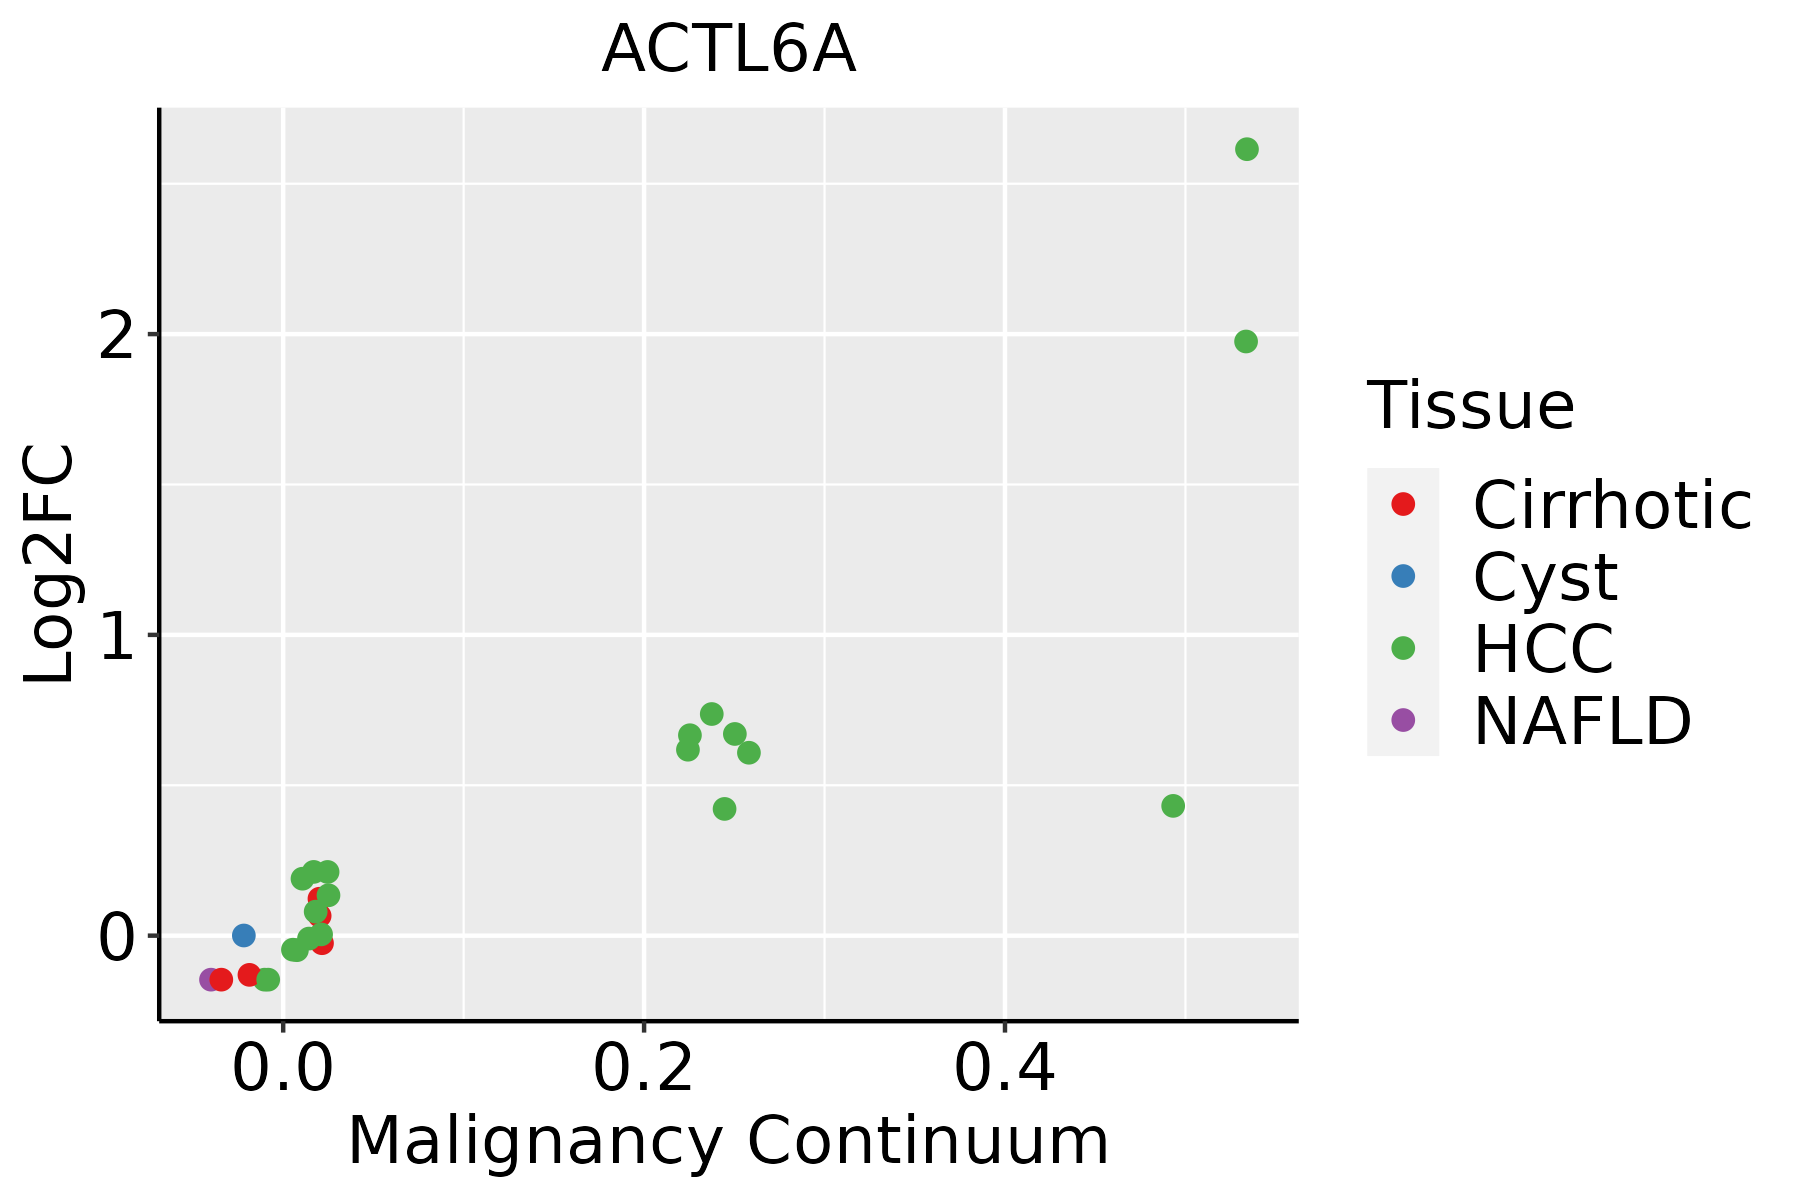 | HCC: Hepatocellular carcinoma |
| NAFLD: Non-alcoholic fatty liver disease | ||
| Oral Cavity | 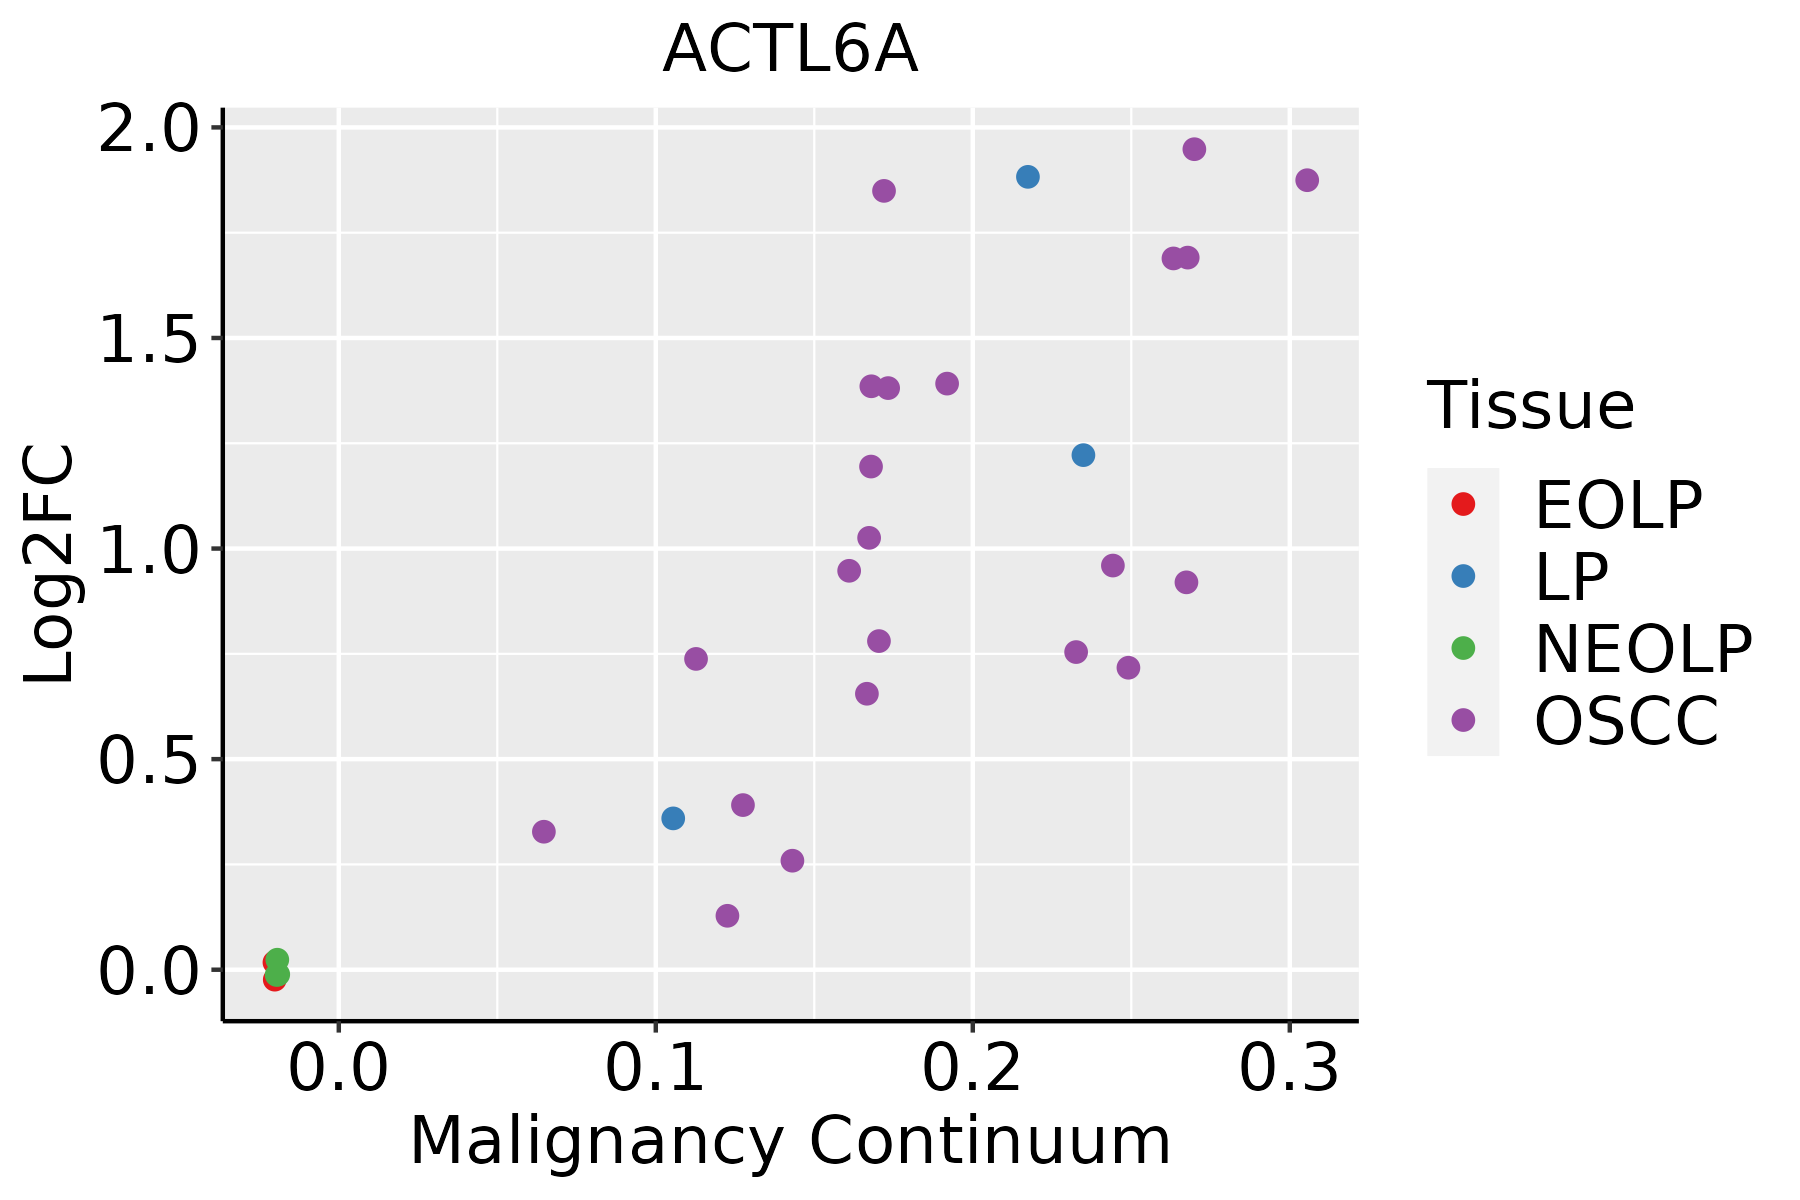 | EOLP: Erosive Oral lichen planus |
| LP: leukoplakia | ||
| NEOLP: Non-erosive oral lichen planus | ||
| OSCC: Oral squamous cell carcinoma | ||
| Skin | 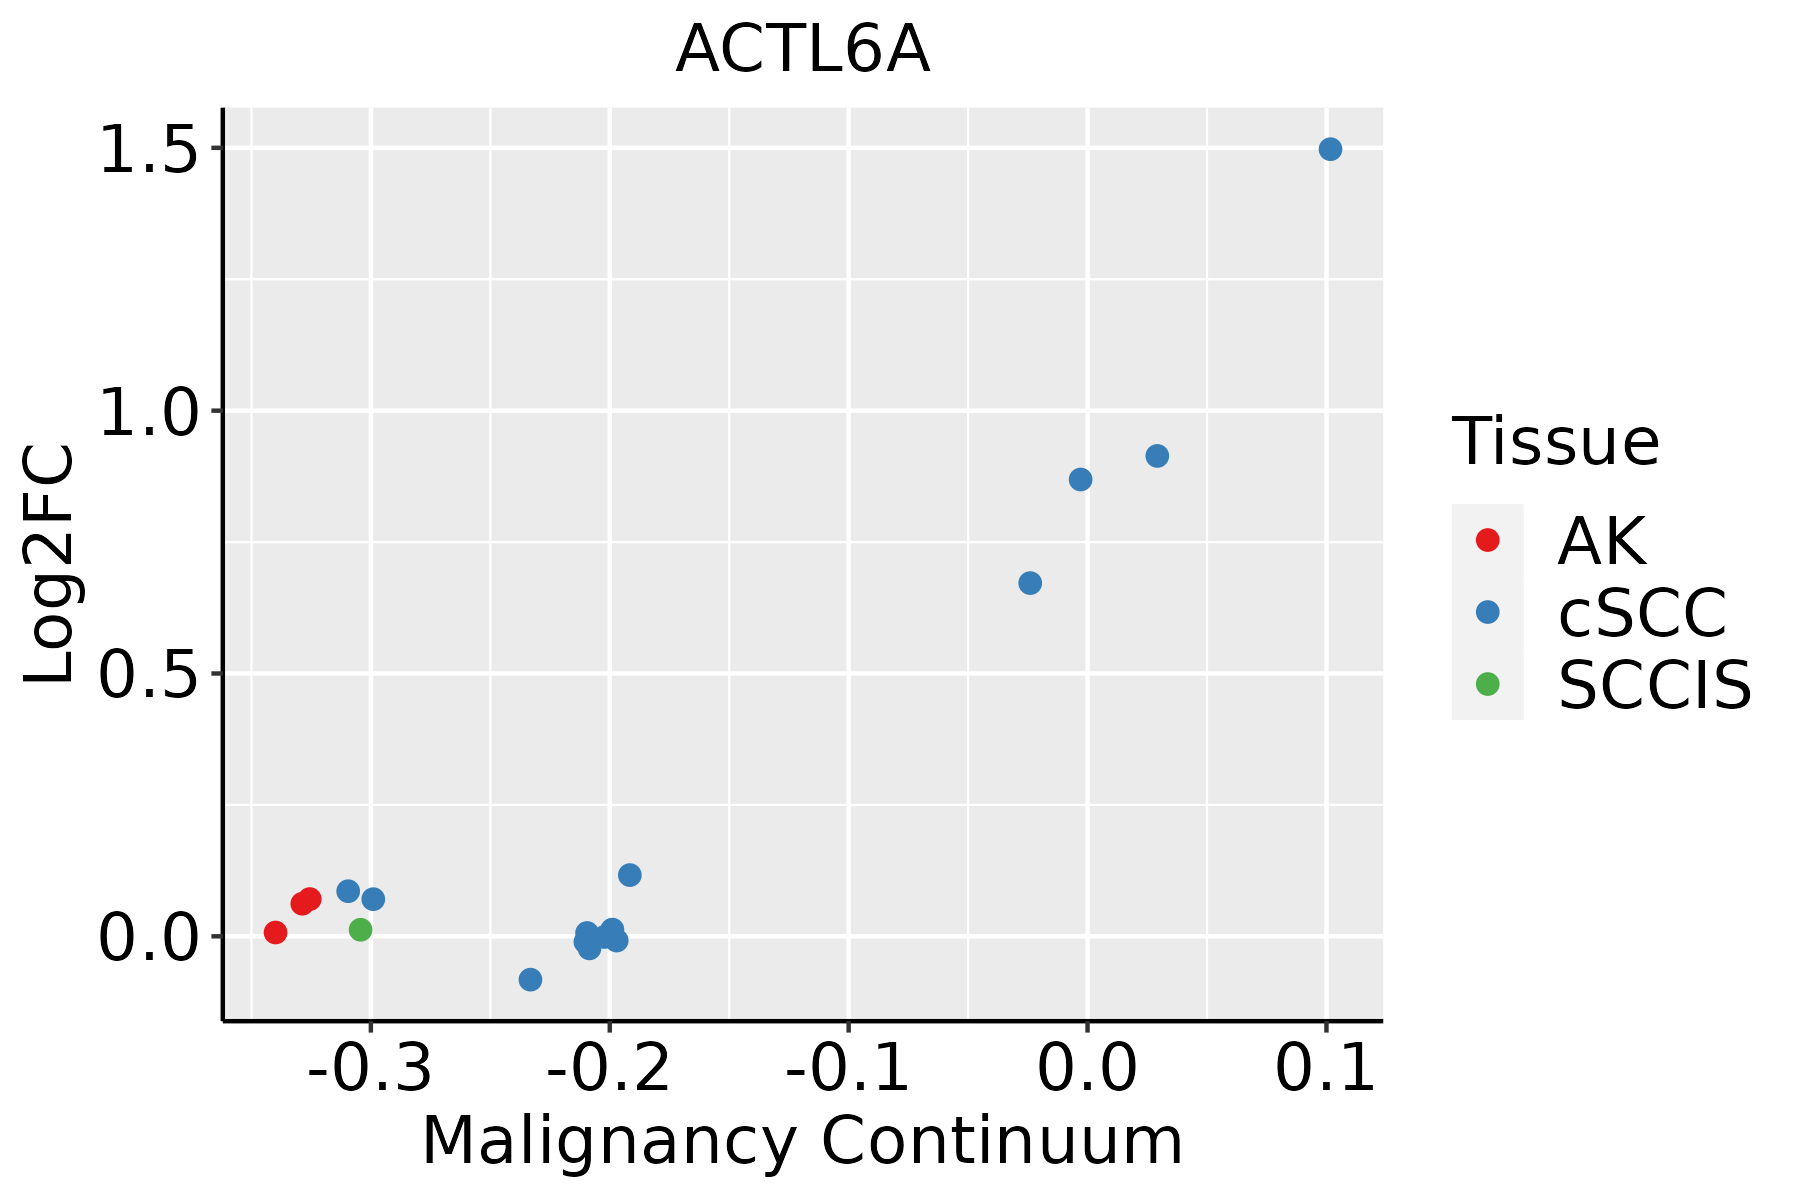 | AK: Actinic keratosis |
| cSCC: Cutaneous squamous cell carcinoma | ||
| SCCIS:squamous cell carcinoma in situ | ||
| Thyroid | 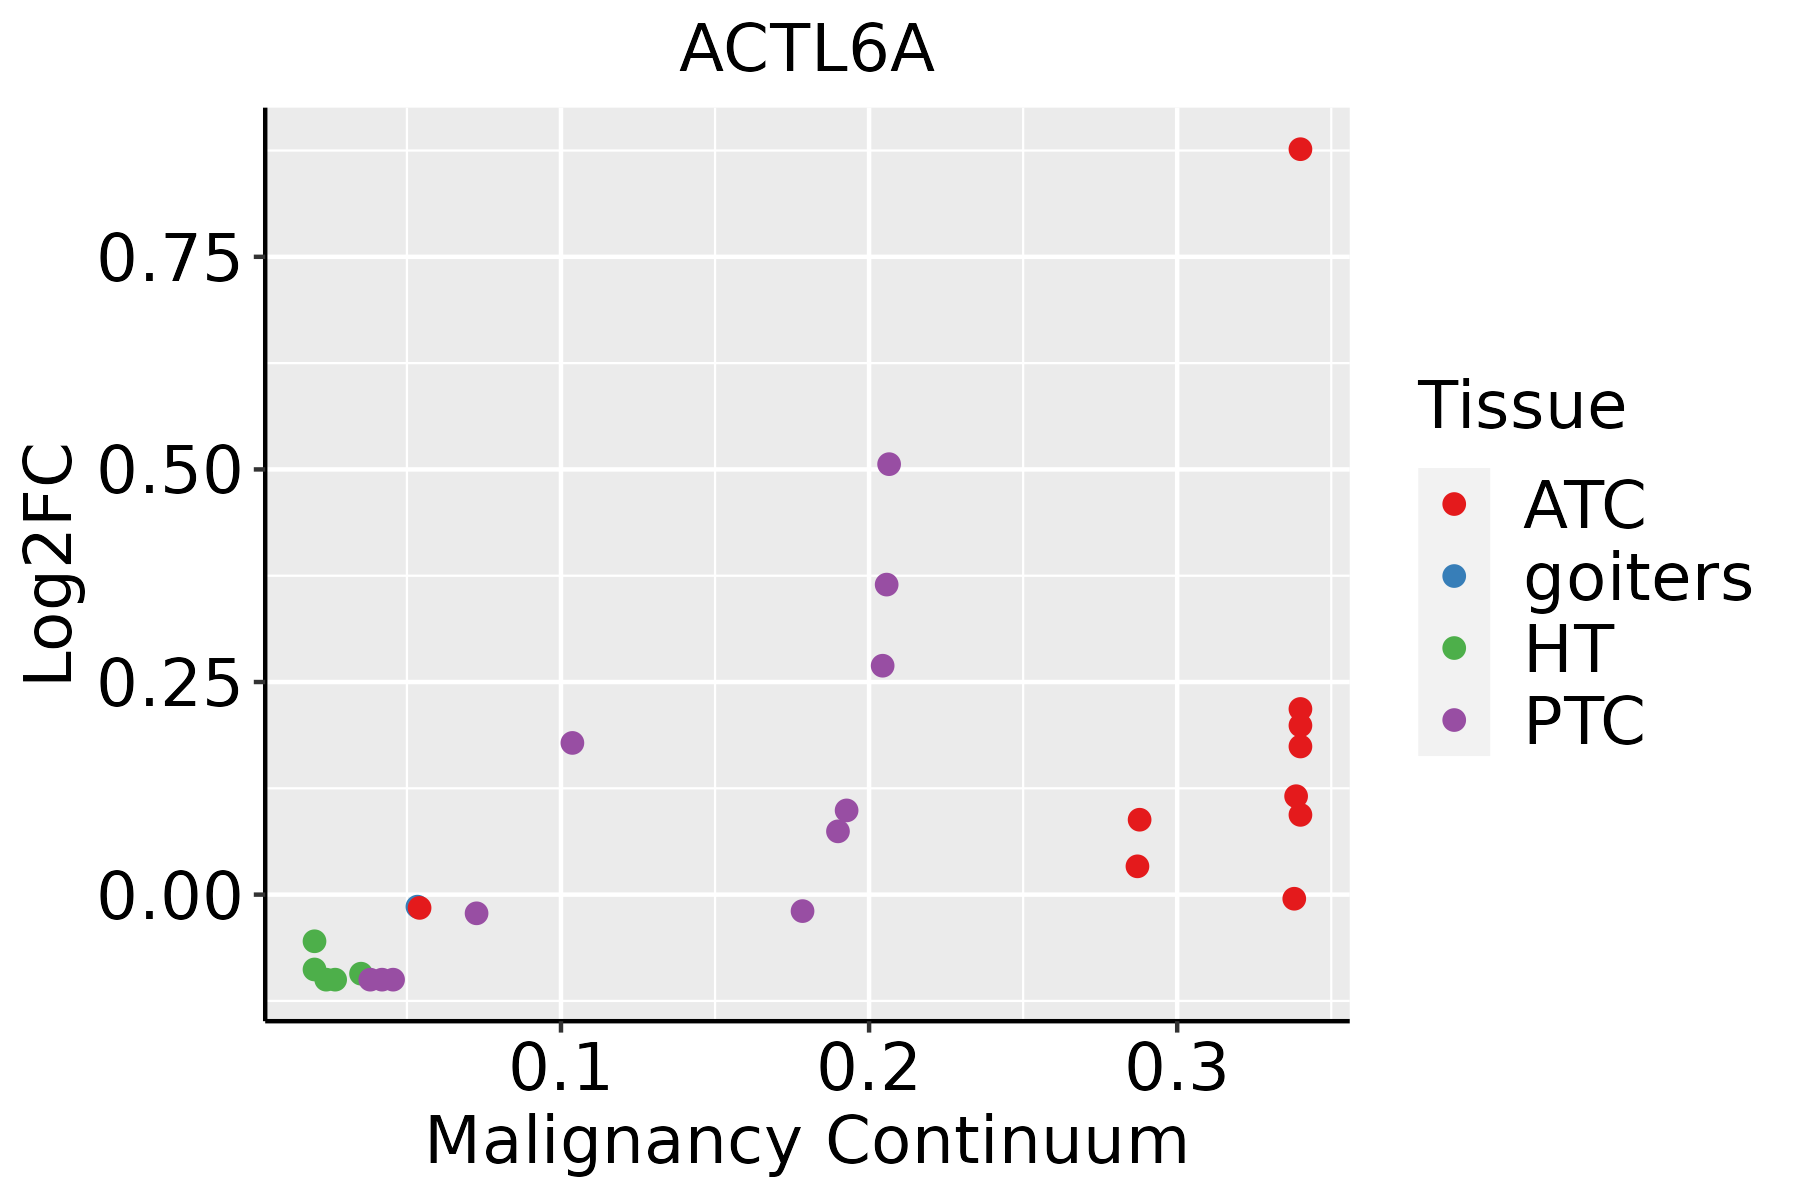 | ATC: Anaplastic thyroid cancer |
| HT: Hashimoto's thyroiditis | ||
| PTC: Papillary thyroid cancer |
| ∗log2FC in expression of this searched gene in stem-like cells from each diseased tissue sample relative to stem-like cells in normal samples in each tissue plotted against the malignancy continuum. Samples are colored based on if they are from different disease stage. |
Top |
Malignant transformation related pathway analysis |
| Find out the enriched GO biological processes and KEGG pathways involved in transition from healthy to precancer to cancer |
| Tissue | Disease Stage | Enriched GO biological Processes |
| Colorectum | AD |  |
| Colorectum | SER |  |
| Colorectum | MSS |  |
| Colorectum | MSI-H |  |
| Colorectum | FAP |  |
| ∗Top 15 enriched GO BP terms are showed in the bar plot of each disease state in each tissue. Each row represents a significant GO biological process which is colored according to the -log10(p.adjust). |
| Page: 1 2 3 4 5 6 7 8 9 |
| GO ID | Tissue | Disease Stage | Description | Gene Ratio | Bg Ratio | pvalue | p.adjust | Count |
| GO:001657015 | Esophagus | ESCC | histone modification | 323/8552 | 463/18723 | 2.61e-26 | 7.88e-24 | 323 |
| GO:001820514 | Esophagus | ESCC | peptidyl-lysine modification | 259/8552 | 376/18723 | 3.90e-20 | 5.26e-18 | 259 |
| GO:000170119 | Esophagus | ESCC | in utero embryonic development | 243/8552 | 367/18723 | 1.00e-15 | 6.86e-14 | 243 |
| GO:001839413 | Esophagus | ESCC | peptidyl-lysine acetylation | 123/8552 | 169/18723 | 6.58e-13 | 2.94e-11 | 123 |
| GO:004354313 | Esophagus | ESCC | protein acylation | 165/8552 | 243/18723 | 1.69e-12 | 7.14e-11 | 165 |
| GO:000647313 | Esophagus | ESCC | protein acetylation | 140/8552 | 201/18723 | 4.37e-12 | 1.69e-10 | 140 |
| GO:001839313 | Esophagus | ESCC | internal peptidyl-lysine acetylation | 114/8552 | 158/18723 | 1.16e-11 | 4.24e-10 | 114 |
| GO:000647513 | Esophagus | ESCC | internal protein amino acid acetylation | 115/8552 | 160/18723 | 1.43e-11 | 5.08e-10 | 115 |
| GO:00165735 | Esophagus | ESCC | histone acetylation | 110/8552 | 152/18723 | 1.95e-11 | 6.81e-10 | 110 |
| GO:004396712 | Esophagus | ESCC | histone H4 acetylation | 53/8552 | 67/18723 | 2.11e-08 | 4.03e-07 | 53 |
| GO:000632517 | Esophagus | ESCC | chromatin organization | 240/8552 | 409/18723 | 6.52e-08 | 1.14e-06 | 240 |
| GO:000182412 | Esophagus | ESCC | blastocyst development | 73/8552 | 106/18723 | 1.13e-06 | 1.40e-05 | 73 |
| GO:00018253 | Esophagus | ESCC | blastocyst formation | 29/8552 | 38/18723 | 1.18e-04 | 8.13e-04 | 29 |
| GO:00439682 | Esophagus | ESCC | histone H2A acetylation | 15/8552 | 17/18723 | 3.48e-04 | 2.03e-03 | 15 |
| GO:00063101 | Esophagus | ESCC | DNA recombination | 168/8552 | 305/18723 | 5.58e-04 | 3.05e-03 | 168 |
| GO:00064731 | Liver | Cirrhotic | protein acetylation | 84/4634 | 201/18723 | 7.50e-08 | 2.25e-06 | 84 |
| GO:00183941 | Liver | Cirrhotic | peptidyl-lysine acetylation | 73/4634 | 169/18723 | 1.08e-07 | 3.07e-06 | 73 |
| GO:00017015 | Liver | Cirrhotic | in utero embryonic development | 134/4634 | 367/18723 | 2.78e-07 | 6.86e-06 | 134 |
| GO:00435431 | Liver | Cirrhotic | protein acylation | 95/4634 | 243/18723 | 4.73e-07 | 1.07e-05 | 95 |
| GO:00182051 | Liver | Cirrhotic | peptidyl-lysine modification | 134/4634 | 376/18723 | 1.29e-06 | 2.59e-05 | 134 |
| Page: 1 2 3 4 5 6 |
| Pathway ID | Tissue | Disease Stage | Description | Gene Ratio | Bg Ratio | pvalue | p.adjust | qvalue | Count |
| hsa04714211 | Esophagus | ESCC | Thermogenesis | 163/4205 | 232/8465 | 9.22e-11 | 1.14e-09 | 5.86e-10 | 163 |
| hsa0522518 | Esophagus | ESCC | Hepatocellular carcinoma | 109/4205 | 168/8465 | 4.27e-05 | 1.88e-04 | 9.64e-05 | 109 |
| hsa04714310 | Esophagus | ESCC | Thermogenesis | 163/4205 | 232/8465 | 9.22e-11 | 1.14e-09 | 5.86e-10 | 163 |
| hsa0522519 | Esophagus | ESCC | Hepatocellular carcinoma | 109/4205 | 168/8465 | 4.27e-05 | 1.88e-04 | 9.64e-05 | 109 |
| hsa0471414 | Liver | Cirrhotic | Thermogenesis | 121/2530 | 232/8465 | 5.70e-13 | 1.36e-11 | 8.36e-12 | 121 |
| hsa0471415 | Liver | Cirrhotic | Thermogenesis | 121/2530 | 232/8465 | 5.70e-13 | 1.36e-11 | 8.36e-12 | 121 |
| hsa0471422 | Liver | HCC | Thermogenesis | 170/4020 | 232/8465 | 5.36e-16 | 2.25e-14 | 1.25e-14 | 170 |
| hsa052258 | Liver | HCC | Hepatocellular carcinoma | 106/4020 | 168/8465 | 2.87e-05 | 1.85e-04 | 1.03e-04 | 106 |
| hsa0471432 | Liver | HCC | Thermogenesis | 170/4020 | 232/8465 | 5.36e-16 | 2.25e-14 | 1.25e-14 | 170 |
| hsa0522511 | Liver | HCC | Hepatocellular carcinoma | 106/4020 | 168/8465 | 2.87e-05 | 1.85e-04 | 1.03e-04 | 106 |
| hsa0471430 | Oral cavity | OSCC | Thermogenesis | 138/3704 | 232/8465 | 7.67e-07 | 4.35e-06 | 2.22e-06 | 138 |
| hsa0522516 | Oral cavity | OSCC | Hepatocellular carcinoma | 97/3704 | 168/8465 | 1.63e-04 | 5.52e-04 | 2.81e-04 | 97 |
| hsa04714113 | Oral cavity | OSCC | Thermogenesis | 138/3704 | 232/8465 | 7.67e-07 | 4.35e-06 | 2.22e-06 | 138 |
| hsa0522517 | Oral cavity | OSCC | Hepatocellular carcinoma | 97/3704 | 168/8465 | 1.63e-04 | 5.52e-04 | 2.81e-04 | 97 |
| hsa04714210 | Oral cavity | LP | Thermogenesis | 105/2418 | 232/8465 | 3.14e-08 | 4.98e-07 | 3.21e-07 | 105 |
| hsa0471438 | Oral cavity | LP | Thermogenesis | 105/2418 | 232/8465 | 3.14e-08 | 4.98e-07 | 3.21e-07 | 105 |
| Page: 1 |
Top |
Cell-cell communication analysis |
| Identification of potential cell-cell interactions between two cell types and their ligand-receptor pairs for different disease states |
| Ligand | Receptor | LRpair | Pathway | Tissue | Disease Stage |
| Page: 1 |
Top |
Single-cell gene regulatory network inference analysis |
| Find out the significant the regulons (TFs) and the target genes of each regulon across cell types for different disease states |
| TF | Cell Type | Tissue | Disease Stage | Target Gene | RSS | Regulon Activity |
| ∗The dot plots of a searched regulon are shown for all cell subpopulations in each disease state of each tissue based on the regulon specific score inferred using pySCENIC and by calculating the average expression. |
| Page: 1 |
Top |
Somatic mutation of malignant transformation related genes |
| Annotation of somatic variants for genes involved in malignant transformation |
| Hugo Symbol | Variant Class | Variant Classification | dbSNP RS | HGVSc | HGVSp | HGVSp Short | SWISSPROT | BIOTYPE | SIFT | PolyPhen | Tumor Sample Barcode | Tissue | Histology | Sex | Age | Stage | Therapy Types | Drugs | Outcome |
| ACTL6A | SNV | Missense_Mutation | c.781N>A | p.Asp261Asn | p.D261N | O96019 | protein_coding | deleterious(0) | probably_damaging(0.965) | TCGA-AO-A128-01 | Breast | breast invasive carcinoma | Female | <65 | I/II | Chemotherapy | doxorubicin | SD | |
| ACTL6A | SNV | Missense_Mutation | rs748257527 | c.121A>G | p.Ile41Val | p.I41V | O96019 | protein_coding | tolerated(1) | benign(0.003) | TCGA-FU-A3TQ-01 | Cervix | cervical & endocervical cancer | Female | <65 | III/IV | Unknown | Unknown | SD |
| ACTL6A | SNV | Missense_Mutation | c.630N>G | p.Phe210Leu | p.F210L | O96019 | protein_coding | tolerated(1) | benign(0.014) | TCGA-JW-A5VL-01 | Cervix | cervical & endocervical cancer | Female | <65 | I/II | Unknown | Unknown | SD | |
| ACTL6A | SNV | Missense_Mutation | c.1166N>T | p.Arg389Leu | p.R389L | O96019 | protein_coding | deleterious(0) | probably_damaging(0.909) | TCGA-A6-2672-01 | Colorectum | colon adenocarcinoma | Female | >=65 | III/IV | Unknown | Unknown | SD | |
| ACTL6A | SNV | Missense_Mutation | rs201109652 | c.524N>T | p.Thr175Ile | p.T175I | O96019 | protein_coding | deleterious(0.04) | probably_damaging(0.978) | TCGA-AA-3710-01 | Colorectum | colon adenocarcinoma | Female | >=65 | I/II | Unknown | Unknown | SD |
| ACTL6A | SNV | Missense_Mutation | novel | c.511N>A | p.Asp171Asn | p.D171N | O96019 | protein_coding | deleterious(0) | possibly_damaging(0.789) | TCGA-AA-3939-01 | Colorectum | colon adenocarcinoma | Male | >=65 | I/II | Unknown | Unknown | SD |
| ACTL6A | SNV | Missense_Mutation | novel | c.403N>C | p.Lys135Gln | p.K135Q | O96019 | protein_coding | tolerated(0.05) | possibly_damaging(0.644) | TCGA-AA-3947-01 | Colorectum | colon adenocarcinoma | Female | <65 | I/II | Unknown | Unknown | SD |
| ACTL6A | SNV | Missense_Mutation | c.402N>T | p.Glu134Asp | p.E134D | O96019 | protein_coding | deleterious(0.01) | possibly_damaging(0.527) | TCGA-AA-A00N-01 | Colorectum | colon adenocarcinoma | Male | >=65 | I/II | Unknown | Unknown | PD | |
| ACTL6A | SNV | Missense_Mutation | c.1166N>A | p.Arg389Gln | p.R389Q | O96019 | protein_coding | deleterious(0) | possibly_damaging(0.874) | TCGA-WS-AB45-01 | Colorectum | colon adenocarcinoma | Female | <65 | I/II | Unknown | Unknown | SD | |
| ACTL6A | SNV | Missense_Mutation | rs868064163 | c.1129N>T | p.Arg377Trp | p.R377W | O96019 | protein_coding | deleterious(0) | probably_damaging(0.993) | TCGA-AG-A002-01 | Colorectum | rectum adenocarcinoma | Male | <65 | I/II | Unknown | Unknown | SD |
| Page: 1 2 3 4 |
Top |
Related drugs of malignant transformation related genes |
| Identification of chemicals and drugs interact with genes involved in malignant transfromation |
| (DGIdb 4.0) |
| Entrez ID | Symbol | Category | Interaction Types | Drug Claim Name | Drug Name | PMIDs |
| Page: 1 |

Copyright 2023-Present -The University of Texas Health Science Center at Houston |