
|
|||||
|
 | |
| |
| |
| |
| |
| |
|
Gene: ACTA2 |
Gene summary for ACTA2 |
| Gene information | Species | Human | Gene symbol | ACTA2 | Gene ID | 59 |
| Gene name | actin alpha 2, smooth muscle | |
| Gene Alias | ACTSA | |
| Cytomap | 10q23.31 | |
| Gene Type | protein-coding | GO ID | GO:0001568 | UniProtAcc | D2JYH4 |
Top |
Malignant transformation analysis |
| Identification of the aberrant gene expression in precancerous and cancerous lesions by comparing the gene expression of stem-like cells in diseased tissues with normal stem cells |
| Entrez ID | Symbol | Replicates | Species | Organ | Tissue | Adj P-value | Log2FC | Malignancy |
| 59 | ACTA2 | AEH-subject1 | Human | Endometrium | AEH | 6.62e-14 | -5.20e-01 | -0.3059 |
| 59 | ACTA2 | AEH-subject2 | Human | Endometrium | AEH | 5.24e-08 | -4.11e-01 | -0.2525 |
| 59 | ACTA2 | AEH-subject3 | Human | Endometrium | AEH | 3.98e-04 | -2.89e-01 | -0.2576 |
| 59 | ACTA2 | AEH-subject4 | Human | Endometrium | AEH | 3.42e-07 | -4.53e-01 | -0.2657 |
| 59 | ACTA2 | AEH-subject5 | Human | Endometrium | AEH | 4.86e-13 | -3.73e-01 | -0.2953 |
| 59 | ACTA2 | EEC-subject1 | Human | Endometrium | EEC | 8.74e-20 | -5.28e-01 | -0.2682 |
| 59 | ACTA2 | EEC-subject2 | Human | Endometrium | EEC | 1.59e-10 | -4.90e-01 | -0.2607 |
| 59 | ACTA2 | EEC-subject3 | Human | Endometrium | EEC | 1.72e-13 | -2.38e-01 | -0.2525 |
| 59 | ACTA2 | EEC-subject4 | Human | Endometrium | EEC | 7.32e-05 | -3.28e-01 | -0.2571 |
| 59 | ACTA2 | EEC-subject5 | Human | Endometrium | EEC | 1.41e-20 | -5.57e-01 | -0.249 |
| 59 | ACTA2 | GSM5276934 | Human | Endometrium | EEC | 1.02e-04 | -3.50e-01 | -0.0913 |
| 59 | ACTA2 | GSM5276935 | Human | Endometrium | EEC | 1.22e-26 | -5.62e-01 | -0.123 |
| 59 | ACTA2 | GSM5276937 | Human | Endometrium | EEC | 1.11e-06 | -4.42e-01 | -0.0897 |
| 59 | ACTA2 | GSM6177620_NYU_UCEC1_lib1_lib1 | Human | Endometrium | EEC | 1.17e-21 | -5.89e-01 | -0.1869 |
| 59 | ACTA2 | GSM6177620_NYU_UCEC1_lib2_lib2 | Human | Endometrium | EEC | 6.69e-15 | -5.61e-01 | -0.1875 |
| 59 | ACTA2 | GSM6177620_NYU_UCEC1_lib3_lib3 | Human | Endometrium | EEC | 3.57e-16 | -5.31e-01 | -0.1883 |
| 59 | ACTA2 | GSM6177621_NYU_UCEC2_lib1_lib1 | Human | Endometrium | EEC | 2.55e-24 | -5.34e-01 | -0.1934 |
| 59 | ACTA2 | GSM6177622_NYU_UCEC3_lib1_lib1 | Human | Endometrium | EEC | 1.23e-27 | -5.68e-01 | -0.1917 |
| 59 | ACTA2 | GSM6177622_NYU_UCEC3_lib2_lib2 | Human | Endometrium | EEC | 2.65e-22 | -5.30e-01 | -0.1916 |
| 59 | ACTA2 | P2T-E | Human | Esophagus | ESCC | 5.22e-43 | 1.04e+00 | 0.1177 |
| Page: 1 2 3 4 5 |
| Tissue | Expression Dynamics | Abbreviation |
| Endometrium |  | AEH: Atypical endometrial hyperplasia |
| EEC: Endometrioid Cancer | ||
| Esophagus | 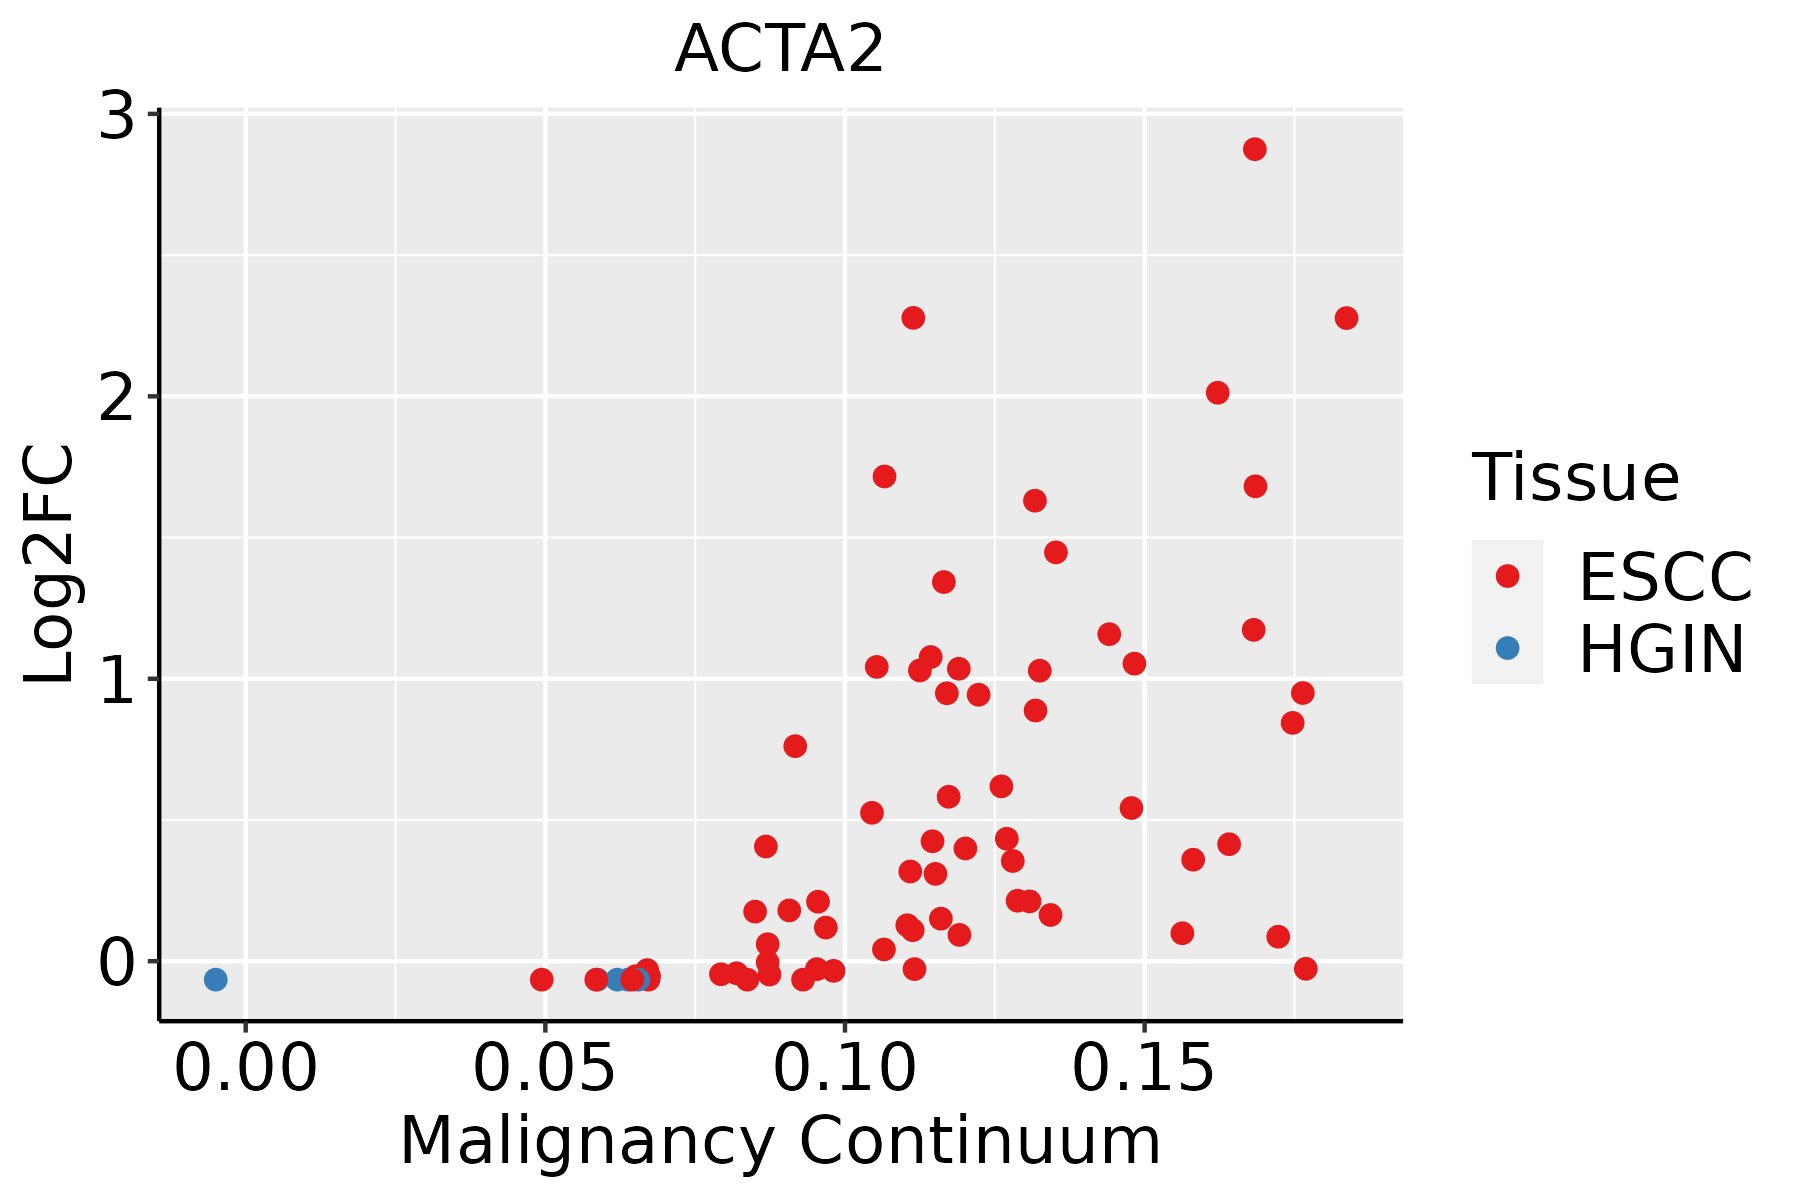 | ESCC: Esophageal squamous cell carcinoma |
| HGIN: High-grade intraepithelial neoplasias | ||
| LGIN: Low-grade intraepithelial neoplasias | ||
| Liver |  | HCC: Hepatocellular carcinoma |
| NAFLD: Non-alcoholic fatty liver disease | ||
| Oral Cavity |  | EOLP: Erosive Oral lichen planus |
| LP: leukoplakia | ||
| NEOLP: Non-erosive oral lichen planus | ||
| OSCC: Oral squamous cell carcinoma | ||
| Prostate |  | BPH: Benign Prostatic Hyperplasia |
| Thyroid |  | ATC: Anaplastic thyroid cancer |
| HT: Hashimoto's thyroiditis | ||
| PTC: Papillary thyroid cancer |
| ∗log2FC in expression of this searched gene in stem-like cells from each diseased tissue sample relative to stem-like cells in normal samples in each tissue plotted against the malignancy continuum. Samples are colored based on if they are from different disease stage. |
Top |
Malignant transformation related pathway analysis |
| Find out the enriched GO biological processes and KEGG pathways involved in transition from healthy to precancer to cancer |
| Tissue | Disease Stage | Enriched GO biological Processes |
| Colorectum | AD |  |
| Colorectum | SER |  |
| Colorectum | MSS |  |
| Colorectum | MSI-H |  |
| Colorectum | FAP |  |
| ∗Top 15 enriched GO BP terms are showed in the bar plot of each disease state in each tissue. Each row represents a significant GO biological process which is colored according to the -log10(p.adjust). |
| Page: 1 2 3 4 5 6 7 8 9 |
| GO ID | Tissue | Disease Stage | Description | Gene Ratio | Bg Ratio | pvalue | p.adjust | Count |
| GO:009013014 | Endometrium | AEH | tissue migration | 73/2100 | 365/18723 | 5.79e-07 | 2.20e-05 | 73 |
| GO:00016556 | Endometrium | AEH | urogenital system development | 67/2100 | 338/18723 | 2.30e-06 | 6.76e-05 | 67 |
| GO:00720015 | Endometrium | AEH | renal system development | 61/2100 | 302/18723 | 3.43e-06 | 9.24e-05 | 61 |
| GO:00018224 | Endometrium | AEH | kidney development | 57/2100 | 293/18723 | 2.25e-05 | 4.35e-04 | 57 |
| GO:00030126 | Endometrium | AEH | muscle system process | 78/2100 | 452/18723 | 6.89e-05 | 1.06e-03 | 78 |
| GO:00604853 | Endometrium | AEH | mesenchyme development | 54/2100 | 291/18723 | 1.34e-04 | 1.83e-03 | 54 |
| GO:000206415 | Endometrium | AEH | epithelial cell development | 43/2100 | 220/18723 | 1.94e-04 | 2.48e-03 | 43 |
| GO:00096159 | Endometrium | AEH | response to virus | 63/2100 | 367/18723 | 3.81e-04 | 4.10e-03 | 63 |
| GO:0006936 | Endometrium | AEH | muscle contraction | 59/2100 | 347/18723 | 7.32e-04 | 6.99e-03 | 59 |
| GO:00720064 | Endometrium | AEH | nephron development | 29/2100 | 142/18723 | 9.80e-04 | 8.89e-03 | 29 |
| GO:00610052 | Endometrium | AEH | cell differentiation involved in kidney development | 15/2100 | 57/18723 | 1.20e-03 | 1.04e-02 | 15 |
| GO:00358504 | Endometrium | AEH | epithelial cell differentiation involved in kidney development | 13/2100 | 47/18723 | 1.53e-03 | 1.26e-02 | 13 |
| GO:0061448 | Endometrium | AEH | connective tissue development | 44/2100 | 252/18723 | 1.92e-03 | 1.51e-02 | 44 |
| GO:000165512 | Endometrium | EEC | urogenital system development | 69/2168 | 338/18723 | 1.70e-06 | 5.18e-05 | 69 |
| GO:009013015 | Endometrium | EEC | tissue migration | 73/2168 | 365/18723 | 1.91e-06 | 5.78e-05 | 73 |
| GO:007200112 | Endometrium | EEC | renal system development | 63/2168 | 302/18723 | 2.24e-06 | 6.59e-05 | 63 |
| GO:000182212 | Endometrium | EEC | kidney development | 59/2168 | 293/18723 | 1.44e-05 | 2.87e-04 | 59 |
| GO:000206416 | Endometrium | EEC | epithelial cell development | 45/2168 | 220/18723 | 9.73e-05 | 1.35e-03 | 45 |
| GO:000301213 | Endometrium | EEC | muscle system process | 79/2168 | 452/18723 | 1.16e-04 | 1.55e-03 | 79 |
| GO:000961513 | Endometrium | EEC | response to virus | 66/2168 | 367/18723 | 1.78e-04 | 2.20e-03 | 66 |
| Page: 1 2 3 4 5 |
| Pathway ID | Tissue | Disease Stage | Description | Gene Ratio | Bg Ratio | pvalue | p.adjust | qvalue | Count |
| hsa049268 | Esophagus | ESCC | Relaxin signaling pathway | 81/4205 | 129/8465 | 1.72e-03 | 5.09e-03 | 2.61e-03 | 81 |
| hsa0492616 | Esophagus | ESCC | Relaxin signaling pathway | 81/4205 | 129/8465 | 1.72e-03 | 5.09e-03 | 2.61e-03 | 81 |
| hsa049262 | Liver | HCC | Relaxin signaling pathway | 75/4020 | 129/8465 | 9.33e-03 | 2.46e-02 | 1.37e-02 | 75 |
| hsa0492611 | Liver | HCC | Relaxin signaling pathway | 75/4020 | 129/8465 | 9.33e-03 | 2.46e-02 | 1.37e-02 | 75 |
| hsa049267 | Oral cavity | OSCC | Relaxin signaling pathway | 74/3704 | 129/8465 | 1.20e-03 | 3.37e-03 | 1.72e-03 | 74 |
| hsa0492615 | Oral cavity | OSCC | Relaxin signaling pathway | 74/3704 | 129/8465 | 1.20e-03 | 3.37e-03 | 1.72e-03 | 74 |
| hsa042704 | Oral cavity | NEOLP | Vascular smooth muscle contraction | 30/1112 | 134/8465 | 2.06e-03 | 8.97e-03 | 5.64e-03 | 30 |
| hsa0492641 | Oral cavity | NEOLP | Relaxin signaling pathway | 29/1112 | 129/8465 | 2.27e-03 | 9.62e-03 | 6.05e-03 | 29 |
| hsa048145 | Oral cavity | NEOLP | Motor proteins | 37/1112 | 193/8465 | 1.06e-02 | 3.54e-02 | 2.22e-02 | 37 |
| hsa0427011 | Oral cavity | NEOLP | Vascular smooth muscle contraction | 30/1112 | 134/8465 | 2.06e-03 | 8.97e-03 | 5.64e-03 | 30 |
| hsa0492651 | Oral cavity | NEOLP | Relaxin signaling pathway | 29/1112 | 129/8465 | 2.27e-03 | 9.62e-03 | 6.05e-03 | 29 |
| hsa0481412 | Oral cavity | NEOLP | Motor proteins | 37/1112 | 193/8465 | 1.06e-02 | 3.54e-02 | 2.22e-02 | 37 |
| hsa049266 | Prostate | BPH | Relaxin signaling pathway | 39/1718 | 129/8465 | 4.55e-03 | 1.55e-02 | 9.58e-03 | 39 |
| hsa0492614 | Prostate | BPH | Relaxin signaling pathway | 39/1718 | 129/8465 | 4.55e-03 | 1.55e-02 | 9.58e-03 | 39 |
| Page: 1 |
Top |
Cell-cell communication analysis |
| Identification of potential cell-cell interactions between two cell types and their ligand-receptor pairs for different disease states |
| Ligand | Receptor | LRpair | Pathway | Tissue | Disease Stage |
| Page: 1 |
Top |
Single-cell gene regulatory network inference analysis |
| Find out the significant the regulons (TFs) and the target genes of each regulon across cell types for different disease states |
| TF | Cell Type | Tissue | Disease Stage | Target Gene | RSS | Regulon Activity |
| ∗The dot plots of a searched regulon are shown for all cell subpopulations in each disease state of each tissue based on the regulon specific score inferred using pySCENIC and by calculating the average expression. |
| Page: 1 |
Top |
Somatic mutation of malignant transformation related genes |
| Annotation of somatic variants for genes involved in malignant transformation |
| Hugo Symbol | Variant Class | Variant Classification | dbSNP RS | HGVSc | HGVSp | HGVSp Short | SWISSPROT | BIOTYPE | SIFT | PolyPhen | Tumor Sample Barcode | Tissue | Histology | Sex | Age | Stage | Therapy Types | Drugs | Outcome |
| ACTA2 | SNV | Missense_Mutation | rs397516684 | c.607G>A | p.Val203Ile | p.V203I | P62736 | protein_coding | deleterious_low_confidence(0.04) | benign(0.015) | TCGA-AN-A0AK-01 | Breast | breast invasive carcinoma | Female | >=65 | I/II | Unknown | Unknown | SD |
| ACTA2 | SNV | Missense_Mutation | c.554G>A | p.Arg185Gln | p.R185Q | P62736 | protein_coding | deleterious_low_confidence(0.03) | probably_damaging(0.999) | TCGA-AO-A0JM-01 | Breast | breast invasive carcinoma | Female | <65 | I/II | Chemotherapy | doxorubicin | SD | |
| ACTA2 | SNV | Missense_Mutation | rs794728021 | c.116G>A | p.Arg39His | p.R39H | P62736 | protein_coding | tolerated_low_confidence(0.06) | benign(0.042) | TCGA-BH-A1F6-01 | Breast | breast invasive carcinoma | Female | <65 | III/IV | Unknown | Unknown | SD |
| ACTA2 | SNV | Missense_Mutation | rs397516684 | c.607N>A | p.Val203Ile | p.V203I | P62736 | protein_coding | deleterious_low_confidence(0.04) | benign(0.015) | TCGA-D8-A27W-01 | Breast | breast invasive carcinoma | Female | <65 | III/IV | Chemotherapy | doxorubicine+cyclophosphamide | SD |
| ACTA2 | SNV | Missense_Mutation | c.862G>T | p.Asp288Tyr | p.D288Y | P62736 | protein_coding | deleterious_low_confidence(0) | probably_damaging(0.984) | TCGA-E2-A1IH-01 | Breast | breast invasive carcinoma | Female | >=65 | I/II | Hormone Therapy | aromasin | SD | |
| ACTA2 | SNV | Missense_Mutation | novel | c.800N>G | p.Ser267Cys | p.S267C | P62736 | protein_coding | deleterious_low_confidence(0.03) | benign(0.244) | TCGA-VS-A9UH-01 | Cervix | cervical & endocervical cancer | Female | <65 | I/II | Chemotherapy | cisplatin | CR |
| ACTA2 | SNV | Missense_Mutation | rs397516684 | c.607N>A | p.Val203Ile | p.V203I | P62736 | protein_coding | deleterious_low_confidence(0.04) | benign(0.015) | TCGA-AA-3715-01 | Colorectum | colon adenocarcinoma | Male | >=65 | I/II | Unknown | Unknown | PD |
| ACTA2 | SNV | Missense_Mutation | c.327G>T | p.Glu109Asp | p.E109D | P62736 | protein_coding | deleterious_low_confidence(0.01) | possibly_damaging(0.64) | TCGA-AA-3947-01 | Colorectum | colon adenocarcinoma | Female | <65 | I/II | Unknown | Unknown | SD | |
| ACTA2 | SNV | Missense_Mutation | novel | c.386N>C | p.Phe129Ser | p.F129S | P62736 | protein_coding | deleterious_low_confidence(0.01) | possibly_damaging(0.676) | TCGA-CA-6717-01 | Colorectum | colon adenocarcinoma | Male | <65 | I/II | Chemotherapy | oxaliplatin | CR |
| ACTA2 | insertion | Nonsense_Mutation | novel | c.1065_1066insTGCTAGAGA | p.Gln355_Gln356insCysTerArg | p.Q355_Q356insC*R | P62736 | protein_coding | TCGA-AM-5820-01 | Colorectum | colon adenocarcinoma | Female | <65 | I/II | Unknown | Unknown | SD |
| Page: 1 2 3 4 |
Top |
Related drugs of malignant transformation related genes |
| Identification of chemicals and drugs interact with genes involved in malignant transfromation |
| (DGIdb 4.0) |
| Entrez ID | Symbol | Category | Interaction Types | Drug Claim Name | Drug Name | PMIDs |
| Page: 1 |

Copyright 2023-Present -The University of Texas Health Science Center at Houston |