
|
|||||
|
 | |
| |
| |
| |
| |
| |
|
Gene: ACSM2A |
Gene summary for ACSM2A |
| Gene information | Species | Human | Gene symbol | ACSM2A | Gene ID | 123876 |
| Gene name | acyl-CoA synthetase medium chain family member 2A | |
| Gene Alias | A-923A4.1 | |
| Cytomap | 16p12.3 | |
| Gene Type | protein-coding | GO ID | GO:0006082 | UniProtAcc | B7Z530 |
Top |
Malignant transformation analysis |
| Identification of the aberrant gene expression in precancerous and cancerous lesions by comparing the gene expression of stem-like cells in diseased tissues with normal stem cells |
| Entrez ID | Symbol | Replicates | Species | Organ | Tissue | Adj P-value | Log2FC | Malignancy |
| 123876 | ACSM2A | NAFLD1 | Human | Liver | NAFLD | 6.60e-21 | 1.78e+00 | -0.04 |
| 123876 | ACSM2A | S41 | Human | Liver | Cirrhotic | 2.46e-04 | 6.16e-01 | -0.0343 |
| 123876 | ACSM2A | HCC1_Meng | Human | Liver | HCC | 1.08e-35 | -4.05e-01 | 0.0246 |
| 123876 | ACSM2A | HCC2_Meng | Human | Liver | HCC | 4.58e-11 | -4.45e-01 | 0.0107 |
| 123876 | ACSM2A | cirrhotic1 | Human | Liver | Cirrhotic | 1.01e-10 | -3.54e-01 | 0.0202 |
| 123876 | ACSM2A | cirrhotic2 | Human | Liver | Cirrhotic | 5.12e-12 | -3.96e-01 | 0.0201 |
| 123876 | ACSM2A | cirrhotic3 | Human | Liver | Cirrhotic | 6.98e-06 | -3.83e-01 | 0.0215 |
| 123876 | ACSM2A | HCC1 | Human | Liver | HCC | 5.78e-34 | 4.99e+00 | 0.5336 |
| 123876 | ACSM2A | HCC2 | Human | Liver | HCC | 2.33e-24 | 3.39e+00 | 0.5341 |
| 123876 | ACSM2A | HCC5 | Human | Liver | HCC | 4.88e-13 | 2.31e+00 | 0.4932 |
| 123876 | ACSM2A | Pt13.a | Human | Liver | HCC | 1.06e-15 | -2.26e-01 | 0.021 |
| 123876 | ACSM2A | Pt13.b | Human | Liver | HCC | 6.16e-28 | -1.62e-01 | 0.0251 |
| 123876 | ACSM2A | Pt14.a | Human | Liver | HCC | 2.16e-03 | -1.85e-01 | 0.0169 |
| 123876 | ACSM2A | Pt14.b | Human | Liver | HCC | 2.08e-14 | 3.02e-01 | 0.018 |
| 123876 | ACSM2A | Pt14.d | Human | Liver | HCC | 7.55e-15 | -1.41e-01 | 0.0143 |
| 123876 | ACSM2A | S014 | Human | Liver | HCC | 1.33e-03 | -3.58e-01 | 0.2254 |
| 123876 | ACSM2A | S016 | Human | Liver | HCC | 1.73e-03 | -4.39e-01 | 0.2243 |
| Page: 1 |
| Tissue | Expression Dynamics | Abbreviation |
| Liver | 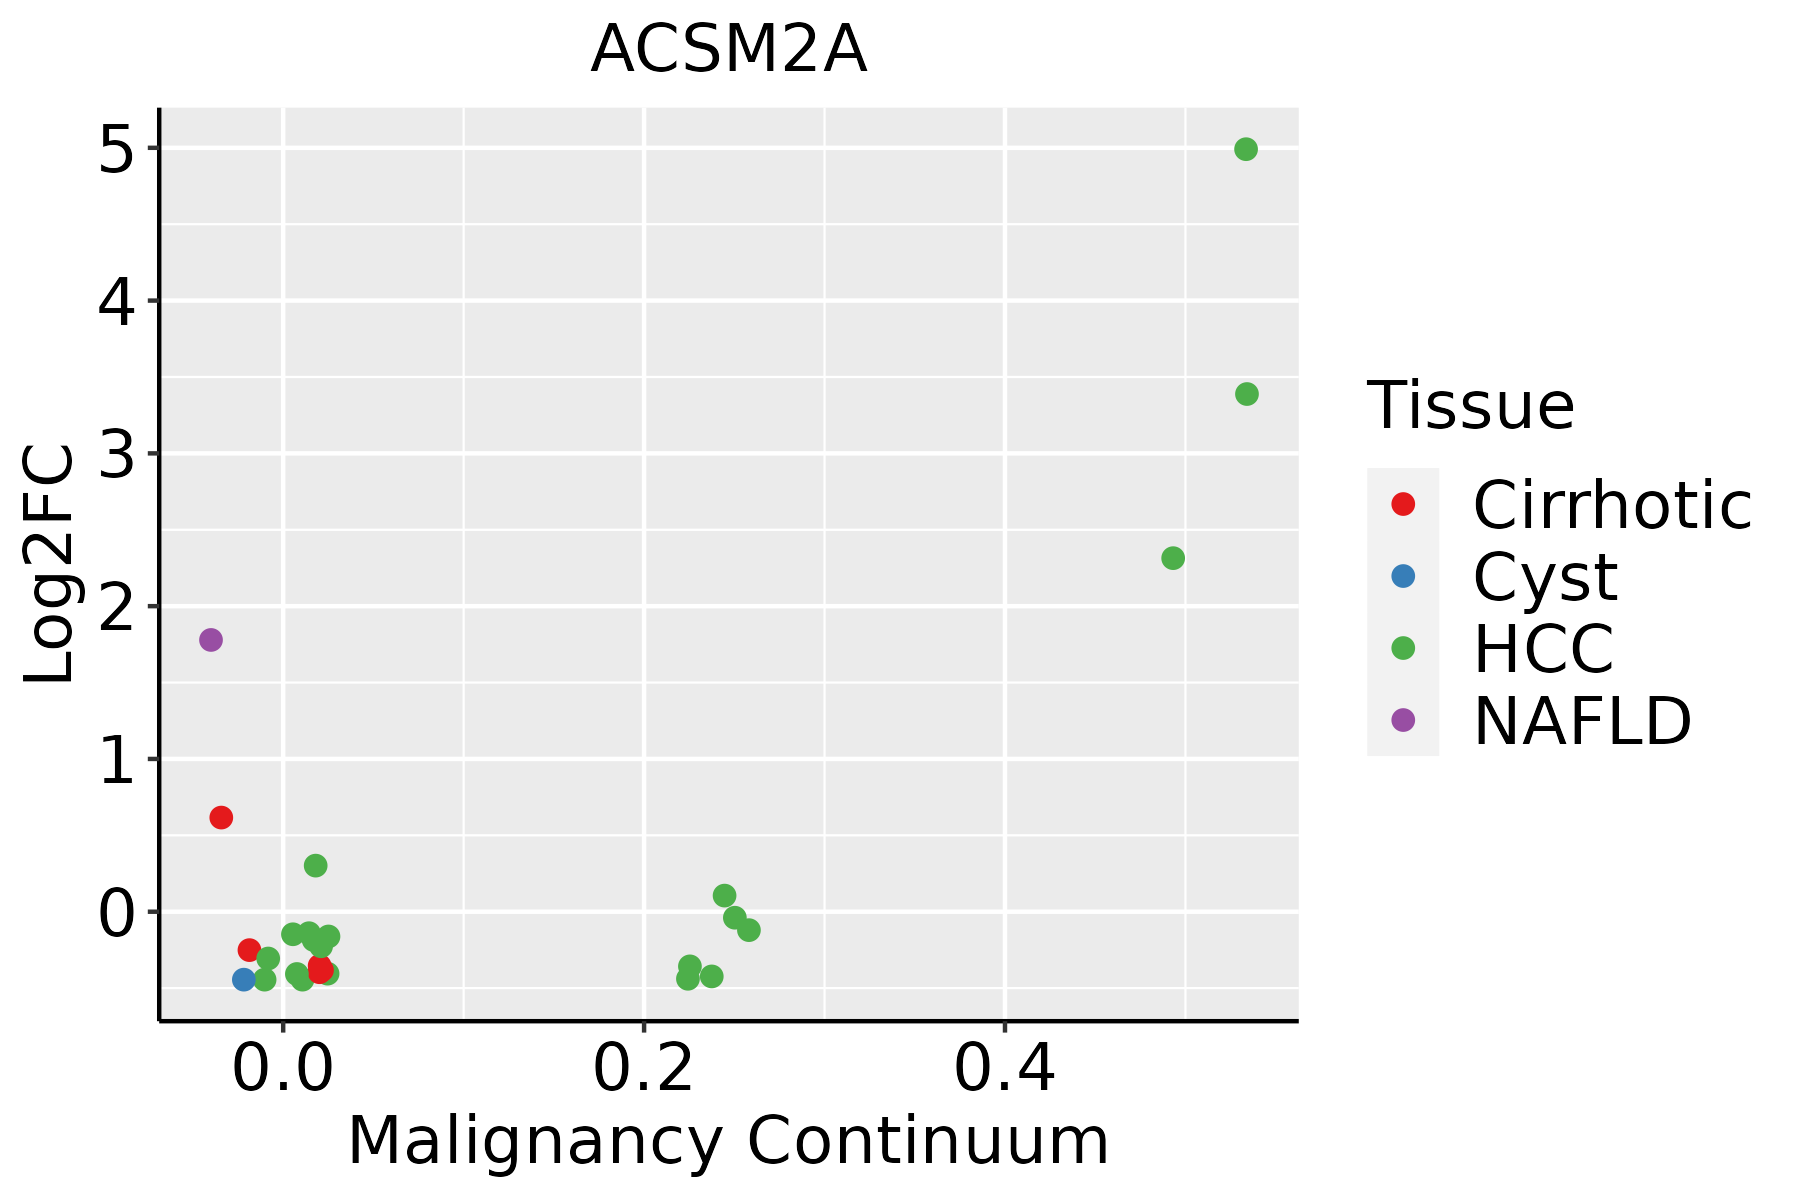 | HCC: Hepatocellular carcinoma |
| NAFLD: Non-alcoholic fatty liver disease |
| ∗log2FC in expression of this searched gene in stem-like cells from each diseased tissue sample relative to stem-like cells in normal samples in each tissue plotted against the malignancy continuum. Samples are colored based on if they are from different disease stage. |
Top |
Malignant transformation related pathway analysis |
| Find out the enriched GO biological processes and KEGG pathways involved in transition from healthy to precancer to cancer |
| Tissue | Disease Stage | Enriched GO biological Processes |
| Colorectum | AD |  |
| Colorectum | SER |  |
| Colorectum | MSS |  |
| Colorectum | MSI-H |  |
| Colorectum | FAP |  |
| ∗Top 15 enriched GO BP terms are showed in the bar plot of each disease state in each tissue. Each row represents a significant GO biological process which is colored according to the -log10(p.adjust). |
| Page: 1 2 3 4 5 6 7 8 9 |
| GO ID | Tissue | Disease Stage | Description | Gene Ratio | Bg Ratio | pvalue | p.adjust | Count |
| GO:00066316 | Liver | NAFLD | fatty acid metabolic process | 92/1882 | 390/18723 | 3.38e-15 | 3.29e-12 | 92 |
| GO:00160535 | Liver | NAFLD | organic acid biosynthetic process | 77/1882 | 316/18723 | 1.03e-13 | 6.69e-11 | 77 |
| GO:00463945 | Liver | NAFLD | carboxylic acid biosynthetic process | 75/1882 | 314/18723 | 6.37e-13 | 3.39e-10 | 75 |
| GO:00550883 | Liver | NAFLD | lipid homeostasis | 44/1882 | 167/18723 | 1.48e-09 | 2.54e-07 | 44 |
| GO:00092596 | Liver | NAFLD | ribonucleotide metabolic process | 72/1882 | 385/18723 | 1.51e-07 | 1.09e-05 | 72 |
| GO:0055090 | Liver | NAFLD | acylglycerol homeostasis | 17/1882 | 42/18723 | 2.22e-07 | 1.53e-05 | 17 |
| GO:0070328 | Liver | NAFLD | triglyceride homeostasis | 17/1882 | 42/18723 | 2.22e-07 | 1.53e-05 | 17 |
| GO:00196936 | Liver | NAFLD | ribose phosphate metabolic process | 73/1882 | 396/18723 | 2.23e-07 | 1.53e-05 | 73 |
| GO:00091177 | Liver | NAFLD | nucleotide metabolic process | 85/1882 | 489/18723 | 3.31e-07 | 2.18e-05 | 85 |
| GO:00723303 | Liver | NAFLD | monocarboxylic acid biosynthetic process | 46/1882 | 214/18723 | 5.06e-07 | 3.07e-05 | 46 |
| GO:00067537 | Liver | NAFLD | nucleoside phosphate metabolic process | 85/1882 | 497/18723 | 6.69e-07 | 3.83e-05 | 85 |
| GO:00725217 | Liver | NAFLD | purine-containing compound metabolic process | 74/1882 | 416/18723 | 7.73e-07 | 4.27e-05 | 74 |
| GO:00091507 | Liver | NAFLD | purine ribonucleotide metabolic process | 67/1882 | 368/18723 | 1.10e-06 | 5.44e-05 | 67 |
| GO:00061637 | Liver | NAFLD | purine nucleotide metabolic process | 70/1882 | 396/18723 | 1.93e-06 | 8.23e-05 | 70 |
| GO:00067904 | Liver | NAFLD | sulfur compound metabolic process | 58/1882 | 339/18723 | 3.79e-05 | 9.38e-04 | 58 |
| GO:00338653 | Liver | NAFLD | nucleoside bisphosphate metabolic process | 28/1882 | 128/18723 | 5.89e-05 | 1.30e-03 | 28 |
| GO:00338753 | Liver | NAFLD | ribonucleoside bisphosphate metabolic process | 28/1882 | 128/18723 | 5.89e-05 | 1.30e-03 | 28 |
| GO:00340323 | Liver | NAFLD | purine nucleoside bisphosphate metabolic process | 28/1882 | 128/18723 | 5.89e-05 | 1.30e-03 | 28 |
| GO:00425936 | Liver | NAFLD | glucose homeostasis | 45/1882 | 258/18723 | 1.71e-04 | 3.08e-03 | 45 |
| GO:00335006 | Liver | NAFLD | carbohydrate homeostasis | 45/1882 | 259/18723 | 1.87e-04 | 3.29e-03 | 45 |
| Page: 1 2 3 4 |
| Pathway ID | Tissue | Disease Stage | Description | Gene Ratio | Bg Ratio | pvalue | p.adjust | qvalue | Count |
| hsa00650 | Liver | NAFLD | Butanoate metabolism | 11/1043 | 27/8465 | 1.88e-04 | 3.62e-03 | 2.92e-03 | 11 |
| hsa006501 | Liver | NAFLD | Butanoate metabolism | 11/1043 | 27/8465 | 1.88e-04 | 3.62e-03 | 2.92e-03 | 11 |
| hsa006504 | Liver | HCC | Butanoate metabolism | 19/4020 | 27/8465 | 1.37e-02 | 3.33e-02 | 1.85e-02 | 19 |
| hsa006505 | Liver | HCC | Butanoate metabolism | 19/4020 | 27/8465 | 1.37e-02 | 3.33e-02 | 1.85e-02 | 19 |
| Page: 1 |
Top |
Cell-cell communication analysis |
| Identification of potential cell-cell interactions between two cell types and their ligand-receptor pairs for different disease states |
| Ligand | Receptor | LRpair | Pathway | Tissue | Disease Stage |
| Page: 1 |
Top |
Single-cell gene regulatory network inference analysis |
| Find out the significant the regulons (TFs) and the target genes of each regulon across cell types for different disease states |
| TF | Cell Type | Tissue | Disease Stage | Target Gene | RSS | Regulon Activity |
| ∗The dot plots of a searched regulon are shown for all cell subpopulations in each disease state of each tissue based on the regulon specific score inferred using pySCENIC and by calculating the average expression. |
| Page: 1 |
Top |
Somatic mutation of malignant transformation related genes |
| Annotation of somatic variants for genes involved in malignant transformation |
| Hugo Symbol | Variant Class | Variant Classification | dbSNP RS | HGVSc | HGVSp | HGVSp Short | SWISSPROT | BIOTYPE | SIFT | PolyPhen | Tumor Sample Barcode | Tissue | Histology | Sex | Age | Stage | Therapy Types | Drugs | Outcome |
| ACSM2A | SNV | Missense_Mutation | novel | c.1390N>A | p.Asp464Asn | p.D464N | Q08AH3 | protein_coding | deleterious(0) | probably_damaging(0.991) | TCGA-A2-A0CX-01 | Breast | breast invasive carcinoma | Female | <65 | I/II | Chemotherapy | adriamycin | SD |
| ACSM2A | SNV | Missense_Mutation | c.231N>T | p.Lys77Asn | p.K77N | Q08AH3 | protein_coding | tolerated(0.34) | benign(0) | TCGA-AC-A23H-01 | Breast | breast invasive carcinoma | Female | >=65 | I/II | Unknown | Unknown | PD | |
| ACSM2A | SNV | Missense_Mutation | c.991C>A | p.Leu331Ile | p.L331I | Q08AH3 | protein_coding | deleterious(0) | probably_damaging(0.968) | TCGA-AN-A046-01 | Breast | breast invasive carcinoma | Female | >=65 | I/II | Unknown | Unknown | SD | |
| ACSM2A | SNV | Missense_Mutation | c.985N>T | p.Pro329Ser | p.P329S | Q08AH3 | protein_coding | tolerated(0.11) | benign(0.104) | TCGA-AN-A0XU-01 | Breast | breast invasive carcinoma | Female | <65 | I/II | Unknown | Unknown | SD | |
| ACSM2A | SNV | Missense_Mutation | novel | c.1463T>C | p.Val488Ala | p.V488A | Q08AH3 | protein_coding | deleterious(0) | probably_damaging(0.992) | TCGA-GM-A3XL-01 | Breast | breast invasive carcinoma | Female | <65 | I/II | Chemotherapy | fluorouracil | CR |
| ACSM2A | SNV | Missense_Mutation | c.1492G>C | p.Asp498His | p.D498H | Q08AH3 | protein_coding | deleterious(0) | probably_damaging(0.99) | TCGA-IR-A3LH-01 | Cervix | cervical & endocervical cancer | Female | <65 | I/II | Chemotherapy | cisplatin | CR | |
| ACSM2A | SNV | Missense_Mutation | c.580N>A | p.Phe194Ile | p.F194I | Q08AH3 | protein_coding | deleterious(0) | possibly_damaging(0.791) | TCGA-JW-A5VK-01 | Cervix | cervical & endocervical cancer | Female | <65 | I/II | Unknown | Unknown | SD | |
| ACSM2A | SNV | Missense_Mutation | novel | c.296N>C | p.Gly99Ala | p.G99A | Q08AH3 | protein_coding | tolerated(0.34) | benign(0.007) | TCGA-VS-A953-01 | Cervix | cervical & endocervical cancer | Female | <65 | I/II | Unknown | Unknown | PD |
| ACSM2A | SNV | Missense_Mutation | rs556547446 | c.1415N>A | p.Arg472Gln | p.R472Q | Q08AH3 | protein_coding | deleterious(0) | possibly_damaging(0.655) | TCGA-AA-3811-01 | Colorectum | colon adenocarcinoma | Female | >=65 | III/IV | Unknown | Unknown | PD |
| ACSM2A | SNV | Missense_Mutation | c.739N>A | p.Gly247Ser | p.G247S | Q08AH3 | protein_coding | tolerated(0.41) | benign(0.003) | TCGA-AA-3841-01 | Colorectum | colon adenocarcinoma | Male | >=65 | I/II | Chemotherapy | folinic | CR |
| Page: 1 2 3 4 5 6 7 8 9 10 11 |
Top |
Related drugs of malignant transformation related genes |
| Identification of chemicals and drugs interact with genes involved in malignant transfromation |
| (DGIdb 4.0) |
| Entrez ID | Symbol | Category | Interaction Types | Drug Claim Name | Drug Name | PMIDs |
| Page: 1 |

Copyright 2023-Present -The University of Texas Health Science Center at Houston |