
|
|||||
|
 | |
| |
| |
| |
| |
| |
|
Gene: ACSL5 |
Gene summary for ACSL5 |
| Gene information | Species | Human | Gene symbol | ACSL5 | Gene ID | 51703 |
| Gene name | acyl-CoA synthetase long chain family member 5 | |
| Gene Alias | ACS2 | |
| Cytomap | 10q25.2 | |
| Gene Type | protein-coding | GO ID | GO:0001676 | UniProtAcc | Q9ULC5 |
Top |
Malignant transformation analysis |
| Identification of the aberrant gene expression in precancerous and cancerous lesions by comparing the gene expression of stem-like cells in diseased tissues with normal stem cells |
| Entrez ID | Symbol | Replicates | Species | Organ | Tissue | Adj P-value | Log2FC | Malignancy |
| 51703 | ACSL5 | HTA11_347_2000001011 | Human | Colorectum | AD | 7.42e-05 | 4.40e-01 | -0.1954 |
| 51703 | ACSL5 | HTA11_1391_2000001011 | Human | Colorectum | AD | 1.18e-02 | 5.77e-01 | -0.059 |
| 51703 | ACSL5 | HTA11_99999965104_69814 | Human | Colorectum | MSS | 3.28e-03 | 5.12e-01 | 0.281 |
| 51703 | ACSL5 | HTA11_99999971662_82457 | Human | Colorectum | MSS | 7.29e-03 | 5.77e-01 | 0.3859 |
| 51703 | ACSL5 | A015-C-203 | Human | Colorectum | FAP | 1.59e-27 | -2.77e-01 | -0.1294 |
| 51703 | ACSL5 | A015-C-204 | Human | Colorectum | FAP | 2.65e-05 | -3.18e-01 | -0.0228 |
| 51703 | ACSL5 | A014-C-040 | Human | Colorectum | FAP | 4.68e-04 | -3.99e-01 | -0.1184 |
| 51703 | ACSL5 | A002-C-201 | Human | Colorectum | FAP | 3.92e-15 | -3.85e-01 | 0.0324 |
| 51703 | ACSL5 | A002-C-203 | Human | Colorectum | FAP | 9.19e-05 | 5.16e-02 | 0.2786 |
| 51703 | ACSL5 | A001-C-119 | Human | Colorectum | FAP | 4.13e-05 | -3.27e-02 | -0.1557 |
| 51703 | ACSL5 | A001-C-108 | Human | Colorectum | FAP | 5.89e-18 | -1.27e-01 | -0.0272 |
| 51703 | ACSL5 | A002-C-205 | Human | Colorectum | FAP | 1.20e-21 | -3.63e-01 | -0.1236 |
| 51703 | ACSL5 | A001-C-104 | Human | Colorectum | FAP | 5.17e-05 | -5.45e-02 | 0.0184 |
| 51703 | ACSL5 | A015-C-006 | Human | Colorectum | FAP | 1.10e-13 | -3.41e-01 | -0.0994 |
| 51703 | ACSL5 | A015-C-106 | Human | Colorectum | FAP | 3.32e-13 | -1.65e-02 | -0.0511 |
| 51703 | ACSL5 | A002-C-114 | Human | Colorectum | FAP | 3.13e-18 | -2.92e-01 | -0.1561 |
| 51703 | ACSL5 | A015-C-104 | Human | Colorectum | FAP | 1.71e-36 | -1.70e-01 | -0.1899 |
| 51703 | ACSL5 | A001-C-014 | Human | Colorectum | FAP | 1.66e-15 | -1.81e-01 | 0.0135 |
| 51703 | ACSL5 | A002-C-016 | Human | Colorectum | FAP | 1.25e-27 | -3.42e-01 | 0.0521 |
| 51703 | ACSL5 | A015-C-002 | Human | Colorectum | FAP | 2.20e-12 | -5.26e-01 | -0.0763 |
| Page: 1 2 3 4 5 |
| Tissue | Expression Dynamics | Abbreviation |
| Colorectum (GSE201348) |  | FAP: Familial adenomatous polyposis |
| CRC: Colorectal cancer | ||
| Colorectum (HTA11) |  | AD: Adenomas |
| SER: Sessile serrated lesions | ||
| MSI-H: Microsatellite-high colorectal cancer | ||
| MSS: Microsatellite stable colorectal cancer | ||
| Esophagus | 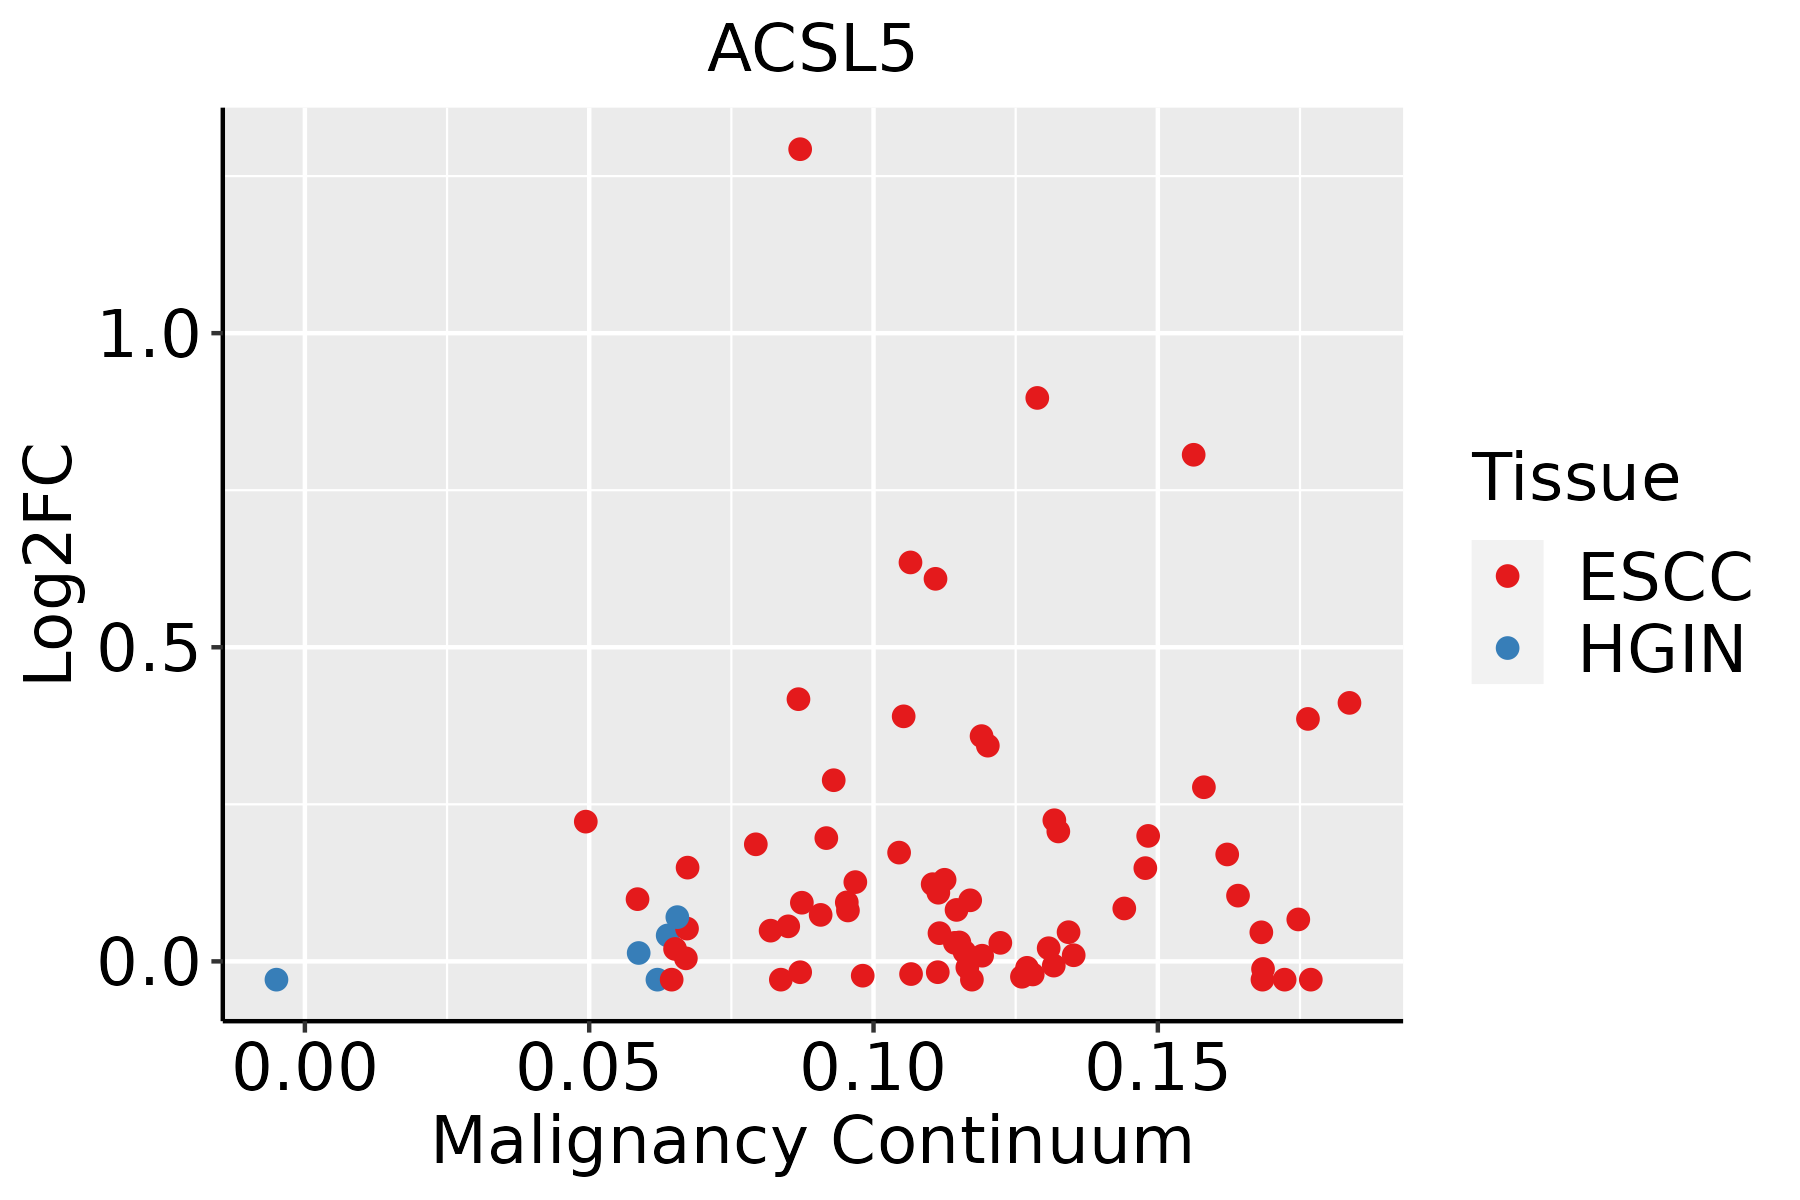 | ESCC: Esophageal squamous cell carcinoma |
| HGIN: High-grade intraepithelial neoplasias | ||
| LGIN: Low-grade intraepithelial neoplasias | ||
| GC | 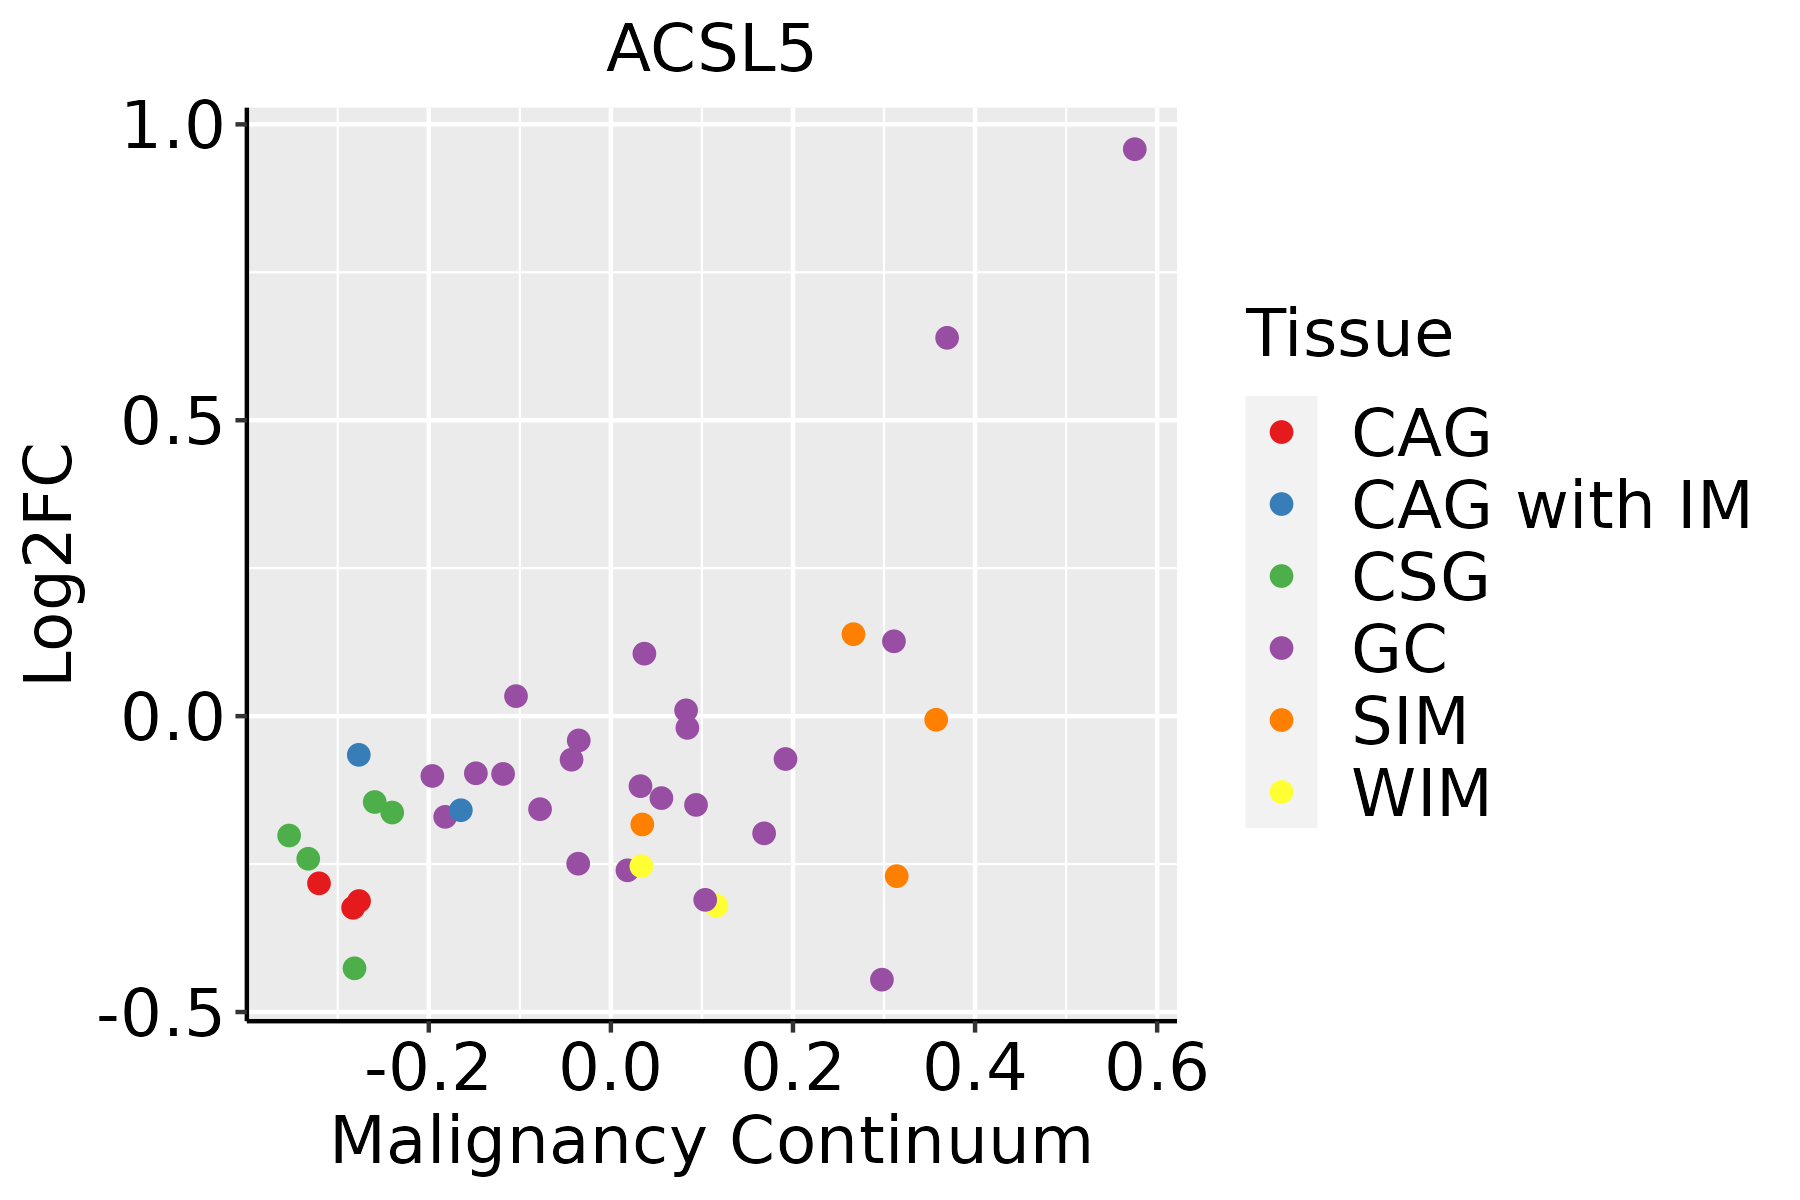 | CAG: Chronic atrophic gastritis |
| CAG with IM: Chronic atrophic gastritis with intestinal metaplasia | ||
| CSG: Chronic superficial gastritis | ||
| GC: Gastric cancer | ||
| SIM: Severe intestinal metaplasia | ||
| WIM: Wild intestinal metaplasia | ||
| Liver |  | HCC: Hepatocellular carcinoma |
| NAFLD: Non-alcoholic fatty liver disease |
| ∗log2FC in expression of this searched gene in stem-like cells from each diseased tissue sample relative to stem-like cells in normal samples in each tissue plotted against the malignancy continuum. Samples are colored based on if they are from different disease stage. |
Top |
Malignant transformation related pathway analysis |
| Find out the enriched GO biological processes and KEGG pathways involved in transition from healthy to precancer to cancer |
| Tissue | Disease Stage | Enriched GO biological Processes |
| Colorectum | AD |  |
| Colorectum | SER |  |
| Colorectum | MSS |  |
| Colorectum | MSI-H |  |
| Colorectum | FAP |  |
| ∗Top 15 enriched GO BP terms are showed in the bar plot of each disease state in each tissue. Each row represents a significant GO biological process which is colored according to the -log10(p.adjust). |
| Page: 1 2 3 4 5 6 7 8 9 |
| GO ID | Tissue | Disease Stage | Description | Gene Ratio | Bg Ratio | pvalue | p.adjust | Count |
| GO:0009150 | Colorectum | AD | purine ribonucleotide metabolic process | 142/3918 | 368/18723 | 4.29e-15 | 1.17e-12 | 142 |
| GO:0006163 | Colorectum | AD | purine nucleotide metabolic process | 149/3918 | 396/18723 | 1.08e-14 | 2.80e-12 | 149 |
| GO:0072521 | Colorectum | AD | purine-containing compound metabolic process | 153/3918 | 416/18723 | 4.34e-14 | 1.01e-11 | 153 |
| GO:0009259 | Colorectum | AD | ribonucleotide metabolic process | 144/3918 | 385/18723 | 5.25e-14 | 1.13e-11 | 144 |
| GO:0019693 | Colorectum | AD | ribose phosphate metabolic process | 145/3918 | 396/18723 | 3.01e-13 | 5.71e-11 | 145 |
| GO:0009117 | Colorectum | AD | nucleotide metabolic process | 168/3918 | 489/18723 | 2.20e-12 | 3.36e-10 | 168 |
| GO:0006753 | Colorectum | AD | nucleoside phosphate metabolic process | 169/3918 | 497/18723 | 4.99e-12 | 6.98e-10 | 169 |
| GO:0009152 | Colorectum | AD | purine ribonucleotide biosynthetic process | 64/3918 | 169/18723 | 3.09e-07 | 1.22e-05 | 64 |
| GO:0009260 | Colorectum | AD | ribonucleotide biosynthetic process | 66/3918 | 182/18723 | 1.25e-06 | 4.02e-05 | 66 |
| GO:0046390 | Colorectum | AD | ribose phosphate biosynthetic process | 67/3918 | 190/18723 | 3.21e-06 | 9.05e-05 | 67 |
| GO:0006164 | Colorectum | AD | purine nucleotide biosynthetic process | 66/3918 | 191/18723 | 8.22e-06 | 1.97e-04 | 66 |
| GO:0072522 | Colorectum | AD | purine-containing compound biosynthetic process | 68/3918 | 200/18723 | 1.12e-05 | 2.55e-04 | 68 |
| GO:0006631 | Colorectum | AD | fatty acid metabolic process | 114/3918 | 390/18723 | 5.58e-05 | 9.44e-04 | 114 |
| GO:1901293 | Colorectum | AD | nucleoside phosphate biosynthetic process | 80/3918 | 256/18723 | 6.31e-05 | 1.05e-03 | 80 |
| GO:0006790 | Colorectum | AD | sulfur compound metabolic process | 101/3918 | 339/18723 | 6.46e-05 | 1.07e-03 | 101 |
| GO:0009165 | Colorectum | AD | nucleotide biosynthetic process | 79/3918 | 254/18723 | 8.33e-05 | 1.30e-03 | 79 |
| GO:0033865 | Colorectum | AD | nucleoside bisphosphate metabolic process | 42/3918 | 128/18723 | 1.12e-03 | 1.02e-02 | 42 |
| GO:0033875 | Colorectum | AD | ribonucleoside bisphosphate metabolic process | 42/3918 | 128/18723 | 1.12e-03 | 1.02e-02 | 42 |
| GO:0034032 | Colorectum | AD | purine nucleoside bisphosphate metabolic process | 42/3918 | 128/18723 | 1.12e-03 | 1.02e-02 | 42 |
| GO:0010876 | Colorectum | AD | lipid localization | 120/3918 | 448/18723 | 1.59e-03 | 1.33e-02 | 120 |
| Page: 1 2 3 4 5 6 7 8 9 10 |
| Pathway ID | Tissue | Disease Stage | Description | Gene Ratio | Bg Ratio | pvalue | p.adjust | qvalue | Count |
| hsa04714 | Colorectum | AD | Thermogenesis | 120/2092 | 232/8465 | 2.76e-19 | 1.16e-17 | 7.37e-18 | 120 |
| hsa04216 | Colorectum | AD | Ferroptosis | 21/2092 | 41/8465 | 2.23e-04 | 1.78e-03 | 1.13e-03 | 21 |
| hsa00071 | Colorectum | AD | Fatty acid degradation | 20/2092 | 43/8465 | 1.50e-03 | 8.69e-03 | 5.54e-03 | 20 |
| hsa047141 | Colorectum | AD | Thermogenesis | 120/2092 | 232/8465 | 2.76e-19 | 1.16e-17 | 7.37e-18 | 120 |
| hsa042161 | Colorectum | AD | Ferroptosis | 21/2092 | 41/8465 | 2.23e-04 | 1.78e-03 | 1.13e-03 | 21 |
| hsa000711 | Colorectum | AD | Fatty acid degradation | 20/2092 | 43/8465 | 1.50e-03 | 8.69e-03 | 5.54e-03 | 20 |
| hsa047144 | Colorectum | MSS | Thermogenesis | 113/1875 | 232/8465 | 1.52e-19 | 4.62e-18 | 2.83e-18 | 113 |
| hsa042162 | Colorectum | MSS | Ferroptosis | 18/1875 | 41/8465 | 1.53e-03 | 8.53e-03 | 5.23e-03 | 18 |
| hsa000714 | Colorectum | MSS | Fatty acid degradation | 17/1875 | 43/8465 | 7.50e-03 | 2.86e-02 | 1.75e-02 | 17 |
| hsa047145 | Colorectum | MSS | Thermogenesis | 113/1875 | 232/8465 | 1.52e-19 | 4.62e-18 | 2.83e-18 | 113 |
| hsa042163 | Colorectum | MSS | Ferroptosis | 18/1875 | 41/8465 | 1.53e-03 | 8.53e-03 | 5.23e-03 | 18 |
| hsa000715 | Colorectum | MSS | Fatty acid degradation | 17/1875 | 43/8465 | 7.50e-03 | 2.86e-02 | 1.75e-02 | 17 |
| hsa047148 | Colorectum | FAP | Thermogenesis | 70/1404 | 232/8465 | 1.38e-07 | 3.08e-06 | 1.87e-06 | 70 |
| hsa042164 | Colorectum | FAP | Ferroptosis | 18/1404 | 41/8465 | 3.49e-05 | 3.65e-04 | 2.22e-04 | 18 |
| hsa000716 | Colorectum | FAP | Fatty acid degradation | 15/1404 | 43/8465 | 2.73e-03 | 1.23e-02 | 7.50e-03 | 15 |
| hsa047149 | Colorectum | FAP | Thermogenesis | 70/1404 | 232/8465 | 1.38e-07 | 3.08e-06 | 1.87e-06 | 70 |
| hsa042165 | Colorectum | FAP | Ferroptosis | 18/1404 | 41/8465 | 3.49e-05 | 3.65e-04 | 2.22e-04 | 18 |
| hsa000717 | Colorectum | FAP | Fatty acid degradation | 15/1404 | 43/8465 | 2.73e-03 | 1.23e-02 | 7.50e-03 | 15 |
| hsa042166 | Colorectum | CRC | Ferroptosis | 13/1091 | 41/8465 | 1.36e-03 | 1.08e-02 | 7.33e-03 | 13 |
| hsa01212 | Colorectum | CRC | Fatty acid metabolism | 14/1091 | 57/8465 | 1.17e-02 | 4.99e-02 | 3.38e-02 | 14 |
| Page: 1 2 3 |
Top |
Cell-cell communication analysis |
| Identification of potential cell-cell interactions between two cell types and their ligand-receptor pairs for different disease states |
| Ligand | Receptor | LRpair | Pathway | Tissue | Disease Stage |
| Page: 1 |
Top |
Single-cell gene regulatory network inference analysis |
| Find out the significant the regulons (TFs) and the target genes of each regulon across cell types for different disease states |
| TF | Cell Type | Tissue | Disease Stage | Target Gene | RSS | Regulon Activity |
| ∗The dot plots of a searched regulon are shown for all cell subpopulations in each disease state of each tissue based on the regulon specific score inferred using pySCENIC and by calculating the average expression. |
| Page: 1 |
Top |
Somatic mutation of malignant transformation related genes |
| Annotation of somatic variants for genes involved in malignant transformation |
| Hugo Symbol | Variant Class | Variant Classification | dbSNP RS | HGVSc | HGVSp | HGVSp Short | SWISSPROT | BIOTYPE | SIFT | PolyPhen | Tumor Sample Barcode | Tissue | Histology | Sex | Age | Stage | Therapy Types | Drugs | Outcome |
| ACSL5 | SNV | Missense_Mutation | c.595N>T | p.Pro199Ser | p.P199S | Q9ULC5 | protein_coding | deleterious(0) | probably_damaging(0.945) | TCGA-A8-A09Z-01 | Breast | breast invasive carcinoma | Female | >=65 | I/II | Unknown | Unknown | SD | |
| ACSL5 | SNV | Missense_Mutation | c.2086N>T | p.Ala696Ser | p.A696S | Q9ULC5 | protein_coding | tolerated(0.14) | benign(0.02) | TCGA-A8-A09Z-01 | Breast | breast invasive carcinoma | Female | >=65 | I/II | Unknown | Unknown | SD | |
| ACSL5 | SNV | Missense_Mutation | c.833G>C | p.Arg278Thr | p.R278T | Q9ULC5 | protein_coding | tolerated(0.05) | benign(0.056) | TCGA-AC-A23H-01 | Breast | breast invasive carcinoma | Female | >=65 | I/II | Unknown | Unknown | PD | |
| ACSL5 | SNV | Missense_Mutation | rs144236262 | c.1841T>C | p.Ile614Thr | p.I614T | Q9ULC5 | protein_coding | deleterious(0) | probably_damaging(0.944) | TCGA-D8-A1XU-01 | Breast | breast invasive carcinoma | Female | <65 | I/II | Unknown | Unknown | SD |
| ACSL5 | SNV | Missense_Mutation | novel | c.4N>T | p.Asp2Tyr | p.D2Y | Q9ULC5 | protein_coding | deleterious_low_confidence(0) | possibly_damaging(0.66) | TCGA-UL-AAZ6-01 | Breast | breast invasive carcinoma | Female | >=65 | I/II | Chemotherapy | herceptin | SD |
| ACSL5 | insertion | Frame_Shift_Ins | novel | c.73_74insCGGCCCTTAGG | p.Arg25ThrfsTer16 | p.R25Tfs*16 | Q9ULC5 | protein_coding | TCGA-AN-A0FK-01 | Breast | breast invasive carcinoma | Female | >=65 | III/IV | Unknown | Unknown | SD | ||
| ACSL5 | SNV | Missense_Mutation | rs767611100 | c.977N>A | p.Gly326Glu | p.G326E | Q9ULC5 | protein_coding | deleterious(0) | probably_damaging(0.995) | TCGA-EA-A3HR-01 | Cervix | cervical & endocervical cancer | Female | <65 | I/II | Unknown | Unknown | SD |
| ACSL5 | SNV | Missense_Mutation | c.2047G>A | p.Gly683Arg | p.G683R | Q9ULC5 | protein_coding | deleterious(0) | probably_damaging(0.995) | TCGA-A6-2684-01 | Colorectum | colon adenocarcinoma | Female | >=65 | I/II | Unknown | Unknown | PD | |
| ACSL5 | SNV | Missense_Mutation | c.107T>C | p.Leu36Pro | p.L36P | Q9ULC5 | protein_coding | tolerated_low_confidence(0.08) | benign(0.003) | TCGA-A6-6781-01 | Colorectum | colon adenocarcinoma | Male | <65 | III/IV | Chemotherapy | oxaliplatin | SD | |
| ACSL5 | SNV | Missense_Mutation | c.494A>G | p.Lys165Arg | p.K165R | Q9ULC5 | protein_coding | tolerated(0.16) | benign(0.011) | TCGA-AA-3939-01 | Colorectum | colon adenocarcinoma | Male | >=65 | I/II | Unknown | Unknown | SD |
| Page: 1 2 3 4 5 6 7 |
Top |
Related drugs of malignant transformation related genes |
| Identification of chemicals and drugs interact with genes involved in malignant transfromation |
| (DGIdb 4.0) |
| Entrez ID | Symbol | Category | Interaction Types | Drug Claim Name | Drug Name | PMIDs |
| Page: 1 |

Copyright 2023-Present -The University of Texas Health Science Center at Houston |