
|
|||||
|
 | |
| |
| |
| |
| |
| |
|
Gene: ACSL1 |
Gene summary for ACSL1 |
| Gene information | Species | Human | Gene symbol | ACSL1 | Gene ID | 2180 |
| Gene name | acyl-CoA synthetase long chain family member 1 | |
| Gene Alias | ACS1 | |
| Cytomap | 4q35.1 | |
| Gene Type | protein-coding | GO ID | GO:0000038 | UniProtAcc | A8K9T3 |
Top |
Malignant transformation analysis |
| Identification of the aberrant gene expression in precancerous and cancerous lesions by comparing the gene expression of stem-like cells in diseased tissues with normal stem cells |
| Entrez ID | Symbol | Replicates | Species | Organ | Tissue | Adj P-value | Log2FC | Malignancy |
| 2180 | ACSL1 | LZE4T | Human | Esophagus | ESCC | 8.45e-11 | 1.47e-01 | 0.0811 |
| 2180 | ACSL1 | LZE5T | Human | Esophagus | ESCC | 5.39e-04 | 6.18e-01 | 0.0514 |
| 2180 | ACSL1 | LZE24T | Human | Esophagus | ESCC | 4.61e-03 | 2.23e-01 | 0.0596 |
| 2180 | ACSL1 | P1T-E | Human | Esophagus | ESCC | 8.23e-08 | 1.16e-01 | 0.0875 |
| 2180 | ACSL1 | P2T-E | Human | Esophagus | ESCC | 6.54e-16 | 1.58e-01 | 0.1177 |
| 2180 | ACSL1 | P4T-E | Human | Esophagus | ESCC | 9.72e-12 | 1.72e-01 | 0.1323 |
| 2180 | ACSL1 | P5T-E | Human | Esophagus | ESCC | 1.64e-07 | 6.64e-02 | 0.1327 |
| 2180 | ACSL1 | P8T-E | Human | Esophagus | ESCC | 2.40e-09 | 3.35e-02 | 0.0889 |
| 2180 | ACSL1 | P9T-E | Human | Esophagus | ESCC | 6.07e-07 | 9.11e-03 | 0.1131 |
| 2180 | ACSL1 | P10T-E | Human | Esophagus | ESCC | 2.60e-23 | 3.44e-01 | 0.116 |
| 2180 | ACSL1 | P11T-E | Human | Esophagus | ESCC | 6.05e-07 | 5.73e-02 | 0.1426 |
| 2180 | ACSL1 | P12T-E | Human | Esophagus | ESCC | 5.95e-32 | 6.47e-01 | 0.1122 |
| 2180 | ACSL1 | P15T-E | Human | Esophagus | ESCC | 5.05e-19 | 1.76e-01 | 0.1149 |
| 2180 | ACSL1 | P16T-E | Human | Esophagus | ESCC | 2.65e-06 | 2.56e-02 | 0.1153 |
| 2180 | ACSL1 | P21T-E | Human | Esophagus | ESCC | 1.19e-07 | 3.91e-02 | 0.1617 |
| 2180 | ACSL1 | P22T-E | Human | Esophagus | ESCC | 4.62e-07 | 1.78e-01 | 0.1236 |
| 2180 | ACSL1 | P23T-E | Human | Esophagus | ESCC | 1.55e-35 | 1.07e+00 | 0.108 |
| 2180 | ACSL1 | P24T-E | Human | Esophagus | ESCC | 1.66e-04 | -1.39e-02 | 0.1287 |
| 2180 | ACSL1 | P26T-E | Human | Esophagus | ESCC | 1.57e-26 | 5.20e-01 | 0.1276 |
| 2180 | ACSL1 | P27T-E | Human | Esophagus | ESCC | 2.72e-09 | 1.96e-01 | 0.1055 |
| Page: 1 2 3 4 |
| Tissue | Expression Dynamics | Abbreviation |
| Esophagus |  | ESCC: Esophageal squamous cell carcinoma |
| HGIN: High-grade intraepithelial neoplasias | ||
| LGIN: Low-grade intraepithelial neoplasias | ||
| Liver | 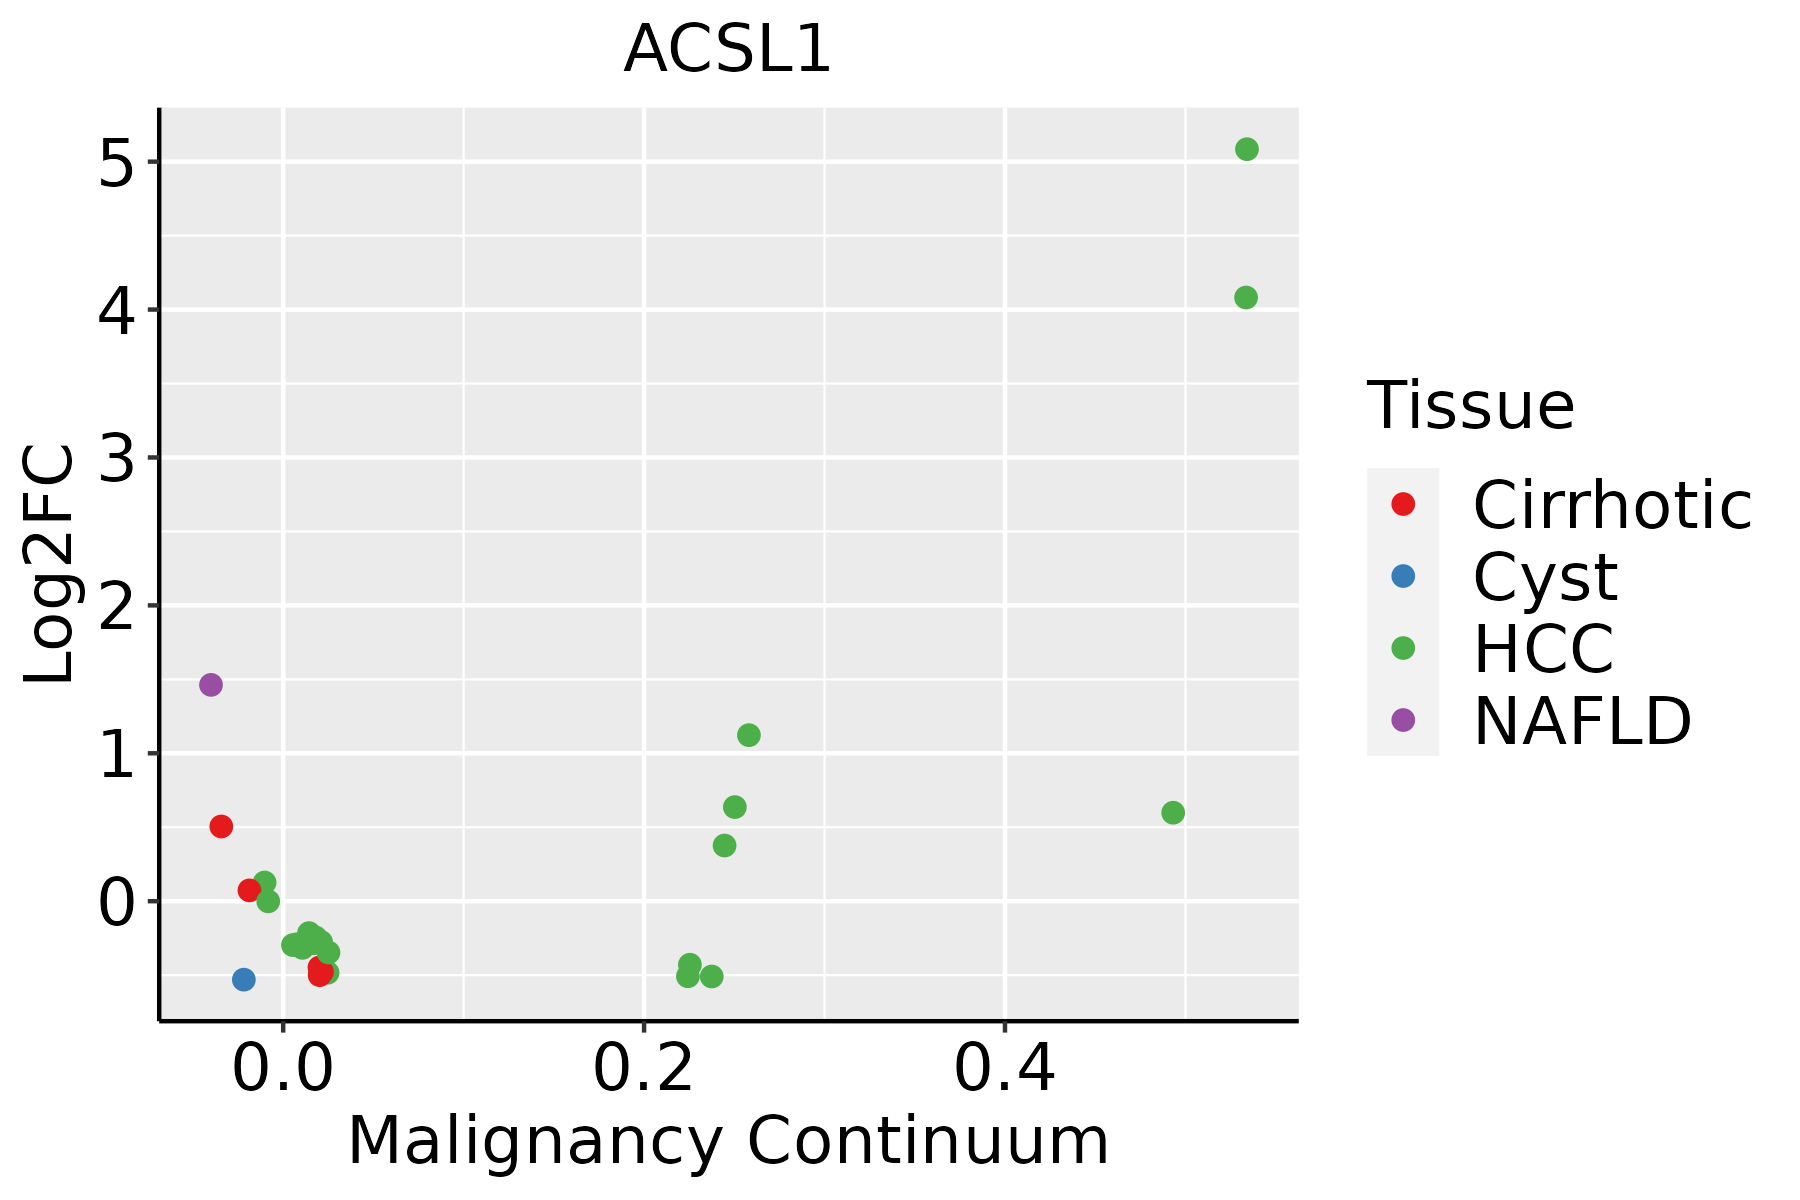 | HCC: Hepatocellular carcinoma |
| NAFLD: Non-alcoholic fatty liver disease | ||
| Prostate | 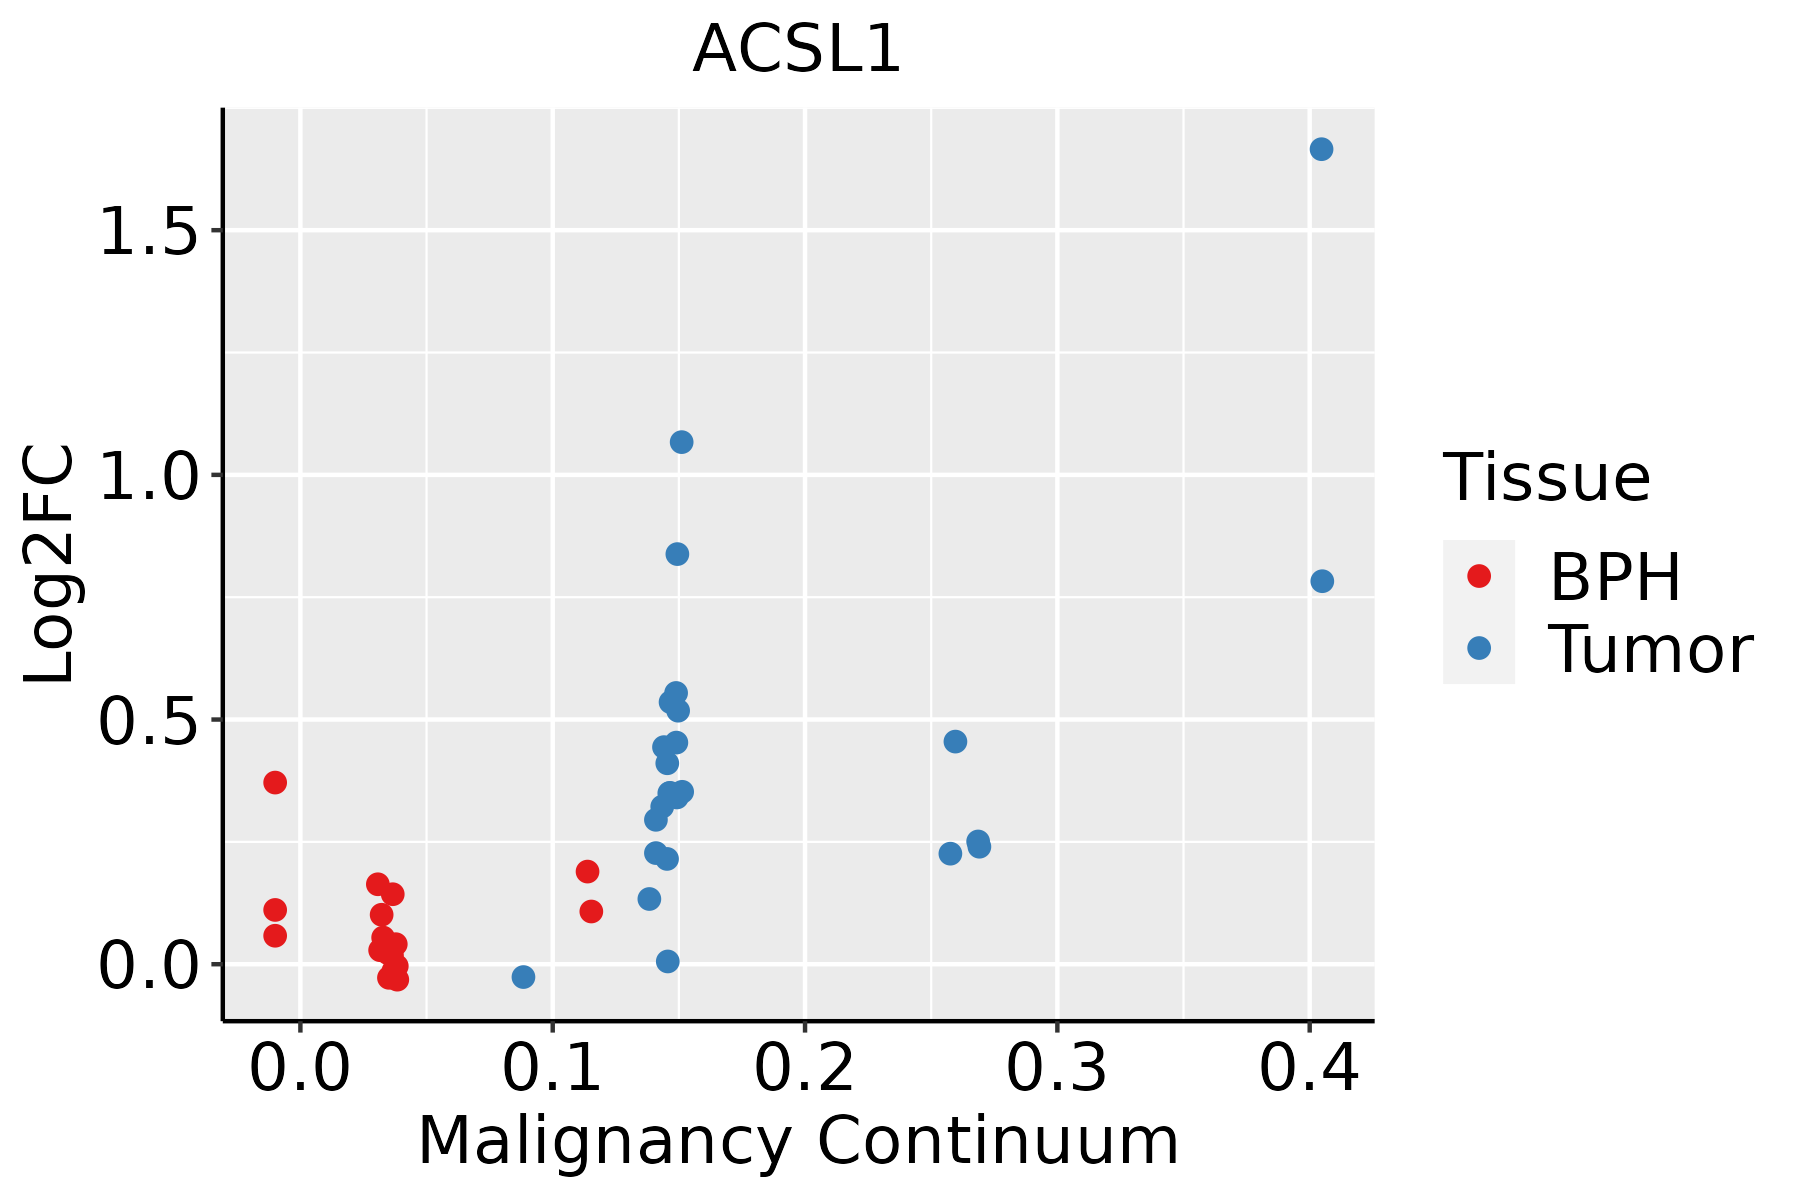 | BPH: Benign Prostatic Hyperplasia |
| Skin | 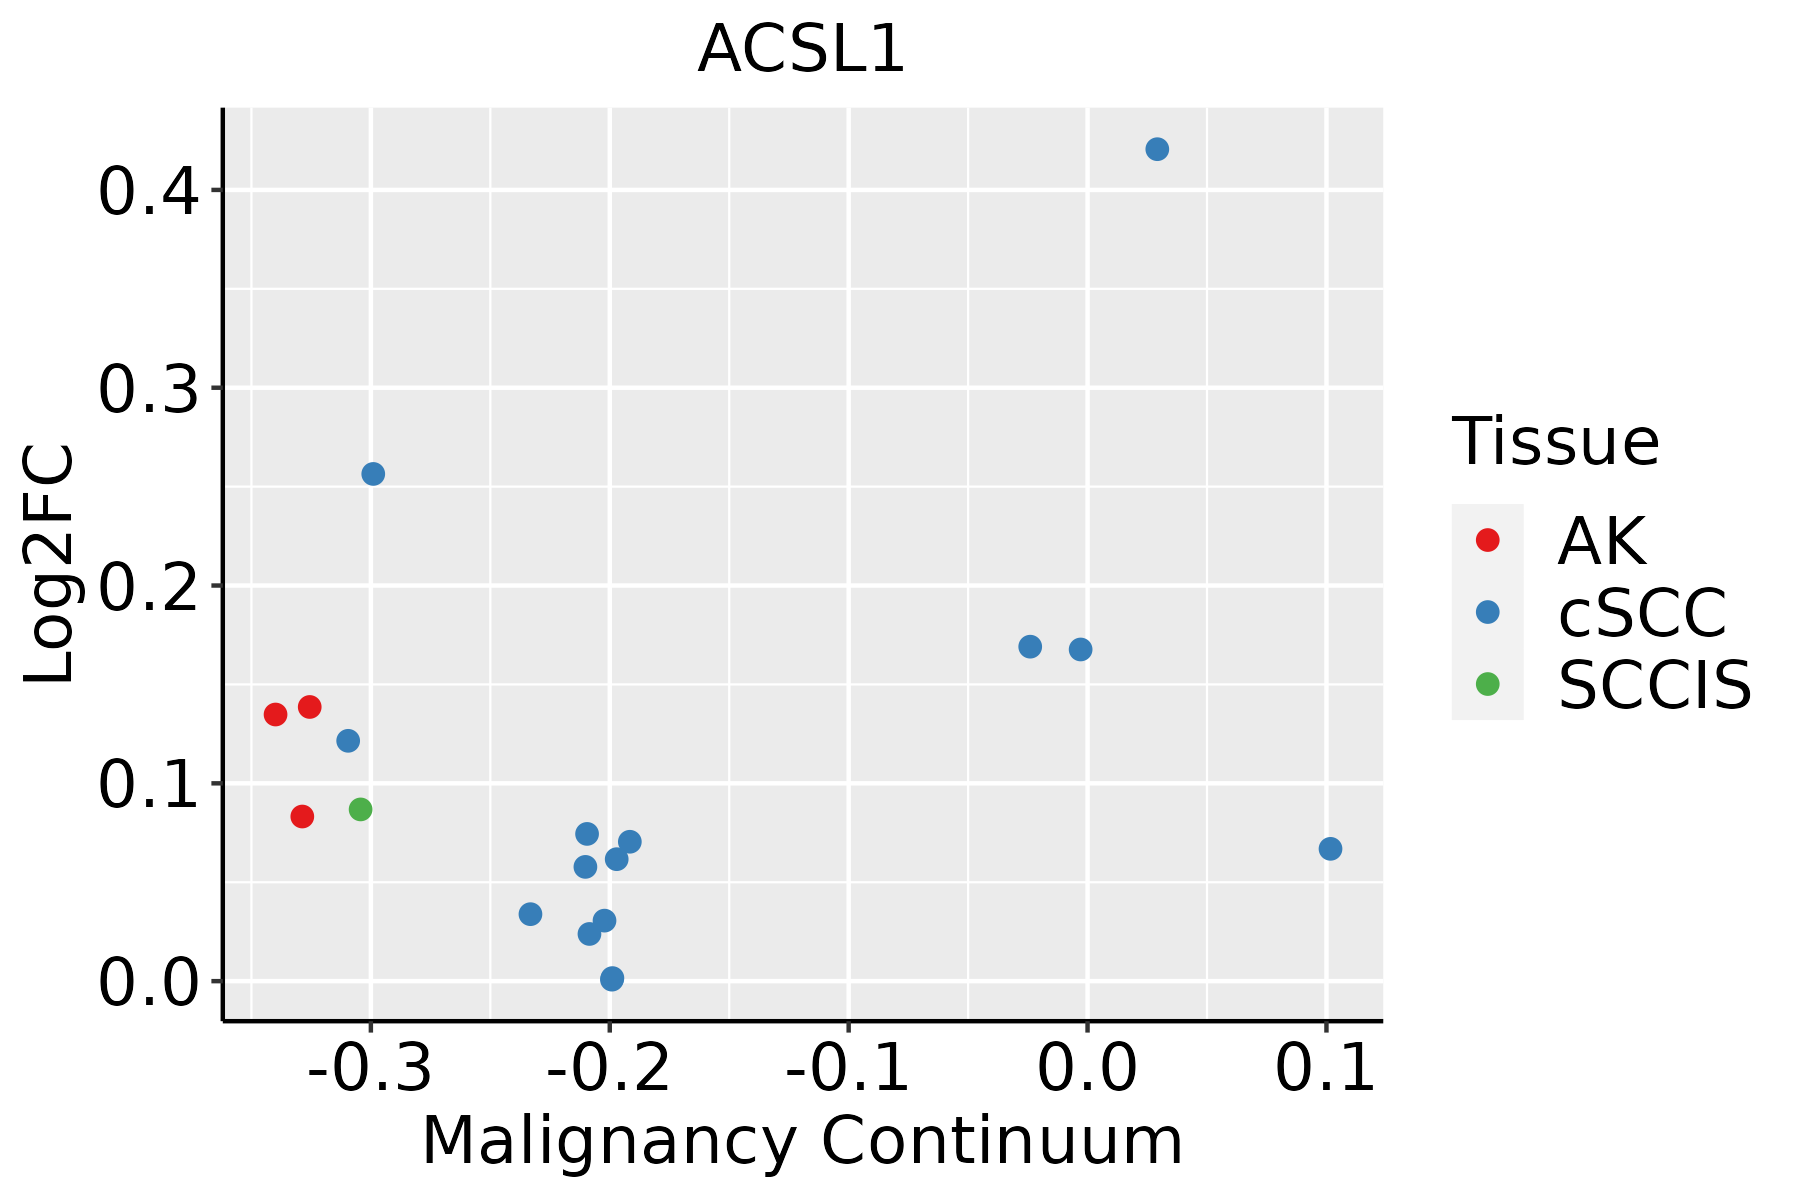 | AK: Actinic keratosis |
| cSCC: Cutaneous squamous cell carcinoma | ||
| SCCIS:squamous cell carcinoma in situ |
| ∗log2FC in expression of this searched gene in stem-like cells from each diseased tissue sample relative to stem-like cells in normal samples in each tissue plotted against the malignancy continuum. Samples are colored based on if they are from different disease stage. |
Top |
Malignant transformation related pathway analysis |
| Find out the enriched GO biological processes and KEGG pathways involved in transition from healthy to precancer to cancer |
| Tissue | Disease Stage | Enriched GO biological Processes |
| Colorectum | AD |  |
| Colorectum | SER |  |
| Colorectum | MSS |  |
| Colorectum | MSI-H |  |
| Colorectum | FAP |  |
| ∗Top 15 enriched GO BP terms are showed in the bar plot of each disease state in each tissue. Each row represents a significant GO biological process which is colored according to the -log10(p.adjust). |
| Page: 1 2 3 4 5 6 7 8 9 |
| GO ID | Tissue | Disease Stage | Description | Gene Ratio | Bg Ratio | pvalue | p.adjust | Count |
| GO:0031667111 | Esophagus | ESCC | response to nutrient levels | 289/8552 | 474/18723 | 9.25e-12 | 3.47e-10 | 289 |
| GO:007190016 | Esophagus | ESCC | regulation of protein serine/threonine kinase activity | 227/8552 | 359/18723 | 1.12e-11 | 4.10e-10 | 227 |
| GO:0006753110 | Esophagus | ESCC | nucleoside phosphate metabolic process | 288/8552 | 497/18723 | 1.80e-08 | 3.50e-07 | 288 |
| GO:0019693111 | Esophagus | ESCC | ribose phosphate metabolic process | 234/8552 | 396/18723 | 4.24e-08 | 7.76e-07 | 234 |
| GO:0009117111 | Esophagus | ESCC | nucleotide metabolic process | 282/8552 | 489/18723 | 4.70e-08 | 8.50e-07 | 282 |
| GO:000758410 | Esophagus | ESCC | response to nutrient | 114/8552 | 174/18723 | 9.43e-08 | 1.56e-06 | 114 |
| GO:00067906 | Esophagus | ESCC | sulfur compound metabolic process | 201/8552 | 339/18723 | 2.64e-07 | 3.94e-06 | 201 |
| GO:0009259111 | Esophagus | ESCC | ribonucleotide metabolic process | 224/8552 | 385/18723 | 4.41e-07 | 6.00e-06 | 224 |
| GO:00450175 | Esophagus | ESCC | glycerolipid biosynthetic process | 154/8552 | 252/18723 | 5.20e-07 | 6.96e-06 | 154 |
| GO:0072521111 | Esophagus | ESCC | purine-containing compound metabolic process | 238/8552 | 416/18723 | 1.20e-06 | 1.49e-05 | 238 |
| GO:0009150111 | Esophagus | ESCC | purine ribonucleotide metabolic process | 213/8552 | 368/18723 | 1.40e-06 | 1.69e-05 | 213 |
| GO:0046390110 | Esophagus | ESCC | ribose phosphate biosynthetic process | 119/8552 | 190/18723 | 1.73e-06 | 2.06e-05 | 119 |
| GO:00442725 | Esophagus | ESCC | sulfur compound biosynthetic process | 96/8552 | 148/18723 | 1.86e-06 | 2.16e-05 | 96 |
| GO:00719029 | Esophagus | ESCC | positive regulation of protein serine/threonine kinase activity | 124/8552 | 200/18723 | 2.27e-06 | 2.61e-05 | 124 |
| GO:0006163111 | Esophagus | ESCC | purine nucleotide metabolic process | 226/8552 | 396/18723 | 2.81e-06 | 3.21e-05 | 226 |
| GO:004586018 | Esophagus | ESCC | positive regulation of protein kinase activity | 219/8552 | 386/18723 | 6.91e-06 | 6.97e-05 | 219 |
| GO:003367420 | Esophagus | ESCC | positive regulation of kinase activity | 260/8552 | 467/18723 | 7.26e-06 | 7.22e-05 | 260 |
| GO:000916516 | Esophagus | ESCC | nucleotide biosynthetic process | 150/8552 | 254/18723 | 1.12e-05 | 1.06e-04 | 150 |
| GO:0009260110 | Esophagus | ESCC | ribonucleotide biosynthetic process | 112/8552 | 182/18723 | 1.12e-05 | 1.06e-04 | 112 |
| GO:190129316 | Esophagus | ESCC | nucleoside phosphate biosynthetic process | 151/8552 | 256/18723 | 1.15e-05 | 1.08e-04 | 151 |
| Page: 1 2 3 4 5 6 7 8 9 10 11 12 13 14 |
| Pathway ID | Tissue | Disease Stage | Description | Gene Ratio | Bg Ratio | pvalue | p.adjust | qvalue | Count |
| hsa04714211 | Esophagus | ESCC | Thermogenesis | 163/4205 | 232/8465 | 9.22e-11 | 1.14e-09 | 5.86e-10 | 163 |
| hsa0421629 | Esophagus | ESCC | Ferroptosis | 33/4205 | 41/8465 | 4.58e-05 | 1.99e-04 | 1.02e-04 | 33 |
| hsa012129 | Esophagus | ESCC | Fatty acid metabolism | 41/4205 | 57/8465 | 5.13e-04 | 1.75e-03 | 8.98e-04 | 41 |
| hsa041467 | Esophagus | ESCC | Peroxisome | 55/4205 | 82/8465 | 1.04e-03 | 3.27e-03 | 1.68e-03 | 55 |
| hsa04714310 | Esophagus | ESCC | Thermogenesis | 163/4205 | 232/8465 | 9.22e-11 | 1.14e-09 | 5.86e-10 | 163 |
| hsa0421638 | Esophagus | ESCC | Ferroptosis | 33/4205 | 41/8465 | 4.58e-05 | 1.99e-04 | 1.02e-04 | 33 |
| hsa0121214 | Esophagus | ESCC | Fatty acid metabolism | 41/4205 | 57/8465 | 5.13e-04 | 1.75e-03 | 8.98e-04 | 41 |
| hsa0414612 | Esophagus | ESCC | Peroxisome | 55/4205 | 82/8465 | 1.04e-03 | 3.27e-03 | 1.68e-03 | 55 |
| hsa033206 | Liver | NAFLD | PPAR signaling pathway | 25/1043 | 75/8465 | 1.61e-06 | 6.62e-05 | 5.33e-05 | 25 |
| hsa012126 | Liver | NAFLD | Fatty acid metabolism | 17/1043 | 57/8465 | 3.43e-04 | 5.93e-03 | 4.78e-03 | 17 |
| hsa000718 | Liver | NAFLD | Fatty acid degradation | 13/1043 | 43/8465 | 1.46e-03 | 1.71e-02 | 1.38e-02 | 13 |
| hsa04146 | Liver | NAFLD | Peroxisome | 19/1043 | 82/8465 | 4.37e-03 | 4.10e-02 | 3.30e-02 | 19 |
| hsa0332011 | Liver | NAFLD | PPAR signaling pathway | 25/1043 | 75/8465 | 1.61e-06 | 6.62e-05 | 5.33e-05 | 25 |
| hsa0121211 | Liver | NAFLD | Fatty acid metabolism | 17/1043 | 57/8465 | 3.43e-04 | 5.93e-03 | 4.78e-03 | 17 |
| hsa0007111 | Liver | NAFLD | Fatty acid degradation | 13/1043 | 43/8465 | 1.46e-03 | 1.71e-02 | 1.38e-02 | 13 |
| hsa041461 | Liver | NAFLD | Peroxisome | 19/1043 | 82/8465 | 4.37e-03 | 4.10e-02 | 3.30e-02 | 19 |
| hsa0471422 | Liver | HCC | Thermogenesis | 170/4020 | 232/8465 | 5.36e-16 | 2.25e-14 | 1.25e-14 | 170 |
| hsa012124 | Liver | HCC | Fatty acid metabolism | 45/4020 | 57/8465 | 1.05e-06 | 1.10e-05 | 6.09e-06 | 45 |
| hsa0421641 | Liver | HCC | Ferroptosis | 33/4020 | 41/8465 | 1.42e-05 | 9.88e-05 | 5.50e-05 | 33 |
| hsa041464 | Liver | HCC | Peroxisome | 58/4020 | 82/8465 | 1.57e-05 | 1.05e-04 | 5.85e-05 | 58 |
| Page: 1 2 3 |
Top |
Cell-cell communication analysis |
| Identification of potential cell-cell interactions between two cell types and their ligand-receptor pairs for different disease states |
| Ligand | Receptor | LRpair | Pathway | Tissue | Disease Stage |
| Page: 1 |
Top |
Single-cell gene regulatory network inference analysis |
| Find out the significant the regulons (TFs) and the target genes of each regulon across cell types for different disease states |
| TF | Cell Type | Tissue | Disease Stage | Target Gene | RSS | Regulon Activity |
| ∗The dot plots of a searched regulon are shown for all cell subpopulations in each disease state of each tissue based on the regulon specific score inferred using pySCENIC and by calculating the average expression. |
| Page: 1 |
Top |
Somatic mutation of malignant transformation related genes |
| Annotation of somatic variants for genes involved in malignant transformation |
| Hugo Symbol | Variant Class | Variant Classification | dbSNP RS | HGVSc | HGVSp | HGVSp Short | SWISSPROT | BIOTYPE | SIFT | PolyPhen | Tumor Sample Barcode | Tissue | Histology | Sex | Age | Stage | Therapy Types | Drugs | Outcome |
| ACSL1 | SNV | Missense_Mutation | novel | c.1906G>A | p.Glu636Lys | p.E636K | P33121 | protein_coding | tolerated(0.1) | benign(0.042) | TCGA-AN-A046-01 | Breast | breast invasive carcinoma | Female | >=65 | I/II | Unknown | Unknown | SD |
| ACSL1 | SNV | Missense_Mutation | rs202112997 | c.1736G>A | p.Arg579Gln | p.R579Q | P33121 | protein_coding | tolerated(0.07) | benign(0.382) | TCGA-AN-A046-01 | Breast | breast invasive carcinoma | Female | >=65 | I/II | Unknown | Unknown | SD |
| ACSL1 | insertion | In_Frame_Ins | novel | c.1002_1003insAACACG | p.Met334_Leu335insAsnThr | p.M334_L335insNT | P33121 | protein_coding | TCGA-AN-A0FX-01 | Breast | breast invasive carcinoma | Female | <65 | I/II | Unknown | Unknown | SD | ||
| ACSL1 | insertion | Frame_Shift_Ins | novel | c.1000_1001insGGATTATAAGAGAAAATGCA | p.Met334ArgfsTer44 | p.M334Rfs*44 | P33121 | protein_coding | TCGA-AN-A0FX-01 | Breast | breast invasive carcinoma | Female | <65 | I/II | Unknown | Unknown | SD | ||
| ACSL1 | deletion | Frame_Shift_Del | novel | c.428delN | p.Lys143ArgfsTer19 | p.K143Rfs*19 | P33121 | protein_coding | TCGA-D8-A27V-01 | Breast | breast invasive carcinoma | Female | <65 | I/II | Hormone Therapy | tamoxiphen | SD | ||
| ACSL1 | SNV | Missense_Mutation | rs761614480 | c.1067N>G | p.Lys356Arg | p.K356R | P33121 | protein_coding | tolerated(0.06) | benign(0.248) | TCGA-C5-A3HE-01 | Cervix | cervical & endocervical cancer | Female | <65 | I/II | Unknown | Unknown | PD |
| ACSL1 | SNV | Missense_Mutation | novel | c.1625N>A | p.Gly542Glu | p.G542E | P33121 | protein_coding | deleterious(0) | probably_damaging(0.999) | TCGA-VS-A94Z-01 | Cervix | cervical & endocervical cancer | Female | <65 | I/II | Chemotherapy | cisplatin | CR |
| ACSL1 | SNV | Missense_Mutation | novel | c.1082N>G | p.Thr361Ser | p.T361S | P33121 | protein_coding | deleterious(0.01) | probably_damaging(0.985) | TCGA-VS-A94Z-01 | Cervix | cervical & endocervical cancer | Female | <65 | I/II | Chemotherapy | cisplatin | CR |
| ACSL1 | SNV | Missense_Mutation | novel | c.1672N>T | p.His558Tyr | p.H558Y | P33121 | protein_coding | deleterious(0) | possibly_damaging(0.832) | TCGA-AA-3949-01 | Colorectum | colon adenocarcinoma | Female | >=65 | III/IV | Unknown | Unknown | SD |
| ACSL1 | SNV | Missense_Mutation | c.1835N>T | p.Ala612Val | p.A612V | P33121 | protein_coding | deleterious(0.04) | benign(0.178) | TCGA-AA-A00N-01 | Colorectum | colon adenocarcinoma | Male | >=65 | I/II | Unknown | Unknown | PD |
| Page: 1 2 3 4 5 6 7 8 |
Top |
Related drugs of malignant transformation related genes |
| Identification of chemicals and drugs interact with genes involved in malignant transfromation |
| (DGIdb 4.0) |
| Entrez ID | Symbol | Category | Interaction Types | Drug Claim Name | Drug Name | PMIDs |
| Page: 1 |

Copyright 2023-Present -The University of Texas Health Science Center at Houston |