
|
|||||
|
 | |
| |
| |
| |
| |
| |
|
Gene: ACSF3 |
Gene summary for ACSF3 |
| Gene information | Species | Human | Gene symbol | ACSF3 | Gene ID | 197322 |
| Gene name | acyl-CoA synthetase family member 3 | |
| Gene Alias | ACSF3 | |
| Cytomap | 16q24.3 | |
| Gene Type | protein-coding | GO ID | GO:0006082 | UniProtAcc | Q4G176 |
Top |
Malignant transformation analysis |
| Identification of the aberrant gene expression in precancerous and cancerous lesions by comparing the gene expression of stem-like cells in diseased tissues with normal stem cells |
| Entrez ID | Symbol | Replicates | Species | Organ | Tissue | Adj P-value | Log2FC | Malignancy |
| 197322 | ACSF3 | LZE4T | Human | Esophagus | ESCC | 9.05e-03 | 1.59e-01 | 0.0811 |
| 197322 | ACSF3 | LZE7T | Human | Esophagus | ESCC | 2.70e-04 | 2.35e-01 | 0.0667 |
| 197322 | ACSF3 | LZE20T | Human | Esophagus | ESCC | 4.26e-02 | 1.39e-01 | 0.0662 |
| 197322 | ACSF3 | LZE22T | Human | Esophagus | ESCC | 8.91e-03 | 2.66e-01 | 0.068 |
| 197322 | ACSF3 | LZE24T | Human | Esophagus | ESCC | 2.42e-11 | 3.10e-01 | 0.0596 |
| 197322 | ACSF3 | P1T-E | Human | Esophagus | ESCC | 6.14e-06 | 3.17e-01 | 0.0875 |
| 197322 | ACSF3 | P2T-E | Human | Esophagus | ESCC | 4.45e-10 | 2.00e-01 | 0.1177 |
| 197322 | ACSF3 | P4T-E | Human | Esophagus | ESCC | 5.10e-06 | 1.96e-01 | 0.1323 |
| 197322 | ACSF3 | P5T-E | Human | Esophagus | ESCC | 5.33e-05 | 1.71e-01 | 0.1327 |
| 197322 | ACSF3 | P8T-E | Human | Esophagus | ESCC | 1.34e-16 | 3.25e-01 | 0.0889 |
| 197322 | ACSF3 | P9T-E | Human | Esophagus | ESCC | 1.25e-06 | 1.95e-01 | 0.1131 |
| 197322 | ACSF3 | P10T-E | Human | Esophagus | ESCC | 3.95e-07 | 1.45e-01 | 0.116 |
| 197322 | ACSF3 | P11T-E | Human | Esophagus | ESCC | 2.31e-06 | 2.52e-01 | 0.1426 |
| 197322 | ACSF3 | P12T-E | Human | Esophagus | ESCC | 1.54e-05 | 1.10e-01 | 0.1122 |
| 197322 | ACSF3 | P15T-E | Human | Esophagus | ESCC | 2.58e-16 | 3.47e-01 | 0.1149 |
| 197322 | ACSF3 | P16T-E | Human | Esophagus | ESCC | 1.21e-07 | 2.04e-01 | 0.1153 |
| 197322 | ACSF3 | P19T-E | Human | Esophagus | ESCC | 1.64e-04 | 3.00e-01 | 0.1662 |
| 197322 | ACSF3 | P20T-E | Human | Esophagus | ESCC | 4.40e-15 | 3.22e-01 | 0.1124 |
| 197322 | ACSF3 | P21T-E | Human | Esophagus | ESCC | 2.46e-17 | 3.53e-01 | 0.1617 |
| 197322 | ACSF3 | P22T-E | Human | Esophagus | ESCC | 1.57e-03 | 1.18e-01 | 0.1236 |
| Page: 1 2 3 4 5 |
| Tissue | Expression Dynamics | Abbreviation |
| Esophagus | 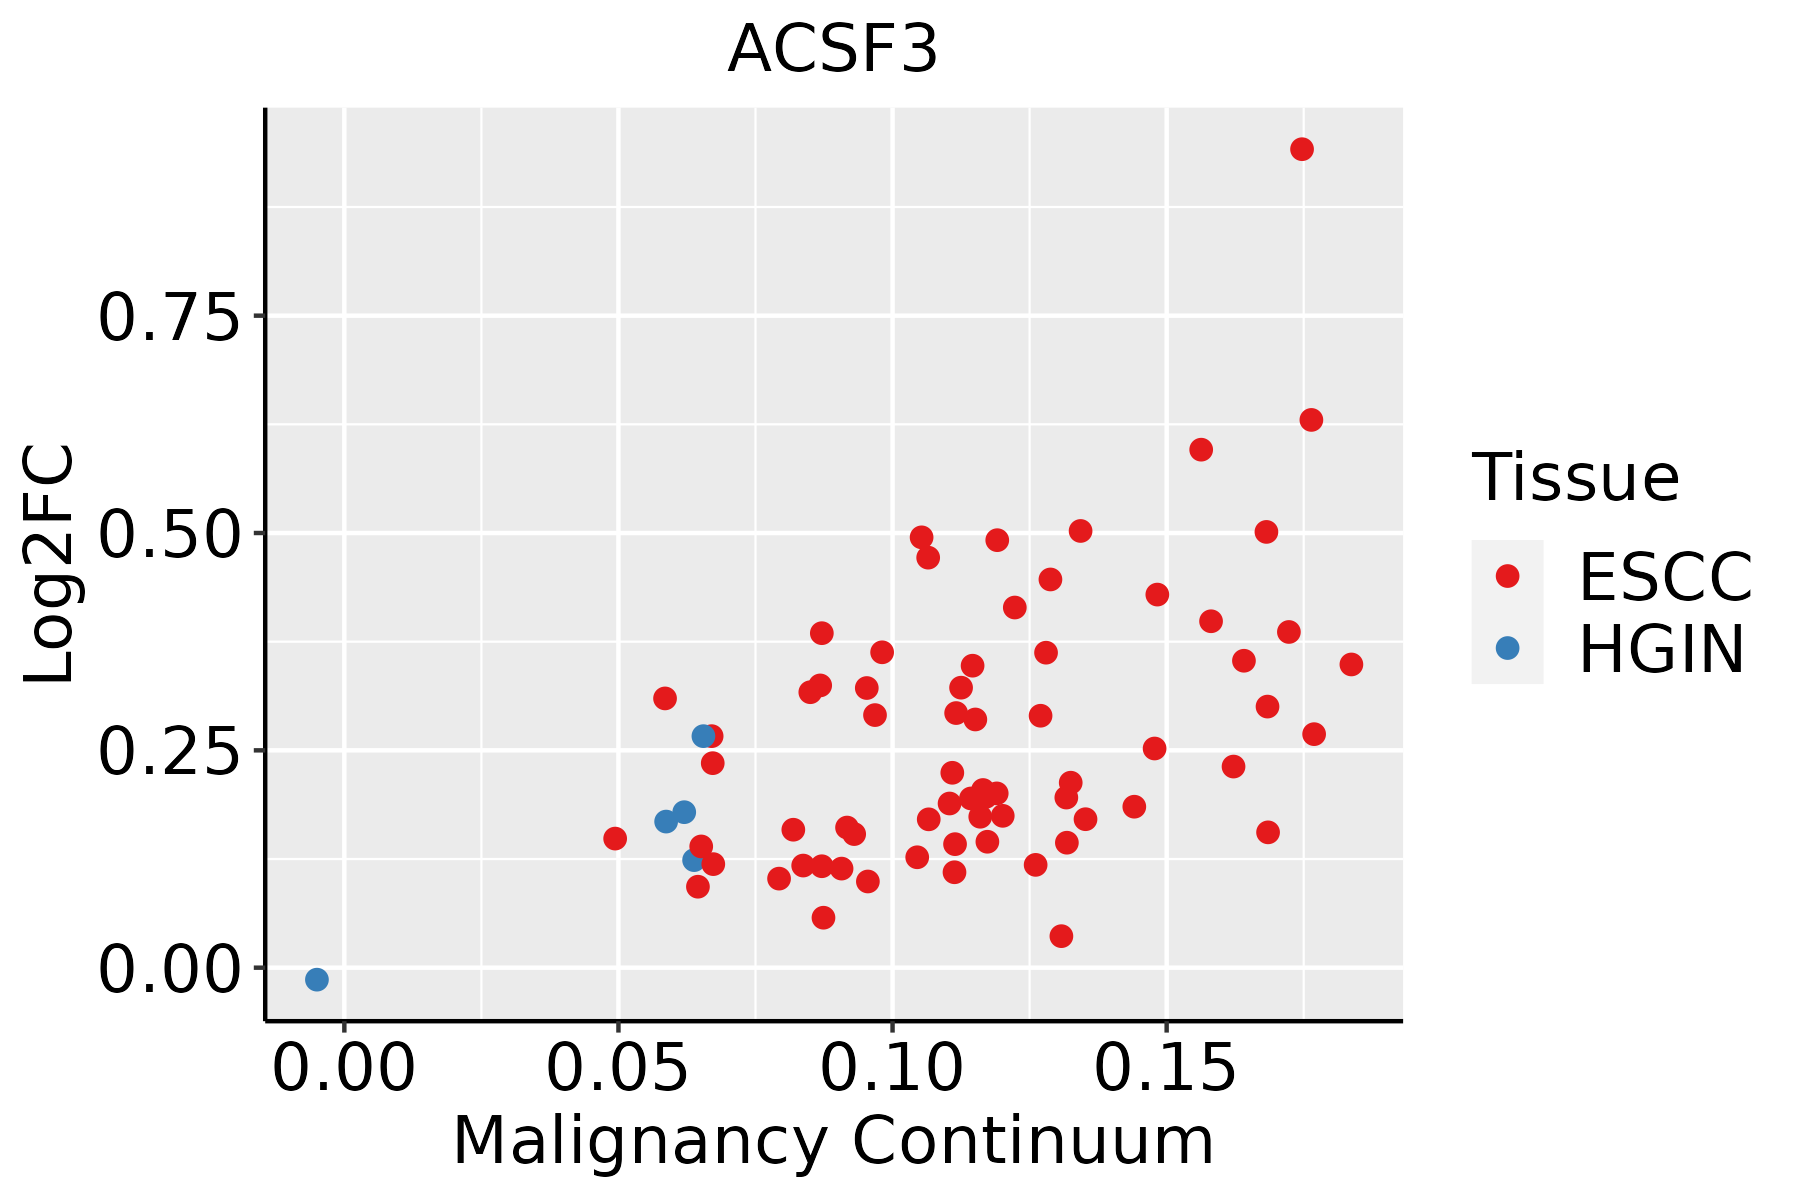 | ESCC: Esophageal squamous cell carcinoma |
| HGIN: High-grade intraepithelial neoplasias | ||
| LGIN: Low-grade intraepithelial neoplasias | ||
| Liver | 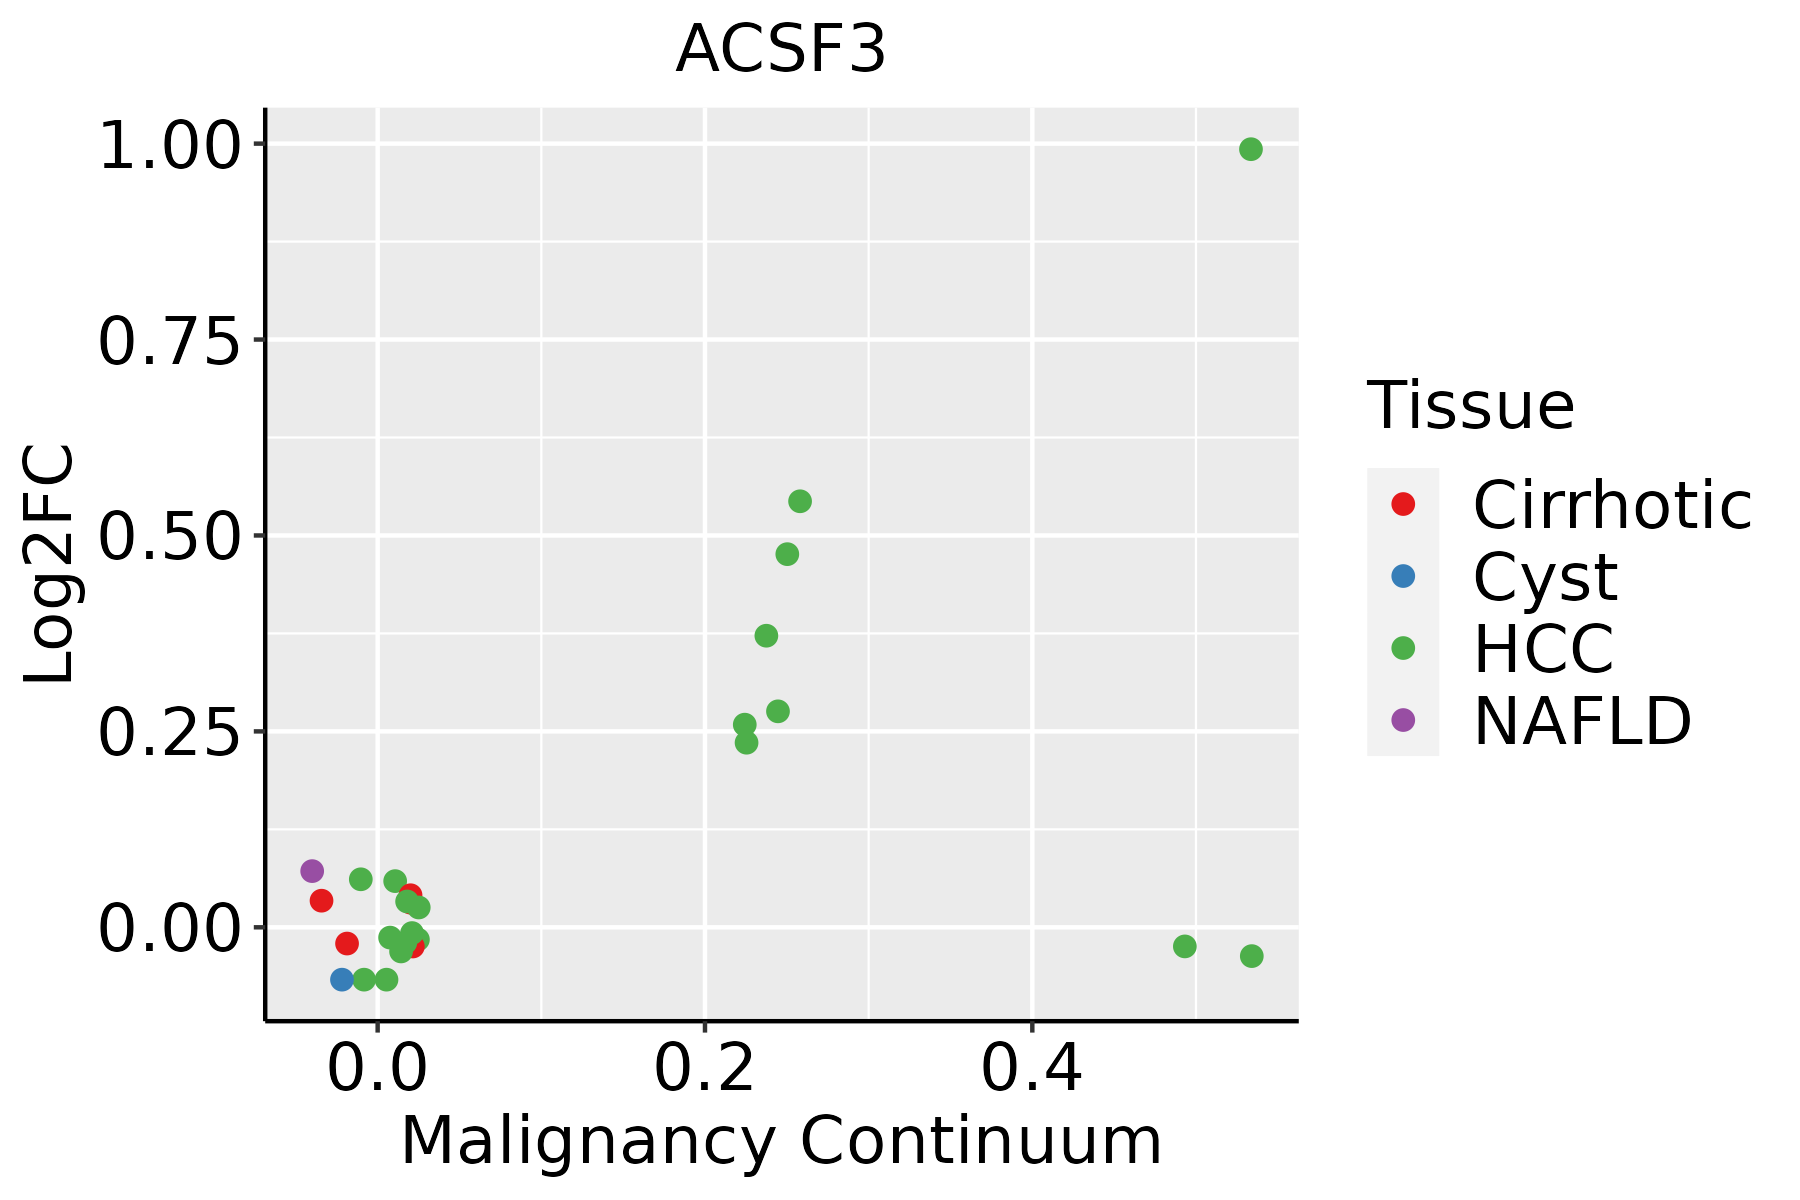 | HCC: Hepatocellular carcinoma |
| NAFLD: Non-alcoholic fatty liver disease | ||
| Oral Cavity |  | EOLP: Erosive Oral lichen planus |
| LP: leukoplakia | ||
| NEOLP: Non-erosive oral lichen planus | ||
| OSCC: Oral squamous cell carcinoma |
| ∗log2FC in expression of this searched gene in stem-like cells from each diseased tissue sample relative to stem-like cells in normal samples in each tissue plotted against the malignancy continuum. Samples are colored based on if they are from different disease stage. |
Top |
Malignant transformation related pathway analysis |
| Find out the enriched GO biological processes and KEGG pathways involved in transition from healthy to precancer to cancer |
| Tissue | Disease Stage | Enriched GO biological Processes |
| Colorectum | AD |  |
| Colorectum | SER |  |
| Colorectum | MSS |  |
| Colorectum | MSI-H |  |
| Colorectum | FAP |  |
| ∗Top 15 enriched GO BP terms are showed in the bar plot of each disease state in each tissue. Each row represents a significant GO biological process which is colored according to the -log10(p.adjust). |
| Page: 1 2 3 4 5 6 7 8 9 |
| GO ID | Tissue | Disease Stage | Description | Gene Ratio | Bg Ratio | pvalue | p.adjust | Count |
| GO:0006753110 | Esophagus | ESCC | nucleoside phosphate metabolic process | 288/8552 | 497/18723 | 1.80e-08 | 3.50e-07 | 288 |
| GO:0019693111 | Esophagus | ESCC | ribose phosphate metabolic process | 234/8552 | 396/18723 | 4.24e-08 | 7.76e-07 | 234 |
| GO:0009117111 | Esophagus | ESCC | nucleotide metabolic process | 282/8552 | 489/18723 | 4.70e-08 | 8.50e-07 | 282 |
| GO:00067906 | Esophagus | ESCC | sulfur compound metabolic process | 201/8552 | 339/18723 | 2.64e-07 | 3.94e-06 | 201 |
| GO:0009259111 | Esophagus | ESCC | ribonucleotide metabolic process | 224/8552 | 385/18723 | 4.41e-07 | 6.00e-06 | 224 |
| GO:0072521111 | Esophagus | ESCC | purine-containing compound metabolic process | 238/8552 | 416/18723 | 1.20e-06 | 1.49e-05 | 238 |
| GO:0009150111 | Esophagus | ESCC | purine ribonucleotide metabolic process | 213/8552 | 368/18723 | 1.40e-06 | 1.69e-05 | 213 |
| GO:0046390110 | Esophagus | ESCC | ribose phosphate biosynthetic process | 119/8552 | 190/18723 | 1.73e-06 | 2.06e-05 | 119 |
| GO:00442725 | Esophagus | ESCC | sulfur compound biosynthetic process | 96/8552 | 148/18723 | 1.86e-06 | 2.16e-05 | 96 |
| GO:0006163111 | Esophagus | ESCC | purine nucleotide metabolic process | 226/8552 | 396/18723 | 2.81e-06 | 3.21e-05 | 226 |
| GO:000916516 | Esophagus | ESCC | nucleotide biosynthetic process | 150/8552 | 254/18723 | 1.12e-05 | 1.06e-04 | 150 |
| GO:0009260110 | Esophagus | ESCC | ribonucleotide biosynthetic process | 112/8552 | 182/18723 | 1.12e-05 | 1.06e-04 | 112 |
| GO:190129316 | Esophagus | ESCC | nucleoside phosphate biosynthetic process | 151/8552 | 256/18723 | 1.15e-05 | 1.08e-04 | 151 |
| GO:00338664 | Esophagus | ESCC | nucleoside bisphosphate biosynthetic process | 44/8552 | 60/18723 | 1.25e-05 | 1.15e-04 | 44 |
| GO:00340304 | Esophagus | ESCC | ribonucleoside bisphosphate biosynthetic process | 44/8552 | 60/18723 | 1.25e-05 | 1.15e-04 | 44 |
| GO:00340334 | Esophagus | ESCC | purine nucleoside bisphosphate biosynthetic process | 44/8552 | 60/18723 | 1.25e-05 | 1.15e-04 | 44 |
| GO:007252217 | Esophagus | ESCC | purine-containing compound biosynthetic process | 120/8552 | 200/18723 | 3.02e-05 | 2.51e-04 | 120 |
| GO:00066318 | Esophagus | ESCC | fatty acid metabolic process | 217/8552 | 390/18723 | 4.21e-05 | 3.39e-04 | 217 |
| GO:0009152110 | Esophagus | ESCC | purine ribonucleotide biosynthetic process | 103/8552 | 169/18723 | 4.40e-05 | 3.51e-04 | 103 |
| GO:000616417 | Esophagus | ESCC | purine nucleotide biosynthetic process | 113/8552 | 191/18723 | 1.16e-04 | 8.04e-04 | 113 |
| Page: 1 2 3 4 5 |
| Pathway ID | Tissue | Disease Stage | Description | Gene Ratio | Bg Ratio | pvalue | p.adjust | qvalue | Count |
| hsa012129 | Esophagus | ESCC | Fatty acid metabolism | 41/4205 | 57/8465 | 5.13e-04 | 1.75e-03 | 8.98e-04 | 41 |
| hsa002809 | Esophagus | ESCC | Valine, leucine and isoleucine degradation | 34/4205 | 48/8465 | 2.34e-03 | 6.54e-03 | 3.35e-03 | 34 |
| hsa0121214 | Esophagus | ESCC | Fatty acid metabolism | 41/4205 | 57/8465 | 5.13e-04 | 1.75e-03 | 8.98e-04 | 41 |
| hsa0028014 | Esophagus | ESCC | Valine, leucine and isoleucine degradation | 34/4205 | 48/8465 | 2.34e-03 | 6.54e-03 | 3.35e-03 | 34 |
| hsa0028041 | Liver | HCC | Valine, leucine and isoleucine degradation | 41/4020 | 48/8465 | 4.84e-08 | 7.05e-07 | 3.92e-07 | 41 |
| hsa012124 | Liver | HCC | Fatty acid metabolism | 45/4020 | 57/8465 | 1.05e-06 | 1.10e-05 | 6.09e-06 | 45 |
| hsa00061 | Liver | HCC | Fatty acid biosynthesis | 14/4020 | 18/8465 | 8.82e-03 | 2.36e-02 | 1.32e-02 | 14 |
| hsa0028051 | Liver | HCC | Valine, leucine and isoleucine degradation | 41/4020 | 48/8465 | 4.84e-08 | 7.05e-07 | 3.92e-07 | 41 |
| hsa012125 | Liver | HCC | Fatty acid metabolism | 45/4020 | 57/8465 | 1.05e-06 | 1.10e-05 | 6.09e-06 | 45 |
| hsa000611 | Liver | HCC | Fatty acid biosynthesis | 14/4020 | 18/8465 | 8.82e-03 | 2.36e-02 | 1.32e-02 | 14 |
| hsa012128 | Oral cavity | OSCC | Fatty acid metabolism | 35/3704 | 57/8465 | 5.37e-03 | 1.29e-02 | 6.55e-03 | 35 |
| hsa002808 | Oral cavity | OSCC | Valine, leucine and isoleucine degradation | 30/3704 | 48/8465 | 6.75e-03 | 1.57e-02 | 7.99e-03 | 30 |
| hsa0121213 | Oral cavity | OSCC | Fatty acid metabolism | 35/3704 | 57/8465 | 5.37e-03 | 1.29e-02 | 6.55e-03 | 35 |
| hsa0028013 | Oral cavity | OSCC | Valine, leucine and isoleucine degradation | 30/3704 | 48/8465 | 6.75e-03 | 1.57e-02 | 7.99e-03 | 30 |
| Page: 1 |
Top |
Cell-cell communication analysis |
| Identification of potential cell-cell interactions between two cell types and their ligand-receptor pairs for different disease states |
| Ligand | Receptor | LRpair | Pathway | Tissue | Disease Stage |
| Page: 1 |
Top |
Single-cell gene regulatory network inference analysis |
| Find out the significant the regulons (TFs) and the target genes of each regulon across cell types for different disease states |
| TF | Cell Type | Tissue | Disease Stage | Target Gene | RSS | Regulon Activity |
| ∗The dot plots of a searched regulon are shown for all cell subpopulations in each disease state of each tissue based on the regulon specific score inferred using pySCENIC and by calculating the average expression. |
| Page: 1 |
Top |
Somatic mutation of malignant transformation related genes |
| Annotation of somatic variants for genes involved in malignant transformation |
| Hugo Symbol | Variant Class | Variant Classification | dbSNP RS | HGVSc | HGVSp | HGVSp Short | SWISSPROT | BIOTYPE | SIFT | PolyPhen | Tumor Sample Barcode | Tissue | Histology | Sex | Age | Stage | Therapy Types | Drugs | Outcome |
| ACSF3 | SNV | Missense_Mutation | rs767244317 | c.1628N>G | p.Pro543Arg | p.P543R | Q4G176 | protein_coding | deleterious(0.05) | benign(0.062) | TCGA-A7-A26G-01 | Breast | breast invasive carcinoma | Female | <65 | I/II | Chemotherapy | taxotere | SD |
| ACSF3 | SNV | Missense_Mutation | c.976A>G | p.Arg326Gly | p.R326G | Q4G176 | protein_coding | deleterious(0) | probably_damaging(0.999) | TCGA-BH-A18G-01 | Breast | breast invasive carcinoma | Female | >=65 | I/II | Unknown | Unknown | SD | |
| ACSF3 | SNV | Missense_Mutation | c.952N>T | p.Arg318Cys | p.R318C | Q4G176 | protein_coding | deleterious(0) | benign(0.038) | TCGA-E9-A1RI-01 | Breast | breast invasive carcinoma | Female | <65 | III/IV | Hormone Therapy | tamoxiphen | SD | |
| ACSF3 | SNV | Missense_Mutation | c.220C>T | p.Arg74Cys | p.R74C | Q4G176 | protein_coding | deleterious(0.05) | possibly_damaging(0.849) | TCGA-2W-A8YY-01 | Cervix | cervical & endocervical cancer | Female | <65 | I/II | Chemotherapy | cisplatin | CR | |
| ACSF3 | SNV | Missense_Mutation | c.1537G>A | p.Gly513Ser | p.G513S | Q4G176 | protein_coding | deleterious(0.03) | probably_damaging(1) | TCGA-EK-A2PG-01 | Cervix | cervical & endocervical cancer | Female | >=65 | I/II | Unknown | Unknown | SD | |
| ACSF3 | SNV | Missense_Mutation | novel | c.805N>C | p.Glu269Gln | p.E269Q | Q4G176 | protein_coding | tolerated(0.17) | benign(0.026) | TCGA-VS-A958-01 | Cervix | cervical & endocervical cancer | Female | <65 | I/II | Chemotherapy | cisplatin | CR |
| ACSF3 | SNV | Missense_Mutation | rs762286480 | c.758N>T | p.Ala253Val | p.A253V | Q4G176 | protein_coding | tolerated(0.26) | benign(0.096) | TCGA-AA-3815-01 | Colorectum | colon adenocarcinoma | Female | >=65 | I/II | Unknown | Unknown | SD |
| ACSF3 | SNV | Missense_Mutation | rs200536797 | c.190G>A | p.Gly64Ser | p.G64S | Q4G176 | protein_coding | deleterious(0.03) | benign(0.057) | TCGA-AD-5900-01 | Colorectum | colon adenocarcinoma | Male | >=65 | I/II | Unknown | Unknown | SD |
| ACSF3 | SNV | Missense_Mutation | rs144711526 | c.116G>A | p.Arg39His | p.R39H | Q4G176 | protein_coding | tolerated(0.55) | benign(0) | TCGA-AZ-4615-01 | Colorectum | colon adenocarcinoma | Male | >=65 | III/IV | Chemotherapy | xeloda | PD |
| ACSF3 | SNV | Missense_Mutation | c.1117C>T | p.Arg373Cys | p.R373C | Q4G176 | protein_coding | deleterious(0) | probably_damaging(1) | TCGA-AZ-6601-01 | Colorectum | colon adenocarcinoma | Male | >=65 | I/II | Unknown | Unknown | PD |
| Page: 1 2 3 4 5 |
Top |
Related drugs of malignant transformation related genes |
| Identification of chemicals and drugs interact with genes involved in malignant transfromation |
| (DGIdb 4.0) |
| Entrez ID | Symbol | Category | Interaction Types | Drug Claim Name | Drug Name | PMIDs |
| Page: 1 |

Copyright 2023-Present -The University of Texas Health Science Center at Houston |