Schematic overview of the cellular and molecular mechanisms involved in the cancer progression, including the proposed cellular and molecular mechanisms in cancer cells trajectory. AT1: alveolar type 1 cells; AT2: alveolar type 2 cells; AAH: atypical adenomatous hyperplasia; AIS: adenocarcinoma in situ; MIA: minimally invasive adenocarcinoma; IA: invasive adenocarcinoma; EMT: epithelial-mesenchymal transition

Home

Download

Statistics

Help

Contact

Center for Computational Systems Medicine
leaf

Gene summary

leaf

Malignant transformation analysis

leaf

Malignant transformation related pathway analysis

leaf

Cell-cell communication analysis

leaf

Single-cell gene regulatory network inference analysis

leaf

Somatic mutation of malignant transformation related genes

leaf

Related drugs of malignant transformation related genes

Gene: ACSF2

Gene summary for ACSF2

check button Gene summary.

Gene informationSpeciesHuman
Gene symbol

ACSF2

Gene ID

80221

Gene nameacyl-CoA synthetase family member 2
Gene AliasACSMW
Cytomap17q21.33
Gene Typeprotein-coding
GO ID

GO:0001676

UniProtAcc

Q96CM8


Top

Malignant transformation analysis

check button Identification of the aberrant gene expression in precancerous and cancerous lesions by comparing the gene expression of stem-like cells in diseased tissues with normal stem cells
check button Malignant transformation involving gene list.
Entrez IDSymbolReplicatesSpeciesOrganTissueAdj P-valueLog2FCMalignancy
80221ACSF2HTA11_347_2000001011HumanColorectumAD8.21e-094.46e-01-0.1954
80221ACSF2A015-C-203HumanColorectumFAP1.27e-077.70e-02-0.1294
80221ACSF2A001-C-108HumanColorectumFAP8.51e-04-1.98e-01-0.0272
80221ACSF2A002-C-205HumanColorectumFAP1.19e-07-2.94e-01-0.1236
80221ACSF2A015-C-006HumanColorectumFAP5.24e-04-2.66e-01-0.0994
80221ACSF2A002-C-114HumanColorectumFAP1.19e-04-1.76e-01-0.1561
80221ACSF2A015-C-104HumanColorectumFAP1.11e-07-8.63e-02-0.1899
80221ACSF2A001-C-014HumanColorectumFAP8.59e-04-2.11e-010.0135
80221ACSF2A002-C-016HumanColorectumFAP1.24e-06-2.37e-010.0521
80221ACSF2A015-C-002HumanColorectumFAP2.48e-02-2.41e-01-0.0763
80221ACSF2A001-C-203HumanColorectumFAP1.24e-02-7.30e-02-0.0481
80221ACSF2A002-C-116HumanColorectumFAP3.19e-10-2.31e-01-0.0452
80221ACSF2A014-C-008HumanColorectumFAP1.01e-02-1.96e-01-0.191
80221ACSF2A018-E-020HumanColorectumFAP3.11e-04-1.60e-01-0.2034
80221ACSF2F034HumanColorectumFAP2.08e-05-1.54e-01-0.0665
80221ACSF2F072BHumanColorectumFAP1.78e-02-1.81e-010.257
80221ACSF2HCC1_MengHumanLiverHCC3.28e-173.96e-030.0246
80221ACSF2HCC2_MengHumanLiverHCC1.42e-041.38e-030.0107
80221ACSF2HCC1HumanLiverHCC5.13e-032.21e+000.5336
80221ACSF2HCC2HumanLiverHCC2.53e-031.33e+000.5341
Page: 1 2 

check button Transcriptomic changes along malignancy continuum.
TissueExpression DynamicsAbbreviation
Colorectum (GSE201348)The image shows the transcriptomic changes along malignancy continuum.log2FC in expression of this searched gene in stem-like cells from each diseased tissue sample relative to stem-like cells in normal samples in each tissue plotted against the malignancy continuum. Samples are colored based on if they are from different disease stage.FAP: Familial adenomatous polyposis
CRC: Colorectal cancer
Colorectum (HTA11)The image shows the transcriptomic changes along malignancy continuum.log2FC in expression of this searched gene in stem-like cells from each diseased tissue sample relative to stem-like cells in normal samples in each tissue plotted against the malignancy continuum. Samples are colored based on if they are from different disease stage.AD: Adenomas
SER: Sessile serrated lesions
MSI-H: Microsatellite-high colorectal cancer
MSS: Microsatellite stable colorectal cancer
LiverThe image shows the transcriptomic changes along malignancy continuum.log2FC in expression of this searched gene in stem-like cells from each diseased tissue sample relative to stem-like cells in normal samples in each tissue plotted against the malignancy continuum. Samples are colored based on if they are from different disease stage.
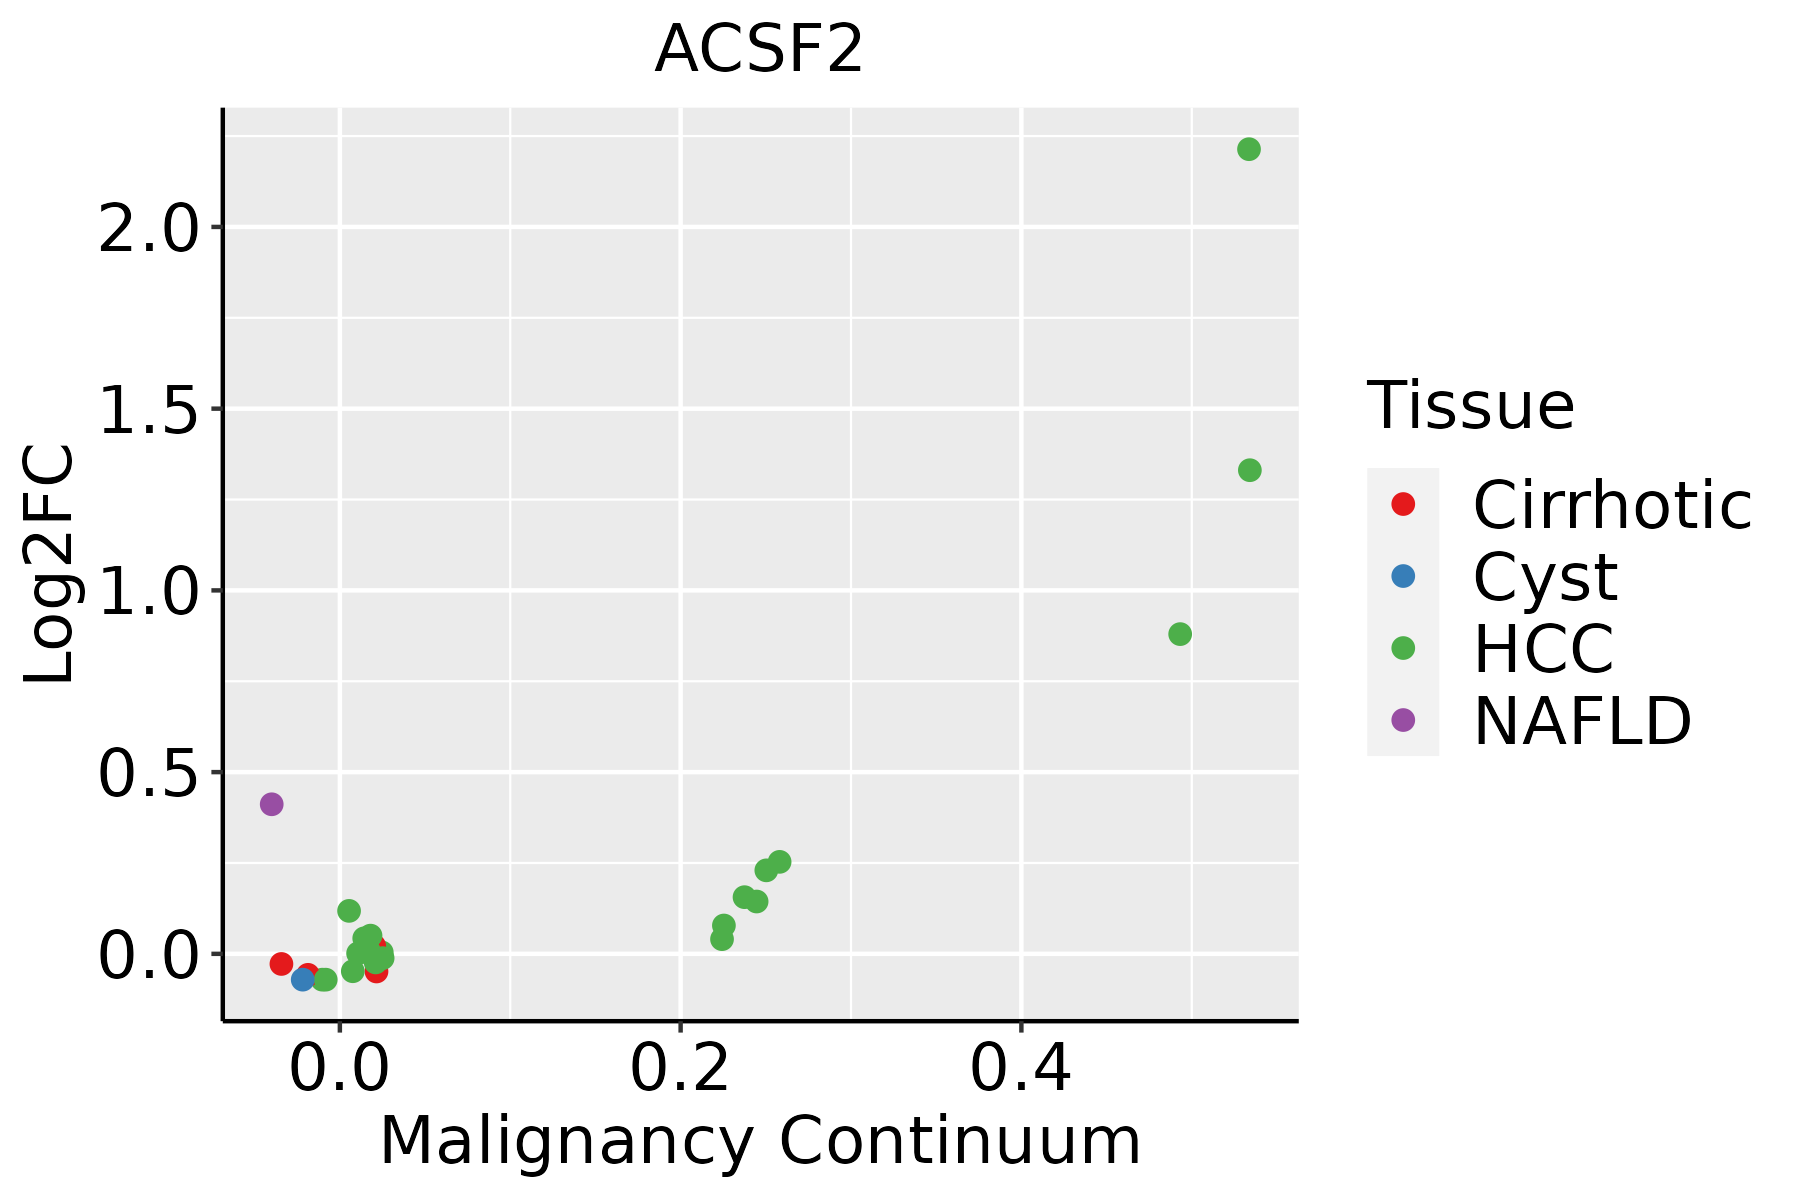
HCC: Hepatocellular carcinoma
NAFLD: Non-alcoholic fatty liver disease
ThyroidThe image shows the transcriptomic changes along malignancy continuum.log2FC in expression of this searched gene in stem-like cells from each diseased tissue sample relative to stem-like cells in normal samples in each tissue plotted against the malignancy continuum. Samples are colored based on if they are from different disease stage.
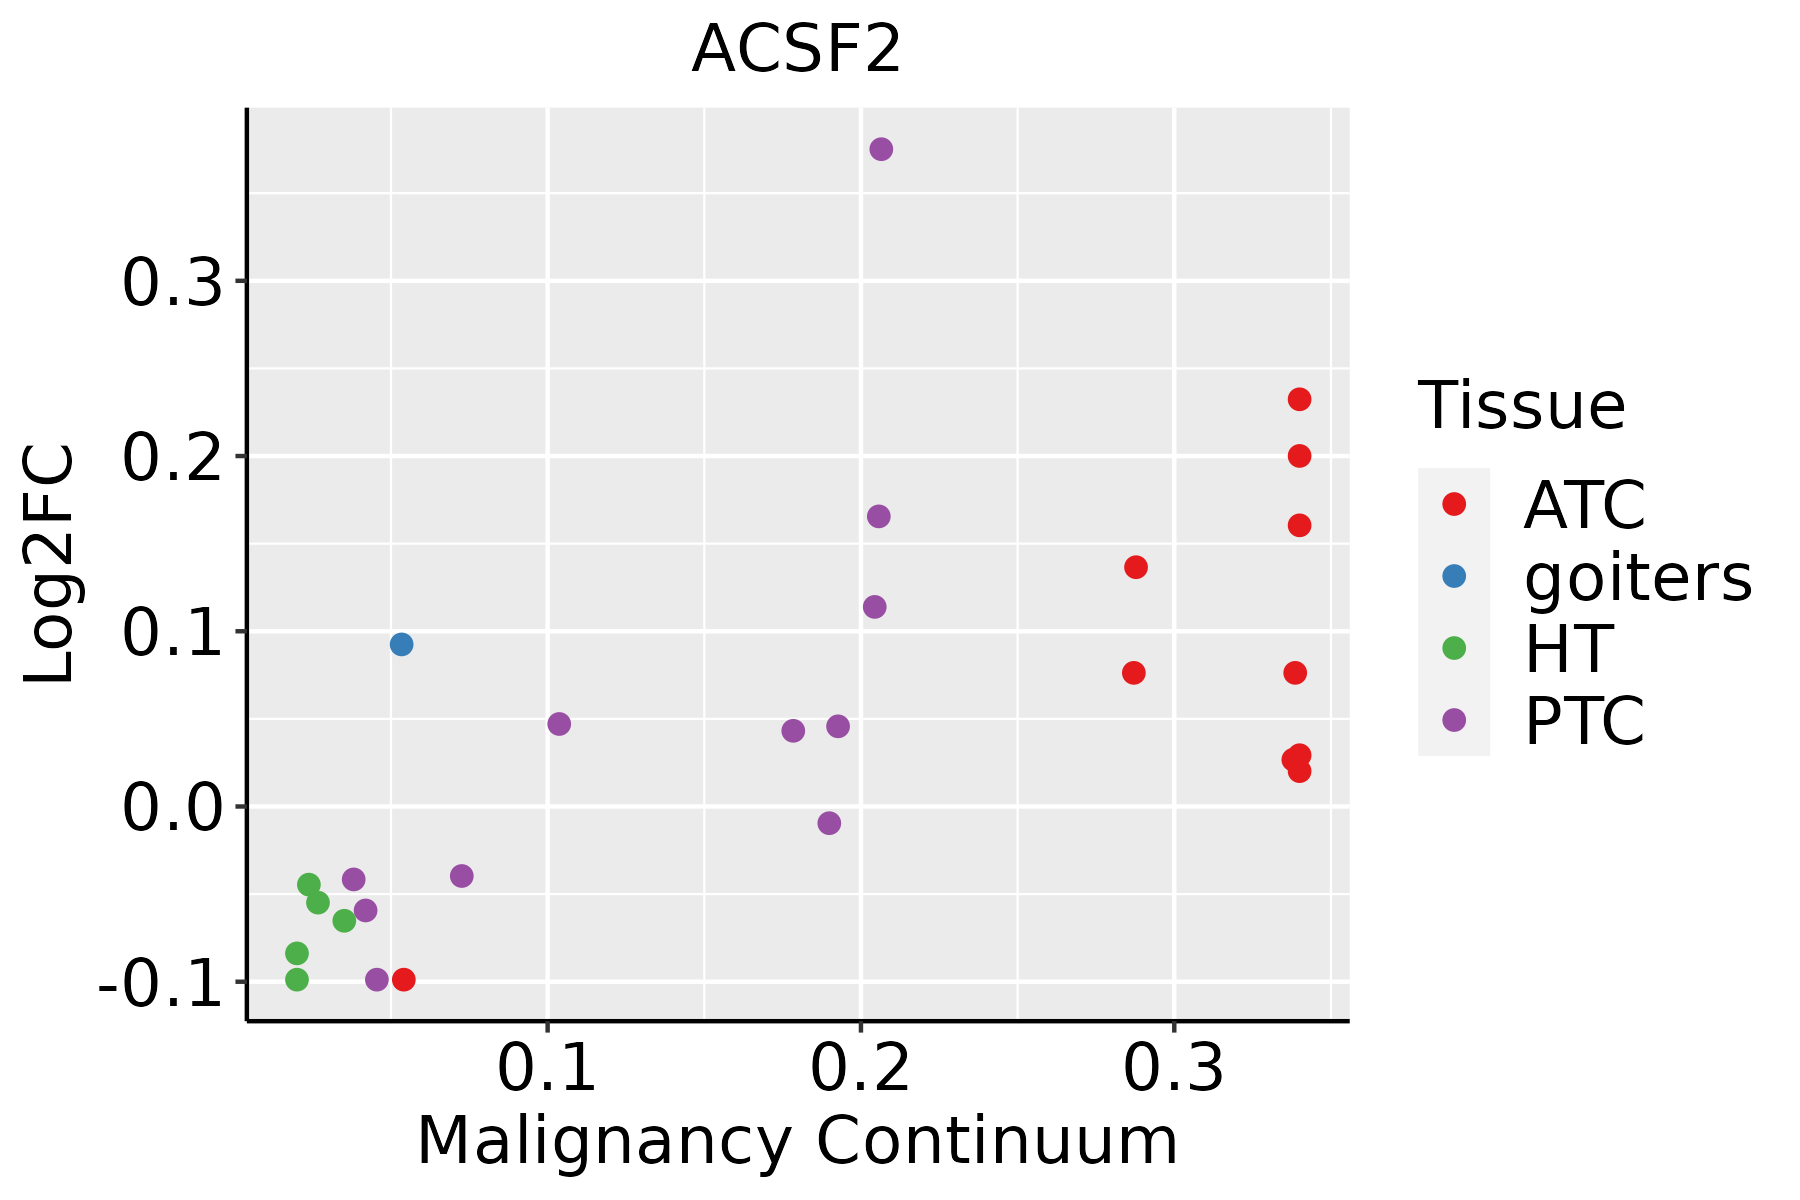
ATC: Anaplastic thyroid cancer
HT: Hashimoto's thyroiditis
PTC: Papillary thyroid cancer
∗log2FC in expression of this searched gene in stem-like cells from each diseased tissue sample relative to stem-like cells in normal samples in each tissue plotted against the malignancy continuum. Samples are colored based on if they are from different disease stage.

Top

Malignant transformation related pathway analysis

check buttonFind out the enriched GO biological processes and KEGG pathways involved in transition from healthy to precancer to cancer
check button Figure of enriched GO biological processes.
TissueDisease StageEnriched GO biological Processes
ColorectumADGO analysis - Figure of enriched GO biological processes: Top 15 enriched GO BP terms are showed in the bar plot of each disease state in each tissue. Each row represents a significant GO biological process which is colored according to the -log10(p.adjust).
ColorectumSERGO analysis - Figure of enriched GO biological processes: Top 15 enriched GO BP terms are showed in the bar plot of each disease state in each tissue. Each row represents a significant GO biological process which is colored according to the -log10(p.adjust).
ColorectumMSSGO analysis - Figure of enriched GO biological processes: Top 15 enriched GO BP terms are showed in the bar plot of each disease state in each tissue. Each row represents a significant GO biological process which is colored according to the -log10(p.adjust).
ColorectumMSI-HGO analysis - Figure of enriched GO biological processes: Top 15 enriched GO BP terms are showed in the bar plot of each disease state in each tissue. Each row represents a significant GO biological process which is colored according to the -log10(p.adjust).
ColorectumFAPGO analysis - Figure of enriched GO biological processes: Top 15 enriched GO BP terms are showed in the bar plot of each disease state in each tissue. Each row represents a significant GO biological process which is colored according to the -log10(p.adjust).
∗Top 15 enriched GO BP terms are showed in the bar plot of each disease state in each tissue. Each row represents a significant GO biological process which is colored according to the -log10(p.adjust).
Page: 1 2 3 4 5 6 7 8 9 

check button Enriched GO biological processes.
GO IDTissueDisease StageDescriptionGene RatioBg Ratiopvaluep.adjustCount
GO:0009150ColorectumADpurine ribonucleotide metabolic process142/3918368/187234.29e-151.17e-12142
GO:0006163ColorectumADpurine nucleotide metabolic process149/3918396/187231.08e-142.80e-12149
GO:0072521ColorectumADpurine-containing compound metabolic process153/3918416/187234.34e-141.01e-11153
GO:0009259ColorectumADribonucleotide metabolic process144/3918385/187235.25e-141.13e-11144
GO:0019693ColorectumADribose phosphate metabolic process145/3918396/187233.01e-135.71e-11145
GO:0009117ColorectumADnucleotide metabolic process168/3918489/187232.20e-123.36e-10168
GO:0006753ColorectumADnucleoside phosphate metabolic process169/3918497/187234.99e-126.98e-10169
GO:0006631ColorectumADfatty acid metabolic process114/3918390/187235.58e-059.44e-04114
GO:0006790ColorectumADsulfur compound metabolic process101/3918339/187236.46e-051.07e-03101
GO:0033865ColorectumADnucleoside bisphosphate metabolic process42/3918128/187231.12e-031.02e-0242
GO:0033875ColorectumADribonucleoside bisphosphate metabolic process42/3918128/187231.12e-031.02e-0242
GO:0034032ColorectumADpurine nucleoside bisphosphate metabolic process42/3918128/187231.12e-031.02e-0242
GO:00091504ColorectumFAPpurine ribonucleotide metabolic process96/2622368/187234.91e-101.20e-0796
GO:00061634ColorectumFAPpurine nucleotide metabolic process100/2622396/187231.45e-092.77e-07100
GO:00092593ColorectumFAPribonucleotide metabolic process97/2622385/187232.90e-095.07e-0797
GO:00725214ColorectumFAPpurine-containing compound metabolic process101/2622416/187231.11e-081.33e-06101
GO:00196933ColorectumFAPribose phosphate metabolic process97/2622396/187231.35e-081.51e-0697
GO:00091174ColorectumFAPnucleotide metabolic process105/2622489/187233.52e-061.25e-04105
GO:00067534ColorectumFAPnucleoside phosphate metabolic process105/2622497/187237.47e-062.25e-04105
GO:00066313ColorectumFAPfatty acid metabolic process81/2622390/187231.43e-042.24e-0381
Page: 1 2 3 

check button Enriched KEGG pathways.
Pathway IDTissueDisease StageDescriptionGene RatioBg Ratiopvaluep.adjustqvalueCount
Page: 1 

Top

Cell-cell communication analysis

check buttonIdentification of potential cell-cell interactions between two cell types and their ligand-receptor pairs for different disease states
LigandReceptorLRpairPathwayTissueDisease Stage
Page: 1 

Top

Single-cell gene regulatory network inference analysis

check buttonFind out the significant the regulons (TFs) and the target genes of each regulon across cell types for different disease states
TFCell TypeTissueDisease StageTarget GeneRSSRegulon Activity
∗The dot plots of a searched regulon are shown for all cell subpopulations in each disease state of each tissue based on the regulon specific score inferred using pySCENIC and by calculating the average expression.
Page: 1 

Top

Somatic mutation of malignant transformation related genes

check buttonAnnotation of somatic variants for genes involved in malignant transformation
Hugo SymbolVariant ClassVariant ClassificationdbSNP RSHGVScHGVSpHGVSp ShortSWISSPROTBIOTYPESIFTPolyPhenTumor Sample BarcodeTissueHistologySexAgeStageTherapy TypesDrugsOutcome
ACSF2SNVMissense_Mutationrs770288175c.1744N>Tp.Arg582Trpp.R582WQ96CM8protein_codingdeleterious(0.02)probably_damaging(0.997)TCGA-D8-A1J9-01Breastbreast invasive carcinomaFemale<65I/IIUnknownUnknownSD
ACSF2SNVMissense_Mutationc.1700G>Cp.Gly567Alap.G567AQ96CM8protein_codingdeleterious(0)probably_damaging(0.948)TCGA-D8-A1XK-01Breastbreast invasive carcinomaFemale<65I/IIChemotherapydoxorubicine+cyclophosphamideSD
ACSF2insertionFrame_Shift_Insnovelc.1798_1799insAAp.Gly600GlufsTer40p.G600Efs*40Q96CM8protein_codingTCGA-A8-A07U-01Breastbreast invasive carcinomaFemale>=65III/IVChemotherapy5-fluorouracilSD
ACSF2insertionIn_Frame_Insnovelc.1799_1800insATGTCTGGAGACATTTGAGCTGAGACCTGGAAAp.Gly600_Lys601insCysLeuGluThrPheGluLeuArgProGlyLysp.G600_K601insCLETFELRPGKQ96CM8protein_codingTCGA-A8-A07U-01Breastbreast invasive carcinomaFemale>=65III/IVChemotherapy5-fluorouracilSD
ACSF2insertionFrame_Shift_Insnovelc.1053_1054insTCAGGCAGGGGTGGGGGGCTGGCTGGGCTCCCCTTGCCAGCTAGAGAp.Ala352SerfsTer54p.A352Sfs*54Q96CM8protein_codingTCGA-A8-A091-01Breastbreast invasive carcinomaFemale<65I/IIChemotherapy5-fluorouracilPD
ACSF2SNVMissense_Mutationnovelc.1087N>Ap.Gly363Serp.G363SQ96CM8protein_codingtolerated(0.15)benign(0.241)TCGA-2W-A8YY-01Cervixcervical & endocervical cancerFemale<65I/IIChemotherapycisplatinCR
ACSF2SNVMissense_Mutationc.553G>Ap.Ala185Thrp.A185TQ96CM8protein_codingtolerated(0.63)benign(0.06)TCGA-LP-A5U2-01Cervixcervical & endocervical cancerFemale<65III/IVUnknownUnknownSD
ACSF2SNVMissense_Mutationrs780707588c.640N>Ap.Val214Ilep.V214IQ96CM8protein_codingtolerated(0.55)benign(0)TCGA-MA-AA3W-01Cervixcervical & endocervical cancerFemale<65I/IIChemotherapycisplatinCR
ACSF2SNVMissense_Mutationnovelc.1083C>Ap.Phe361Leup.F361LQ96CM8protein_codingdeleterious(0)probably_damaging(0.977)TCGA-VS-A8EK-01Cervixcervical & endocervical cancerFemale>=65I/IIChemotherapycisplatinPD
ACSF2SNVMissense_Mutationnovelc.1073N>Gp.Ser358Cysp.S358CQ96CM8protein_codingdeleterious(0.04)probably_damaging(0.998)TCGA-VS-A8QA-01Cervixcervical & endocervical cancerFemale<65I/IIUnknownUnknownSD
Page: 1 2 3 4 5 

Top

Related drugs of malignant transformation related genes

check buttonIdentification of chemicals and drugs interact with genes involved in malignant transfromation
(DGIdb 4.0)
Entrez IDSymbolCategoryInteraction TypesDrug Claim NameDrug NamePMIDs
Page: 1