
|
|||||
|
 | |
| |
| |
| |
| |
| |
|
Gene: ACPP |
Gene summary for ACPP |
| Gene information | Species | Human | Gene symbol | ACPP | Gene ID | 55 |
| Gene name | acid phosphatase 3 | |
| Gene Alias | 5'-NT | |
| Cytomap | 3q22.1 | |
| Gene Type | protein-coding | GO ID | GO:0001973 | UniProtAcc | P15309 |
Top |
Malignant transformation analysis |
| Identification of the aberrant gene expression in precancerous and cancerous lesions by comparing the gene expression of stem-like cells in diseased tissues with normal stem cells |
| Entrez ID | Symbol | Replicates | Species | Organ | Tissue | Adj P-value | Log2FC | Malignancy |
| 55 | ACPP | GSM5252135_BPH511PrPUr_Fcol_3GEX | Human | Prostate | BPH | 3.66e-04 | 1.07e+00 | -0.1833 |
| 55 | ACPP | 047563_1562-all-cells | Human | Prostate | BPH | 1.32e-41 | 1.10e+00 | 0.0791 |
| 55 | ACPP | 048752_1579-all-cells | Human | Prostate | BPH | 3.34e-129 | 1.36e+00 | 0.1008 |
| 55 | ACPP | 052095_1628-all-cells | Human | Prostate | BPH | 2.38e-04 | 2.37e-01 | 0.1032 |
| 55 | ACPP | 052097_1595-all-cells | Human | Prostate | BPH | 5.42e-37 | 6.86e-01 | 0.0972 |
| 55 | ACPP | 052099_1652-all-cells | Human | Prostate | BPH | 3.06e-39 | 7.60e-01 | 0.1038 |
| 55 | ACPP | Dong_P5 | Human | Prostate | Tumor | 1.02e-03 | -1.09e-01 | 0.053 |
| 55 | ACPP | GSM5353220_PA_PB1B_Pool_3_S51_L002 | Human | Prostate | Tumor | 7.64e-03 | 9.21e-01 | 0.1531 |
| 55 | ACPP | GSM5353223_PA_PB2B_Pool_2_S26_L001 | Human | Prostate | Tumor | 2.06e-03 | 6.26e-01 | 0.1604 |
| 55 | ACPP | GSM5353237_PA_PR5251_T2_S8_L001 | Human | Prostate | Tumor | 3.95e-02 | 6.68e-01 | 0.1622 |
| Page: 1 |
| Tissue | Expression Dynamics | Abbreviation |
| Prostate | 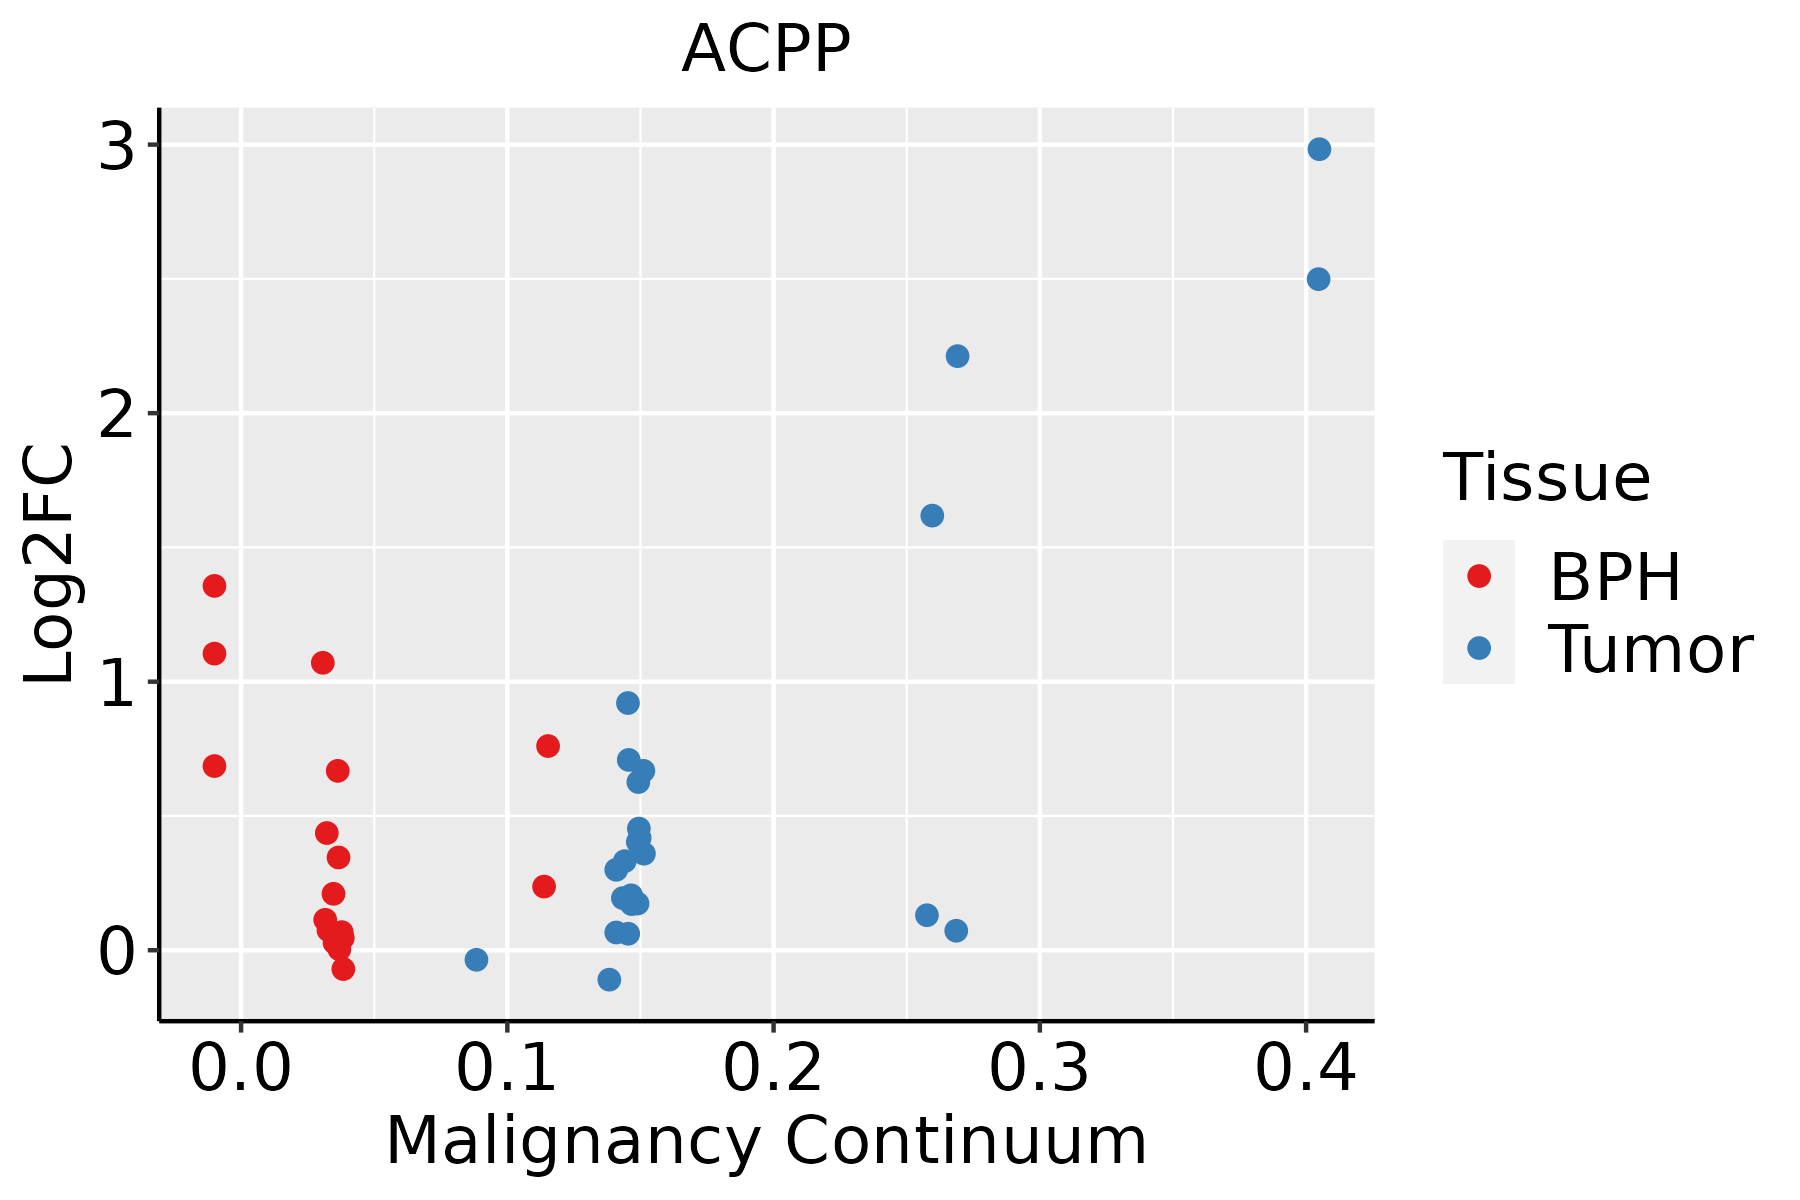 | BPH: Benign Prostatic Hyperplasia |
| ∗log2FC in expression of this searched gene in stem-like cells from each diseased tissue sample relative to stem-like cells in normal samples in each tissue plotted against the malignancy continuum. Samples are colored based on if they are from different disease stage. |
Top |
Malignant transformation related pathway analysis |
| Find out the enriched GO biological processes and KEGG pathways involved in transition from healthy to precancer to cancer |
| Tissue | Disease Stage | Enriched GO biological Processes |
| Colorectum | AD |  |
| Colorectum | SER |  |
| Colorectum | MSS |  |
| Colorectum | MSI-H |  |
| Colorectum | FAP |  |
| ∗Top 15 enriched GO BP terms are showed in the bar plot of each disease state in each tissue. Each row represents a significant GO biological process which is colored according to the -log10(p.adjust). |
| Page: 1 2 3 4 5 6 7 8 9 |
| GO ID | Tissue | Disease Stage | Description | Gene Ratio | Bg Ratio | pvalue | p.adjust | Count |
| Page: 1 |
| Pathway ID | Tissue | Disease Stage | Description | Gene Ratio | Bg Ratio | pvalue | p.adjust | qvalue | Count |
| Page: 1 |
Top |
Cell-cell communication analysis |
| Identification of potential cell-cell interactions between two cell types and their ligand-receptor pairs for different disease states |
| Ligand | Receptor | LRpair | Pathway | Tissue | Disease Stage |
| Page: 1 |
Top |
Single-cell gene regulatory network inference analysis |
| Find out the significant the regulons (TFs) and the target genes of each regulon across cell types for different disease states |
| TF | Cell Type | Tissue | Disease Stage | Target Gene | RSS | Regulon Activity |
| ∗The dot plots of a searched regulon are shown for all cell subpopulations in each disease state of each tissue based on the regulon specific score inferred using pySCENIC and by calculating the average expression. |
| Page: 1 |
Top |
Somatic mutation of malignant transformation related genes |
| Annotation of somatic variants for genes involved in malignant transformation |
| Hugo Symbol | Variant Class | Variant Classification | dbSNP RS | HGVSc | HGVSp | HGVSp Short | SWISSPROT | BIOTYPE | SIFT | PolyPhen | Tumor Sample Barcode | Tissue | Histology | Sex | Age | Stage | Therapy Types | Drugs | Outcome |
| ACPP | SNV | Missense_Mutation | c.83N>T | p.Arg28Leu | p.R28L | P15309 | protein_coding | tolerated(0.13) | benign(0) | TCGA-A1-A0SI-01 | Breast | breast invasive carcinoma | Female | <65 | I/II | Unknown | Unknown | SD | |
| ACPP | SNV | Missense_Mutation | c.784N>T | p.Val262Phe | p.V262F | P15309 | protein_coding | deleterious(0) | probably_damaging(0.958) | TCGA-A8-A08P-01 | Breast | breast invasive carcinoma | Female | >=65 | III/IV | Chemotherapy | 5-fluorouracil | CR | |
| ACPP | SNV | Missense_Mutation | novel | c.986N>C | p.Met329Thr | p.M329T | P15309 | protein_coding | deleterious(0) | probably_damaging(0.999) | TCGA-AC-A7VC-01 | Breast | breast invasive carcinoma | Female | <65 | I/II | Unknown | Unknown | SD |
| ACPP | SNV | Missense_Mutation | novel | c.848N>G | p.Leu283Arg | p.L283R | P15309 | protein_coding | deleterious(0) | possibly_damaging(0.747) | TCGA-AN-A046-01 | Breast | breast invasive carcinoma | Female | >=65 | I/II | Unknown | Unknown | SD |
| ACPP | SNV | Missense_Mutation | rs781475900 | c.127N>T | p.Arg43Trp | p.R43W | P15309 | protein_coding | deleterious(0) | probably_damaging(1) | TCGA-AR-A24X-01 | Breast | breast invasive carcinoma | Female | <65 | I/II | Hormone Therapy | tamoxiphen | SD |
| ACPP | SNV | Missense_Mutation | rs781475900 | c.127C>T | p.Arg43Trp | p.R43W | P15309 | protein_coding | deleterious(0) | probably_damaging(1) | TCGA-BH-A0HY-01 | Breast | breast invasive carcinoma | Female | <65 | I/II | Hormone Therapy | taxotere | CR |
| ACPP | SNV | Missense_Mutation | c.261N>C | p.Lys87Asn | p.K87N | P15309 | protein_coding | tolerated(0.12) | probably_damaging(0.92) | TCGA-C8-A274-01 | Breast | breast invasive carcinoma | Female | <65 | I/II | Hormone Therapy | tamoxiphen | SD | |
| ACPP | SNV | Missense_Mutation | rs141767289 | c.425N>T | p.Pro142Leu | p.P142L | P15309 | protein_coding | deleterious(0.01) | probably_damaging(1) | TCGA-GM-A2DB-01 | Breast | breast invasive carcinoma | Female | <65 | I/II | Chemotherapy | taxol | CR |
| ACPP | SNV | Missense_Mutation | rs370637506 | c.488N>A | p.Arg163His | p.R163H | P15309 | protein_coding | deleterious(0.02) | probably_damaging(0.991) | TCGA-C5-A8ZZ-01 | Cervix | cervical & endocervical cancer | Female | <65 | I/II | Unspecific | Cisplatin | SD |
| ACPP | SNV | Missense_Mutation | c.83N>T | p.Arg28Leu | p.R28L | P15309 | protein_coding | tolerated(0.13) | benign(0) | TCGA-UC-A7PG-06 | Cervix | cervical & endocervical cancer | Female | <65 | III/IV | Chemotherapy | cisplatin | PD |
| Page: 1 2 3 4 5 |
Top |
Related drugs of malignant transformation related genes |
| Identification of chemicals and drugs interact with genes involved in malignant transfromation |
| (DGIdb 4.0) |
| Entrez ID | Symbol | Category | Interaction Types | Drug Claim Name | Drug Name | PMIDs |
| Page: 1 |

Copyright 2023-Present -The University of Texas Health Science Center at Houston |