
|
|||||
|
 | |
| |
| |
| |
| |
| |
|
Gene: ACP6 |
Gene summary for ACP6 |
| Gene information | Species | Human | Gene symbol | ACP6 | Gene ID | 51205 |
| Gene name | acid phosphatase 6, lysophosphatidic | |
| Gene Alias | ACPL1 | |
| Cytomap | 1q21.2 | |
| Gene Type | protein-coding | GO ID | GO:0002244 | UniProtAcc | Q9NPH0 |
Top |
Malignant transformation analysis |
| Identification of the aberrant gene expression in precancerous and cancerous lesions by comparing the gene expression of stem-like cells in diseased tissues with normal stem cells |
| Entrez ID | Symbol | Replicates | Species | Organ | Tissue | Adj P-value | Log2FC | Malignancy |
| 51205 | ACP6 | LZE24T | Human | Esophagus | ESCC | 4.77e-23 | 5.10e-01 | 0.0596 |
| 51205 | ACP6 | P2T-E | Human | Esophagus | ESCC | 1.38e-06 | 1.35e-01 | 0.1177 |
| 51205 | ACP6 | P4T-E | Human | Esophagus | ESCC | 2.46e-17 | 3.34e-01 | 0.1323 |
| 51205 | ACP6 | P8T-E | Human | Esophagus | ESCC | 1.65e-03 | 4.46e-02 | 0.0889 |
| 51205 | ACP6 | P9T-E | Human | Esophagus | ESCC | 1.34e-02 | 4.36e-02 | 0.1131 |
| 51205 | ACP6 | P10T-E | Human | Esophagus | ESCC | 1.44e-09 | 1.15e-01 | 0.116 |
| 51205 | ACP6 | P12T-E | Human | Esophagus | ESCC | 6.81e-13 | 1.05e-01 | 0.1122 |
| 51205 | ACP6 | P15T-E | Human | Esophagus | ESCC | 1.75e-08 | 1.17e-01 | 0.1149 |
| 51205 | ACP6 | P16T-E | Human | Esophagus | ESCC | 2.62e-06 | 1.10e-01 | 0.1153 |
| 51205 | ACP6 | P17T-E | Human | Esophagus | ESCC | 1.77e-05 | 1.93e-01 | 0.1278 |
| 51205 | ACP6 | P20T-E | Human | Esophagus | ESCC | 8.14e-05 | 1.17e-01 | 0.1124 |
| 51205 | ACP6 | P22T-E | Human | Esophagus | ESCC | 1.31e-09 | 1.81e-01 | 0.1236 |
| 51205 | ACP6 | P23T-E | Human | Esophagus | ESCC | 2.20e-11 | 1.71e-01 | 0.108 |
| 51205 | ACP6 | P24T-E | Human | Esophagus | ESCC | 1.56e-04 | 5.26e-02 | 0.1287 |
| 51205 | ACP6 | P26T-E | Human | Esophagus | ESCC | 1.38e-11 | 1.77e-01 | 0.1276 |
| 51205 | ACP6 | P27T-E | Human | Esophagus | ESCC | 1.34e-08 | 1.33e-01 | 0.1055 |
| 51205 | ACP6 | P28T-E | Human | Esophagus | ESCC | 2.34e-07 | 5.46e-02 | 0.1149 |
| 51205 | ACP6 | P37T-E | Human | Esophagus | ESCC | 5.55e-03 | 3.12e-02 | 0.1371 |
| 51205 | ACP6 | P39T-E | Human | Esophagus | ESCC | 3.98e-06 | 3.46e-02 | 0.0894 |
| 51205 | ACP6 | P42T-E | Human | Esophagus | ESCC | 1.54e-02 | 9.70e-02 | 0.1175 |
| Page: 1 2 3 |
| Tissue | Expression Dynamics | Abbreviation |
| Esophagus |  | ESCC: Esophageal squamous cell carcinoma |
| HGIN: High-grade intraepithelial neoplasias | ||
| LGIN: Low-grade intraepithelial neoplasias | ||
| Liver | 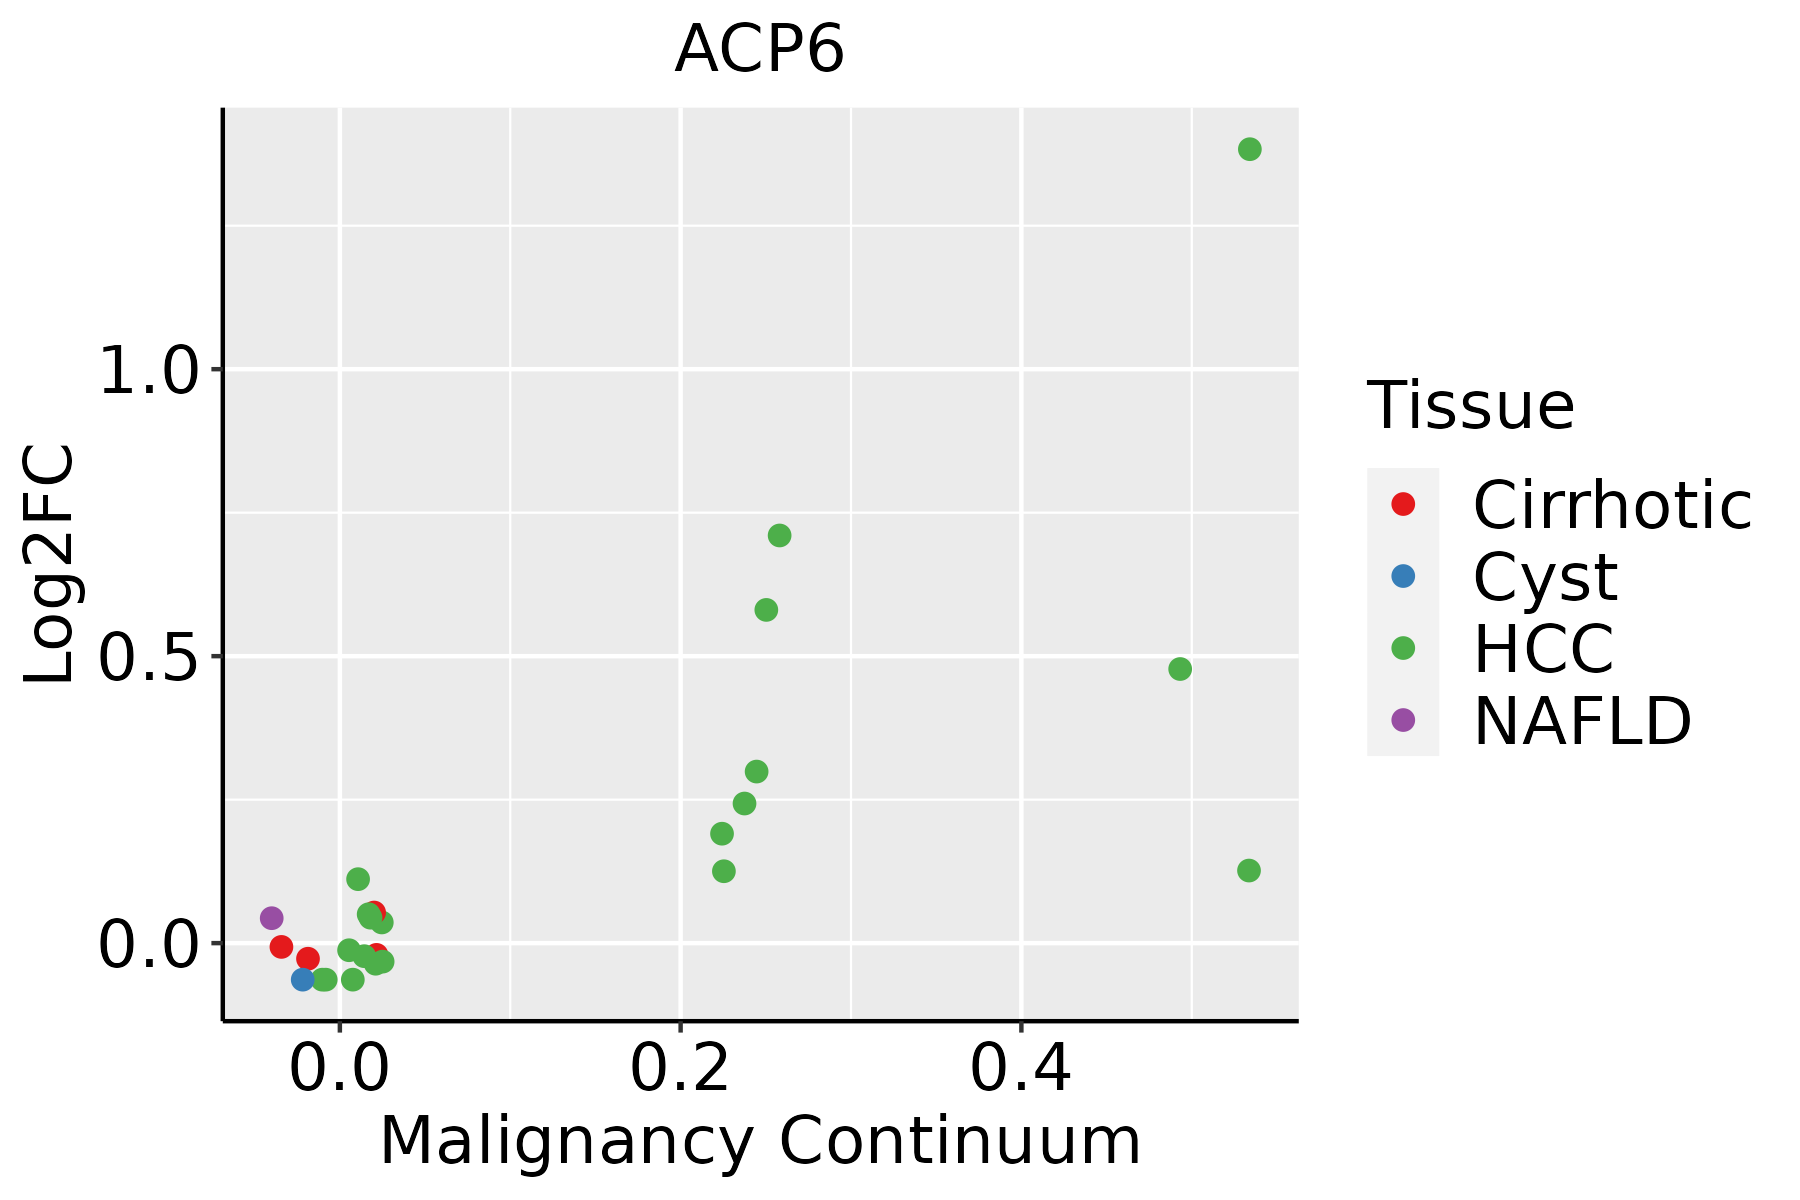 | HCC: Hepatocellular carcinoma |
| NAFLD: Non-alcoholic fatty liver disease |
| ∗log2FC in expression of this searched gene in stem-like cells from each diseased tissue sample relative to stem-like cells in normal samples in each tissue plotted against the malignancy continuum. Samples are colored based on if they are from different disease stage. |
Top |
Malignant transformation related pathway analysis |
| Find out the enriched GO biological processes and KEGG pathways involved in transition from healthy to precancer to cancer |
| Tissue | Disease Stage | Enriched GO biological Processes |
| Colorectum | AD |  |
| Colorectum | SER |  |
| Colorectum | MSS |  |
| Colorectum | MSI-H |  |
| Colorectum | FAP |  |
| ∗Top 15 enriched GO BP terms are showed in the bar plot of each disease state in each tissue. Each row represents a significant GO biological process which is colored according to the -log10(p.adjust). |
| Page: 1 2 3 4 5 6 7 8 9 |
| GO ID | Tissue | Disease Stage | Description | Gene Ratio | Bg Ratio | pvalue | p.adjust | Count |
| GO:001631110 | Esophagus | ESCC | dephosphorylation | 251/8552 | 417/18723 | 1.26e-09 | 2.99e-08 | 251 |
| GO:00086544 | Esophagus | ESCC | phospholipid biosynthetic process | 162/8552 | 253/18723 | 2.59e-09 | 5.73e-08 | 162 |
| GO:00464744 | Esophagus | ESCC | glycerophospholipid biosynthetic process | 135/8552 | 211/18723 | 5.75e-08 | 1.02e-06 | 135 |
| GO:00450175 | Esophagus | ESCC | glycerolipid biosynthetic process | 154/8552 | 252/18723 | 5.20e-07 | 6.96e-06 | 154 |
| GO:00066446 | Esophagus | ESCC | phospholipid metabolic process | 218/8552 | 383/18723 | 5.37e-06 | 5.59e-05 | 218 |
| GO:00066505 | Esophagus | ESCC | glycerophospholipid metabolic process | 174/8552 | 306/18723 | 4.92e-05 | 3.85e-04 | 174 |
| GO:00066541 | Esophagus | ESCC | phosphatidic acid biosynthetic process | 26/8552 | 33/18723 | 1.06e-04 | 7.43e-04 | 26 |
| GO:00464733 | Esophagus | ESCC | phosphatidic acid metabolic process | 28/8552 | 37/18723 | 2.00e-04 | 1.26e-03 | 28 |
| GO:00464864 | Esophagus | ESCC | glycerolipid metabolic process | 211/8552 | 392/18723 | 6.51e-04 | 3.46e-03 | 211 |
| GO:00022446 | Esophagus | ESCC | hematopoietic progenitor cell differentiation | 66/8552 | 114/18723 | 5.74e-03 | 2.13e-02 | 66 |
| GO:00086542 | Liver | HCC | phospholipid biosynthetic process | 150/7958 | 253/18723 | 4.77e-08 | 1.03e-06 | 150 |
| GO:00066444 | Liver | HCC | phospholipid metabolic process | 214/7958 | 383/18723 | 7.25e-08 | 1.48e-06 | 214 |
| GO:001631121 | Liver | HCC | dephosphorylation | 230/7958 | 417/18723 | 1.00e-07 | 1.96e-06 | 230 |
| GO:004648611 | Liver | HCC | glycerolipid metabolic process | 215/7958 | 392/18723 | 4.54e-07 | 7.49e-06 | 215 |
| GO:004501711 | Liver | HCC | glycerolipid biosynthetic process | 143/7958 | 252/18723 | 3.27e-06 | 4.31e-05 | 143 |
| GO:00066504 | Liver | HCC | glycerophospholipid metabolic process | 168/7958 | 306/18723 | 7.27e-06 | 8.62e-05 | 168 |
| GO:004647411 | Liver | HCC | glycerophospholipid biosynthetic process | 121/7958 | 211/18723 | 9.12e-06 | 1.06e-04 | 121 |
| GO:0006654 | Liver | HCC | phosphatidic acid biosynthetic process | 23/7958 | 33/18723 | 1.46e-03 | 7.75e-03 | 23 |
| GO:00464732 | Liver | HCC | phosphatidic acid metabolic process | 24/7958 | 37/18723 | 5.03e-03 | 2.11e-02 | 24 |
| GO:0052646 | Liver | HCC | alditol phosphate metabolic process | 9/7958 | 11/18723 | 9.51e-03 | 3.60e-02 | 9 |
| Page: 1 |
| Pathway ID | Tissue | Disease Stage | Description | Gene Ratio | Bg Ratio | pvalue | p.adjust | qvalue | Count |
| Page: 1 |
Top |
Cell-cell communication analysis |
| Identification of potential cell-cell interactions between two cell types and their ligand-receptor pairs for different disease states |
| Ligand | Receptor | LRpair | Pathway | Tissue | Disease Stage |
| Page: 1 |
Top |
Single-cell gene regulatory network inference analysis |
| Find out the significant the regulons (TFs) and the target genes of each regulon across cell types for different disease states |
| TF | Cell Type | Tissue | Disease Stage | Target Gene | RSS | Regulon Activity |
| ∗The dot plots of a searched regulon are shown for all cell subpopulations in each disease state of each tissue based on the regulon specific score inferred using pySCENIC and by calculating the average expression. |
| Page: 1 |
Top |
Somatic mutation of malignant transformation related genes |
| Annotation of somatic variants for genes involved in malignant transformation |
| Hugo Symbol | Variant Class | Variant Classification | dbSNP RS | HGVSc | HGVSp | HGVSp Short | SWISSPROT | BIOTYPE | SIFT | PolyPhen | Tumor Sample Barcode | Tissue | Histology | Sex | Age | Stage | Therapy Types | Drugs | Outcome |
| ACP6 | SNV | Missense_Mutation | novel | c.883N>A | p.Glu295Lys | p.E295K | protein_coding | tolerated(0.12) | benign(0.329) | TCGA-BH-A0AW-01 | Breast | breast invasive carcinoma | Female | <65 | I/II | Chemotherapy | carboplatin | SD | |
| ACP6 | SNV | Missense_Mutation | c.668N>G | p.Ser223Cys | p.S223C | protein_coding | tolerated(0.07) | benign(0.029) | TCGA-C8-A274-01 | Breast | breast invasive carcinoma | Female | <65 | I/II | Hormone Therapy | tamoxiphen | SD | ||
| ACP6 | deletion | Frame_Shift_Del | novel | c.719delG | p.Gly240AlafsTer31 | p.G240Afs*31 | protein_coding | TCGA-EW-A2FV-01 | Breast | breast invasive carcinoma | Female | <65 | III/IV | Chemotherapy | docetaxel | SD | |||
| ACP6 | SNV | Missense_Mutation | novel | c.1208N>T | p.Ser403Leu | p.S403L | protein_coding | deleterious(0.01) | probably_damaging(0.956) | TCGA-BI-A0VS-01 | Cervix | cervical & endocervical cancer | Female | <65 | I/II | Unknown | Unknown | SD | |
| ACP6 | SNV | Missense_Mutation | c.1106N>T | p.Ser369Phe | p.S369F | protein_coding | deleterious(0) | probably_damaging(0.97) | TCGA-BI-A0VS-01 | Cervix | cervical & endocervical cancer | Female | <65 | I/II | Unknown | Unknown | SD | ||
| ACP6 | SNV | Missense_Mutation | rs781853603 | c.1265T>C | p.Met422Thr | p.M422T | protein_coding | tolerated(0.34) | benign(0) | TCGA-A6-6648-01 | Colorectum | colon adenocarcinoma | Male | <65 | I/II | Chemotherapy | oxaliplatin | PD | |
| ACP6 | SNV | Missense_Mutation | novel | c.715N>G | p.Met239Val | p.M239V | protein_coding | tolerated(0.1) | benign(0) | TCGA-AA-A00O-01 | Colorectum | colon adenocarcinoma | Female | >=65 | III/IV | Unknown | Unknown | SD | |
| ACP6 | SNV | Missense_Mutation | novel | c.704T>C | p.Val235Ala | p.V235A | protein_coding | deleterious(0) | benign(0.159) | TCGA-AD-6964-01 | Colorectum | colon adenocarcinoma | Male | <65 | III/IV | Chemotherapy | folfox | PD | |
| ACP6 | SNV | Missense_Mutation | rs201678741 | c.86N>G | p.Val29Gly | p.V29G | protein_coding | tolerated(0.26) | benign(0) | TCGA-D5-5540-01 | Colorectum | colon adenocarcinoma | Male | >=65 | I/II | Unknown | Unknown | SD | |
| ACP6 | SNV | Missense_Mutation | novel | c.739N>T | p.Val247Leu | p.V247L | protein_coding | tolerated(0.2) | benign(0.113) | TCGA-A5-A0G2-01 | Endometrium | uterine corpus endometrioid carcinoma | Female | <65 | III/IV | Unknown | Unknown | SD |
| Page: 1 2 3 |
Top |
Related drugs of malignant transformation related genes |
| Identification of chemicals and drugs interact with genes involved in malignant transfromation |
| (DGIdb 4.0) |
| Entrez ID | Symbol | Category | Interaction Types | Drug Claim Name | Drug Name | PMIDs |
| Page: 1 |

Copyright 2023-Present -The University of Texas Health Science Center at Houston |