
|
|||||
|
 | |
| |
| |
| |
| |
| |
|
Gene: ACP5 |
Gene summary for ACP5 |
| Gene information | Species | Human | Gene symbol | ACP5 | Gene ID | 54 |
| Gene name | acid phosphatase 5, tartrate resistant | |
| Gene Alias | HPAP | |
| Cytomap | 19p13.2 | |
| Gene Type | protein-coding | GO ID | GO:0001501 | UniProtAcc | A0A024R7F8 |
Top |
Malignant transformation analysis |
| Identification of the aberrant gene expression in precancerous and cancerous lesions by comparing the gene expression of stem-like cells in diseased tissues with normal stem cells |
| Entrez ID | Symbol | Replicates | Species | Organ | Tissue | Adj P-value | Log2FC | Malignancy |
| 54 | ACP5 | LZE4T | Human | Esophagus | ESCC | 1.01e-23 | 6.63e-01 | 0.0811 |
| 54 | ACP5 | LZE7T | Human | Esophagus | ESCC | 1.64e-08 | 5.31e-01 | 0.0667 |
| 54 | ACP5 | LZE8T | Human | Esophagus | ESCC | 2.45e-02 | 5.36e-01 | 0.067 |
| 54 | ACP5 | LZE22T | Human | Esophagus | ESCC | 3.43e-04 | 2.34e-01 | 0.068 |
| 54 | ACP5 | LZE24T | Human | Esophagus | ESCC | 9.59e-04 | 1.17e-01 | 0.0596 |
| 54 | ACP5 | LZE6T | Human | Esophagus | ESCC | 1.09e-07 | 5.64e-01 | 0.0845 |
| 54 | ACP5 | P1T-E | Human | Esophagus | ESCC | 1.76e-02 | 3.57e-01 | 0.0875 |
| 54 | ACP5 | P2T-E | Human | Esophagus | ESCC | 4.09e-04 | 7.69e-04 | 0.1177 |
| 54 | ACP5 | P4T-E | Human | Esophagus | ESCC | 8.59e-17 | 5.01e-01 | 0.1323 |
| 54 | ACP5 | P5T-E | Human | Esophagus | ESCC | 2.69e-14 | 4.34e-01 | 0.1327 |
| 54 | ACP5 | P8T-E | Human | Esophagus | ESCC | 1.27e-14 | 3.60e-01 | 0.0889 |
| 54 | ACP5 | P9T-E | Human | Esophagus | ESCC | 3.44e-23 | 7.30e-01 | 0.1131 |
| 54 | ACP5 | P10T-E | Human | Esophagus | ESCC | 6.91e-14 | 4.04e-01 | 0.116 |
| 54 | ACP5 | P11T-E | Human | Esophagus | ESCC | 9.04e-12 | 8.28e-01 | 0.1426 |
| 54 | ACP5 | P12T-E | Human | Esophagus | ESCC | 7.14e-10 | 1.32e-01 | 0.1122 |
| 54 | ACP5 | P15T-E | Human | Esophagus | ESCC | 2.55e-21 | 4.65e-01 | 0.1149 |
| 54 | ACP5 | P16T-E | Human | Esophagus | ESCC | 2.80e-18 | 2.36e-01 | 0.1153 |
| 54 | ACP5 | P17T-E | Human | Esophagus | ESCC | 2.72e-08 | 3.55e-01 | 0.1278 |
| 54 | ACP5 | P19T-E | Human | Esophagus | ESCC | 2.64e-02 | 9.45e-01 | 0.1662 |
| 54 | ACP5 | P20T-E | Human | Esophagus | ESCC | 1.23e-06 | 1.46e-01 | 0.1124 |
| Page: 1 2 3 4 5 |
| Tissue | Expression Dynamics | Abbreviation |
| Esophagus | 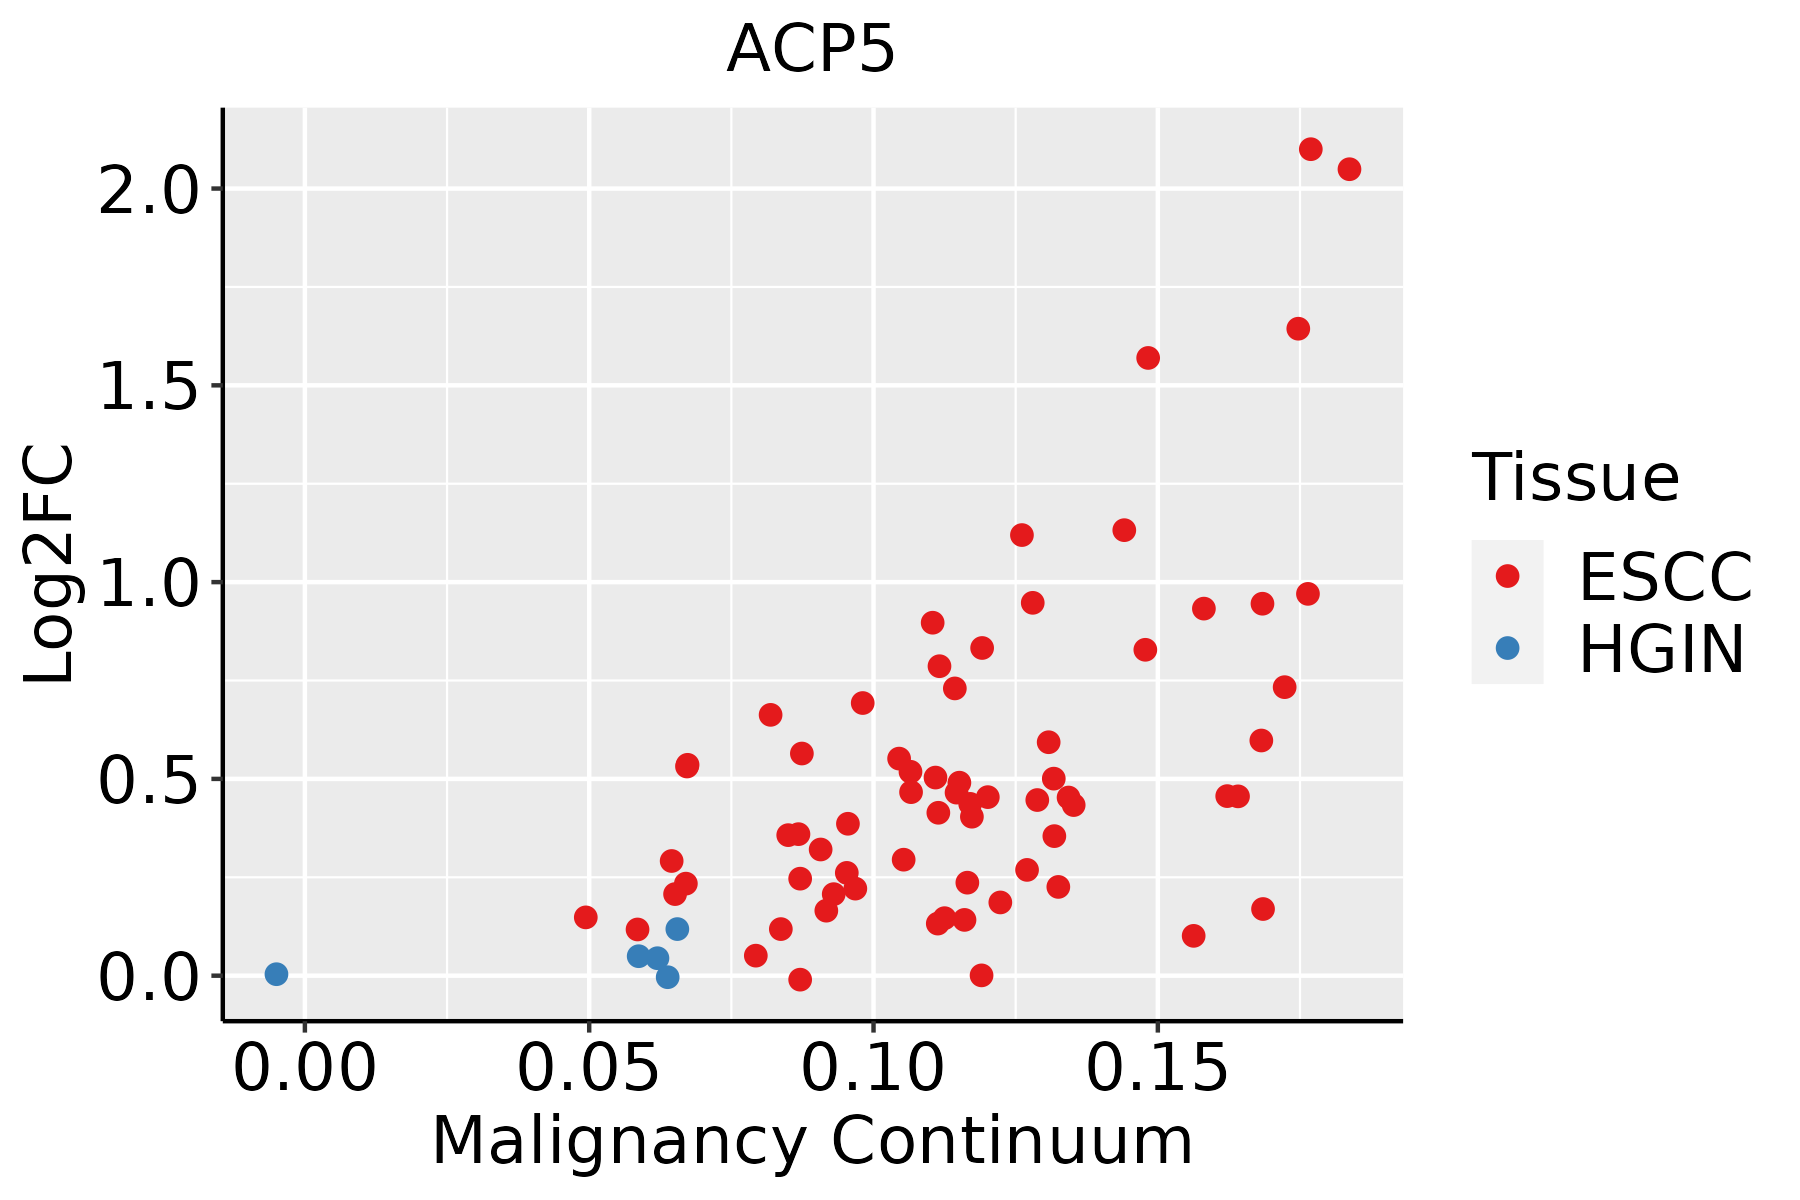 | ESCC: Esophageal squamous cell carcinoma |
| HGIN: High-grade intraepithelial neoplasias | ||
| LGIN: Low-grade intraepithelial neoplasias | ||
| Liver |  | HCC: Hepatocellular carcinoma |
| NAFLD: Non-alcoholic fatty liver disease | ||
| Oral Cavity | 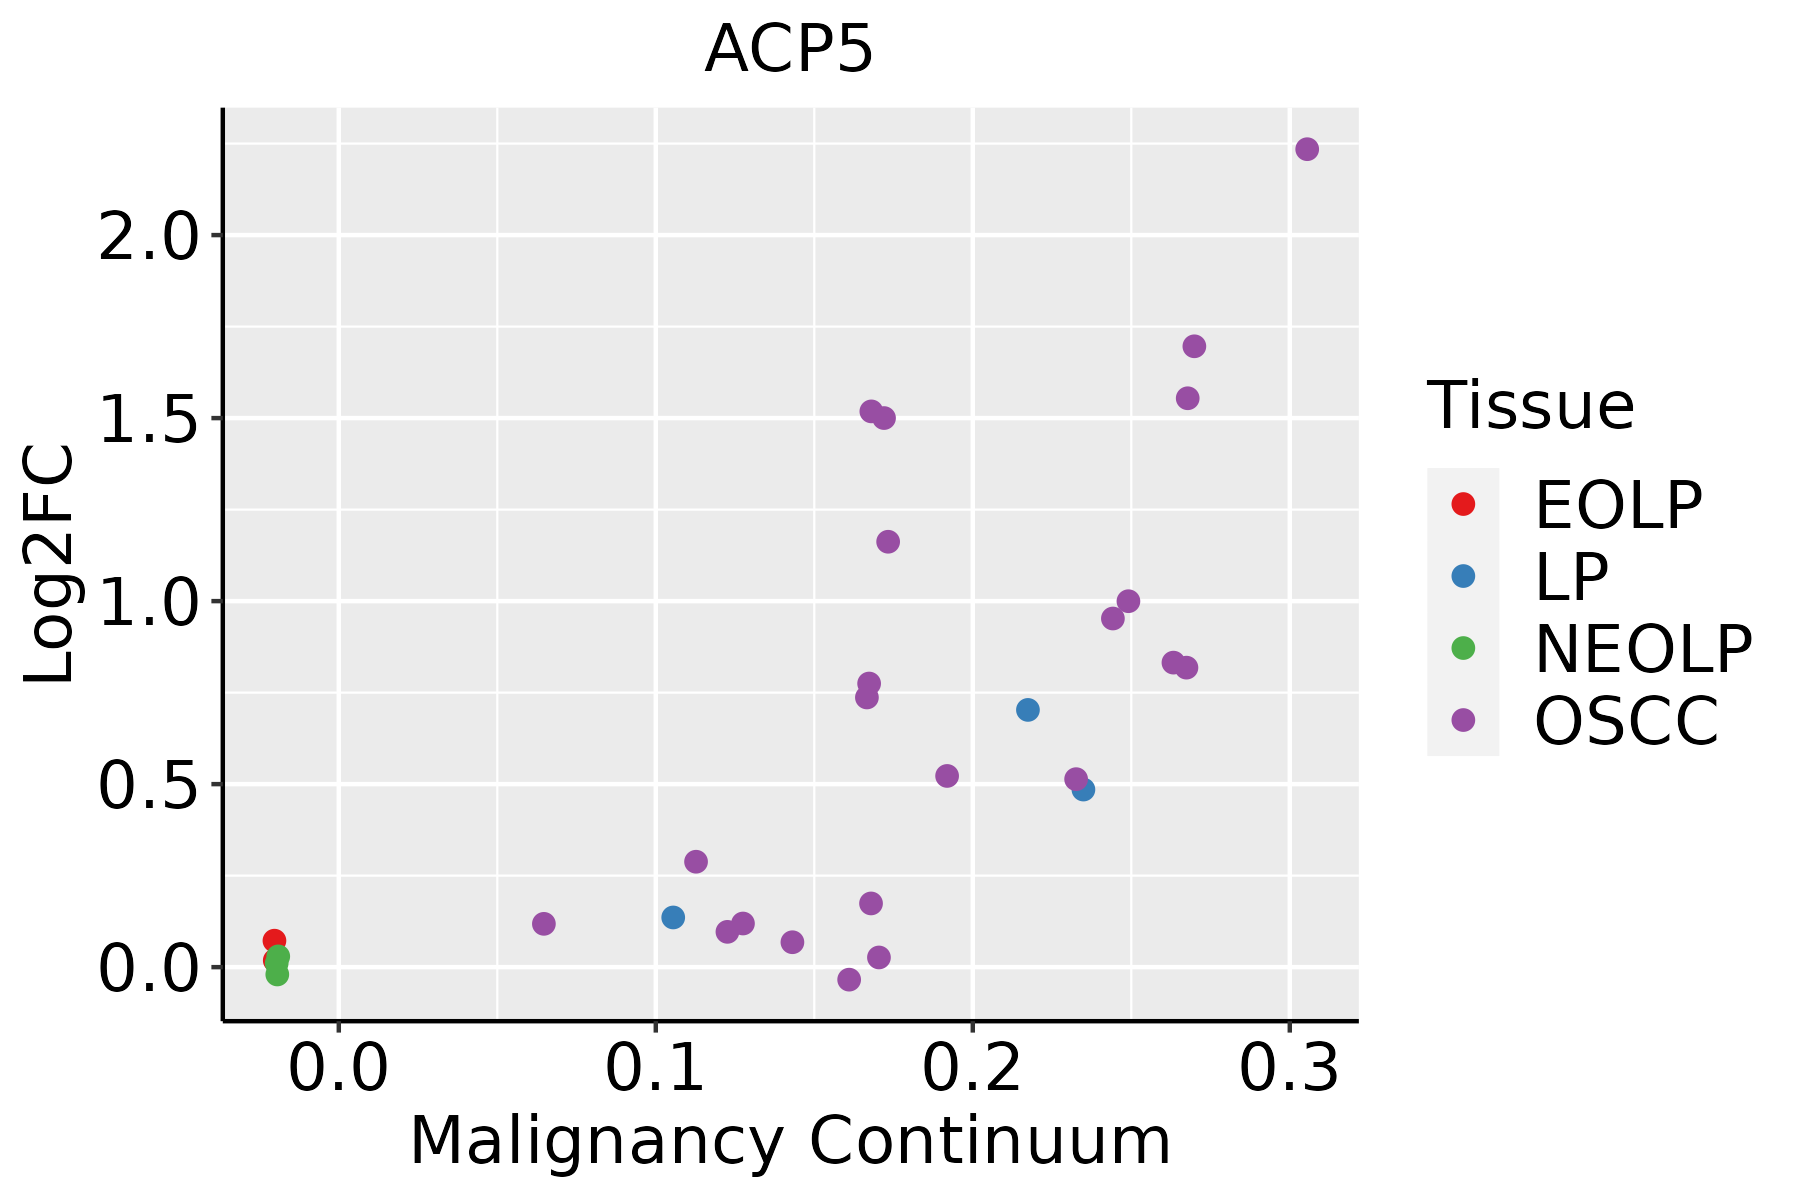 | EOLP: Erosive Oral lichen planus |
| LP: leukoplakia | ||
| NEOLP: Non-erosive oral lichen planus | ||
| OSCC: Oral squamous cell carcinoma |
| ∗log2FC in expression of this searched gene in stem-like cells from each diseased tissue sample relative to stem-like cells in normal samples in each tissue plotted against the malignancy continuum. Samples are colored based on if they are from different disease stage. |
Top |
Malignant transformation related pathway analysis |
| Find out the enriched GO biological processes and KEGG pathways involved in transition from healthy to precancer to cancer |
| Tissue | Disease Stage | Enriched GO biological Processes |
| Colorectum | AD |  |
| Colorectum | SER |  |
| Colorectum | MSS |  |
| Colorectum | MSI-H |  |
| Colorectum | FAP |  |
| ∗Top 15 enriched GO BP terms are showed in the bar plot of each disease state in each tissue. Each row represents a significant GO biological process which is colored according to the -log10(p.adjust). |
| Page: 1 2 3 4 5 6 7 8 9 |
| GO ID | Tissue | Disease Stage | Description | Gene Ratio | Bg Ratio | pvalue | p.adjust | Count |
| GO:001631110 | Esophagus | ESCC | dephosphorylation | 251/8552 | 417/18723 | 1.26e-09 | 2.99e-08 | 251 |
| GO:200037718 | Esophagus | ESCC | regulation of reactive oxygen species metabolic process | 100/8552 | 157/18723 | 3.87e-06 | 4.17e-05 | 100 |
| GO:003249619 | Esophagus | ESCC | response to lipopolysaccharide | 191/8552 | 343/18723 | 1.11e-04 | 7.73e-04 | 191 |
| GO:007259318 | Esophagus | ESCC | reactive oxygen species metabolic process | 137/8552 | 239/18723 | 1.82e-04 | 1.16e-03 | 137 |
| GO:000223719 | Esophagus | ESCC | response to molecule of bacterial origin | 194/8552 | 363/18723 | 1.64e-03 | 7.61e-03 | 194 |
| GO:00603485 | Esophagus | ESCC | bone development | 115/8552 | 205/18723 | 1.67e-03 | 7.72e-03 | 115 |
| GO:20003783 | Esophagus | ESCC | negative regulation of reactive oxygen species metabolic process | 34/8552 | 52/18723 | 3.26e-03 | 1.35e-02 | 34 |
| GO:000680917 | Esophagus | ESCC | nitric oxide biosynthetic process | 47/8552 | 76/18723 | 3.29e-03 | 1.35e-02 | 47 |
| GO:200105717 | Esophagus | ESCC | reactive nitrogen species metabolic process | 50/8552 | 82/18723 | 3.76e-03 | 1.53e-02 | 50 |
| GO:00487052 | Esophagus | ESCC | skeletal system morphogenesis | 120/8552 | 220/18723 | 4.90e-03 | 1.89e-02 | 120 |
| GO:004620917 | Esophagus | ESCC | nitric oxide metabolic process | 49/8552 | 81/18723 | 5.11e-03 | 1.93e-02 | 49 |
| GO:200037712 | Liver | Cirrhotic | regulation of reactive oxygen species metabolic process | 67/4634 | 157/18723 | 6.07e-07 | 1.32e-05 | 67 |
| GO:00725937 | Liver | Cirrhotic | reactive oxygen species metabolic process | 92/4634 | 239/18723 | 1.57e-06 | 3.03e-05 | 92 |
| GO:200105712 | Liver | Cirrhotic | reactive nitrogen species metabolic process | 34/4634 | 82/18723 | 6.36e-04 | 4.85e-03 | 34 |
| GO:00324966 | Liver | Cirrhotic | response to lipopolysaccharide | 111/4634 | 343/18723 | 8.15e-04 | 5.95e-03 | 111 |
| GO:004620912 | Liver | Cirrhotic | nitric oxide metabolic process | 33/4634 | 81/18723 | 1.09e-03 | 7.59e-03 | 33 |
| GO:000680912 | Liver | Cirrhotic | nitric oxide biosynthetic process | 31/4634 | 76/18723 | 1.49e-03 | 9.87e-03 | 31 |
| GO:001631111 | Liver | Cirrhotic | dephosphorylation | 130/4634 | 417/18723 | 1.58e-03 | 1.03e-02 | 130 |
| GO:004542812 | Liver | Cirrhotic | regulation of nitric oxide biosynthetic process | 26/4634 | 62/18723 | 2.18e-03 | 1.34e-02 | 26 |
| GO:00487711 | Liver | Cirrhotic | tissue remodeling | 60/4634 | 175/18723 | 2.86e-03 | 1.65e-02 | 60 |
| Page: 1 2 3 |
| Pathway ID | Tissue | Disease Stage | Description | Gene Ratio | Bg Ratio | pvalue | p.adjust | qvalue | Count |
| hsa0414222 | Esophagus | ESCC | Lysosome | 102/4205 | 132/8465 | 5.11e-11 | 7.13e-10 | 3.65e-10 | 102 |
| hsa0532320 | Esophagus | ESCC | Rheumatoid arthritis | 59/4205 | 93/8465 | 4.98e-03 | 1.27e-02 | 6.52e-03 | 59 |
| hsa0414232 | Esophagus | ESCC | Lysosome | 102/4205 | 132/8465 | 5.11e-11 | 7.13e-10 | 3.65e-10 | 102 |
| hsa05323110 | Esophagus | ESCC | Rheumatoid arthritis | 59/4205 | 93/8465 | 4.98e-03 | 1.27e-02 | 6.52e-03 | 59 |
| hsa041424 | Liver | Cirrhotic | Lysosome | 68/2530 | 132/8465 | 1.34e-07 | 1.97e-06 | 1.21e-06 | 68 |
| hsa0532310 | Liver | Cirrhotic | Rheumatoid arthritis | 38/2530 | 93/8465 | 1.52e-02 | 4.57e-02 | 2.82e-02 | 38 |
| hsa0414211 | Liver | Cirrhotic | Lysosome | 68/2530 | 132/8465 | 1.34e-07 | 1.97e-06 | 1.21e-06 | 68 |
| hsa0532311 | Liver | Cirrhotic | Rheumatoid arthritis | 38/2530 | 93/8465 | 1.52e-02 | 4.57e-02 | 2.82e-02 | 38 |
| hsa041422 | Liver | HCC | Lysosome | 100/4020 | 132/8465 | 2.32e-11 | 4.31e-10 | 2.40e-10 | 100 |
| hsa041423 | Liver | HCC | Lysosome | 100/4020 | 132/8465 | 2.32e-11 | 4.31e-10 | 2.40e-10 | 100 |
| hsa041425 | Oral cavity | OSCC | Lysosome | 87/3704 | 132/8465 | 1.97e-07 | 1.35e-06 | 6.86e-07 | 87 |
| hsa0414212 | Oral cavity | OSCC | Lysosome | 87/3704 | 132/8465 | 1.97e-07 | 1.35e-06 | 6.86e-07 | 87 |
| Page: 1 |
Top |
Cell-cell communication analysis |
| Identification of potential cell-cell interactions between two cell types and their ligand-receptor pairs for different disease states |
| Ligand | Receptor | LRpair | Pathway | Tissue | Disease Stage |
| Page: 1 |
Top |
Single-cell gene regulatory network inference analysis |
| Find out the significant the regulons (TFs) and the target genes of each regulon across cell types for different disease states |
| TF | Cell Type | Tissue | Disease Stage | Target Gene | RSS | Regulon Activity |
| ∗The dot plots of a searched regulon are shown for all cell subpopulations in each disease state of each tissue based on the regulon specific score inferred using pySCENIC and by calculating the average expression. |
| Page: 1 |
Top |
Somatic mutation of malignant transformation related genes |
| Annotation of somatic variants for genes involved in malignant transformation |
| Hugo Symbol | Variant Class | Variant Classification | dbSNP RS | HGVSc | HGVSp | HGVSp Short | SWISSPROT | BIOTYPE | SIFT | PolyPhen | Tumor Sample Barcode | Tissue | Histology | Sex | Age | Stage | Therapy Types | Drugs | Outcome |
| ACP5 | SNV | Missense_Mutation | c.519N>T | p.Glu173Asp | p.E173D | P13686 | protein_coding | tolerated(0.39) | benign(0) | TCGA-A2-A0EY-01 | Breast | breast invasive carcinoma | Female | <65 | I/II | Chemotherapy | adriamycin | SD | |
| ACP5 | SNV | Missense_Mutation | rs765343526 | c.385N>T | p.Arg129Cys | p.R129C | P13686 | protein_coding | deleterious(0) | probably_damaging(1) | TCGA-A7-A13E-01 | Breast | breast invasive carcinoma | Female | <65 | I/II | Targeted Molecular therapy | bevacizumab | PD |
| ACP5 | SNV | Missense_Mutation | c.742N>G | p.Gln248Glu | p.Q248E | P13686 | protein_coding | tolerated(0.25) | benign(0.005) | TCGA-AO-A0J6-01 | Breast | breast invasive carcinoma | Female | <65 | I/II | Chemotherapy | doxorubicin | SD | |
| ACP5 | SNV | Missense_Mutation | novel | c.329A>G | p.Asn110Ser | p.N110S | P13686 | protein_coding | deleterious(0.01) | probably_damaging(0.998) | TCGA-C8-A12Q-01 | Breast | breast invasive carcinoma | Female | >=65 | III/IV | Unknown | Unknown | PD |
| ACP5 | insertion | Frame_Shift_Ins | novel | c.741_742insGAAGGGGAAACACAGCTGATGAACT | p.Gln248GlufsTer11 | p.Q248Efs*11 | P13686 | protein_coding | TCGA-A8-A06O-01 | Breast | breast invasive carcinoma | Female | <65 | I/II | Hormone Therapy | letrozole | SD | ||
| ACP5 | insertion | In_Frame_Ins | novel | c.821_822insTATGTTCTCCTGGTTAGAGTGGCTGGGCTC | p.Val274_Pro275insMetPheSerTrpLeuGluTrpLeuGlySer | p.V274_P275insMFSWLEWLGS | P13686 | protein_coding | TCGA-A8-A094-01 | Breast | breast invasive carcinoma | Female | >=65 | I/II | Unknown | Unknown | SD | ||
| ACP5 | SNV | Missense_Mutation | c.856N>A | p.Glu286Lys | p.E286K | P13686 | protein_coding | tolerated(0.89) | benign(0.003) | TCGA-C5-A1BN-01 | Cervix | cervical & endocervical cancer | Female | <65 | I/II | Chemotherapy | cisplatin | PD | |
| ACP5 | SNV | Missense_Mutation | rs745604493 | c.959N>T | p.Pro320Leu | p.P320L | P13686 | protein_coding | tolerated(0.06) | benign(0.023) | TCGA-A6-6781-01 | Colorectum | colon adenocarcinoma | Male | <65 | III/IV | Chemotherapy | oxaliplatin | SD |
| ACP5 | SNV | Missense_Mutation | c.167G>A | p.Arg56Gln | p.R56Q | P13686 | protein_coding | tolerated(0.19) | benign(0.05) | TCGA-AA-3977-01 | Colorectum | colon adenocarcinoma | Male | >=65 | I/II | Unknown | Unknown | SD | |
| ACP5 | SNV | Missense_Mutation | c.841N>C | p.Phe281Leu | p.F281L | P13686 | protein_coding | deleterious(0) | probably_damaging(0.942) | TCGA-AA-A02R-01 | Colorectum | colon adenocarcinoma | Female | >=65 | I/II | Unknown | Unknown | PD |
| Page: 1 2 3 4 5 |
Top |
Related drugs of malignant transformation related genes |
| Identification of chemicals and drugs interact with genes involved in malignant transfromation |
| (DGIdb 4.0) |
| Entrez ID | Symbol | Category | Interaction Types | Drug Claim Name | Drug Name | PMIDs |
| 54 | ACP5 | ENZYME, DRUGGABLE GENOME | STREPTOZOTOCIN | STREPTOZOCIN | 14640894 | |
| 54 | ACP5 | ENZYME, DRUGGABLE GENOME | G-CSF | FILGRASTIM | 1724107 | |
| 54 | ACP5 | ENZYME, DRUGGABLE GENOME | ANALGESICS | 12521129 | ||
| 54 | ACP5 | ENZYME, DRUGGABLE GENOME | TPA | ALTEPLASE | 1436243 | |
| 54 | ACP5 | ENZYME, DRUGGABLE GENOME | M-CSF | CILMOSTIM | 12390325 |
| Page: 1 |

Copyright 2023-Present -The University of Texas Health Science Center at Houston |