
|
|||||
|
 | |
| |
| |
| |
| |
| |
|
Gene: ACP2 |
Gene summary for ACP2 |
| Gene information | Species | Human | Gene symbol | ACP2 | Gene ID | 53 |
| Gene name | acid phosphatase 2, lysosomal | |
| Gene Alias | LAP | |
| Cytomap | 11p11.2 | |
| Gene Type | protein-coding | GO ID | GO:0006793 | UniProtAcc | B7Z552 |
Top |
Malignant transformation analysis |
| Identification of the aberrant gene expression in precancerous and cancerous lesions by comparing the gene expression of stem-like cells in diseased tissues with normal stem cells |
| Entrez ID | Symbol | Replicates | Species | Organ | Tissue | Adj P-value | Log2FC | Malignancy |
| 53 | ACP2 | LZE4T | Human | Esophagus | ESCC | 4.90e-06 | 9.75e-02 | 0.0811 |
| 53 | ACP2 | LZE8T | Human | Esophagus | ESCC | 2.29e-04 | 1.58e-01 | 0.067 |
| 53 | ACP2 | LZE24T | Human | Esophagus | ESCC | 2.41e-08 | 3.20e-01 | 0.0596 |
| 53 | ACP2 | P2T-E | Human | Esophagus | ESCC | 1.96e-29 | 4.14e-01 | 0.1177 |
| 53 | ACP2 | P4T-E | Human | Esophagus | ESCC | 3.42e-21 | 3.10e-01 | 0.1323 |
| 53 | ACP2 | P5T-E | Human | Esophagus | ESCC | 9.18e-04 | 1.19e-02 | 0.1327 |
| 53 | ACP2 | P8T-E | Human | Esophagus | ESCC | 1.67e-32 | 5.09e-01 | 0.0889 |
| 53 | ACP2 | P9T-E | Human | Esophagus | ESCC | 4.85e-07 | 2.44e-01 | 0.1131 |
| 53 | ACP2 | P10T-E | Human | Esophagus | ESCC | 8.09e-13 | 8.19e-02 | 0.116 |
| 53 | ACP2 | P11T-E | Human | Esophagus | ESCC | 3.21e-11 | 5.20e-01 | 0.1426 |
| 53 | ACP2 | P12T-E | Human | Esophagus | ESCC | 5.98e-18 | 2.99e-01 | 0.1122 |
| 53 | ACP2 | P15T-E | Human | Esophagus | ESCC | 9.13e-17 | 3.65e-01 | 0.1149 |
| 53 | ACP2 | P16T-E | Human | Esophagus | ESCC | 9.34e-16 | 2.61e-01 | 0.1153 |
| 53 | ACP2 | P17T-E | Human | Esophagus | ESCC | 3.97e-06 | 3.91e-01 | 0.1278 |
| 53 | ACP2 | P19T-E | Human | Esophagus | ESCC | 1.55e-06 | 2.80e-01 | 0.1662 |
| 53 | ACP2 | P20T-E | Human | Esophagus | ESCC | 8.39e-08 | 1.74e-01 | 0.1124 |
| 53 | ACP2 | P21T-E | Human | Esophagus | ESCC | 2.56e-27 | 4.34e-01 | 0.1617 |
| 53 | ACP2 | P22T-E | Human | Esophagus | ESCC | 4.40e-15 | 1.25e-01 | 0.1236 |
| 53 | ACP2 | P23T-E | Human | Esophagus | ESCC | 3.33e-17 | 3.79e-01 | 0.108 |
| 53 | ACP2 | P24T-E | Human | Esophagus | ESCC | 8.45e-13 | 2.64e-01 | 0.1287 |
| Page: 1 2 3 4 5 6 |
| Tissue | Expression Dynamics | Abbreviation |
| Esophagus | 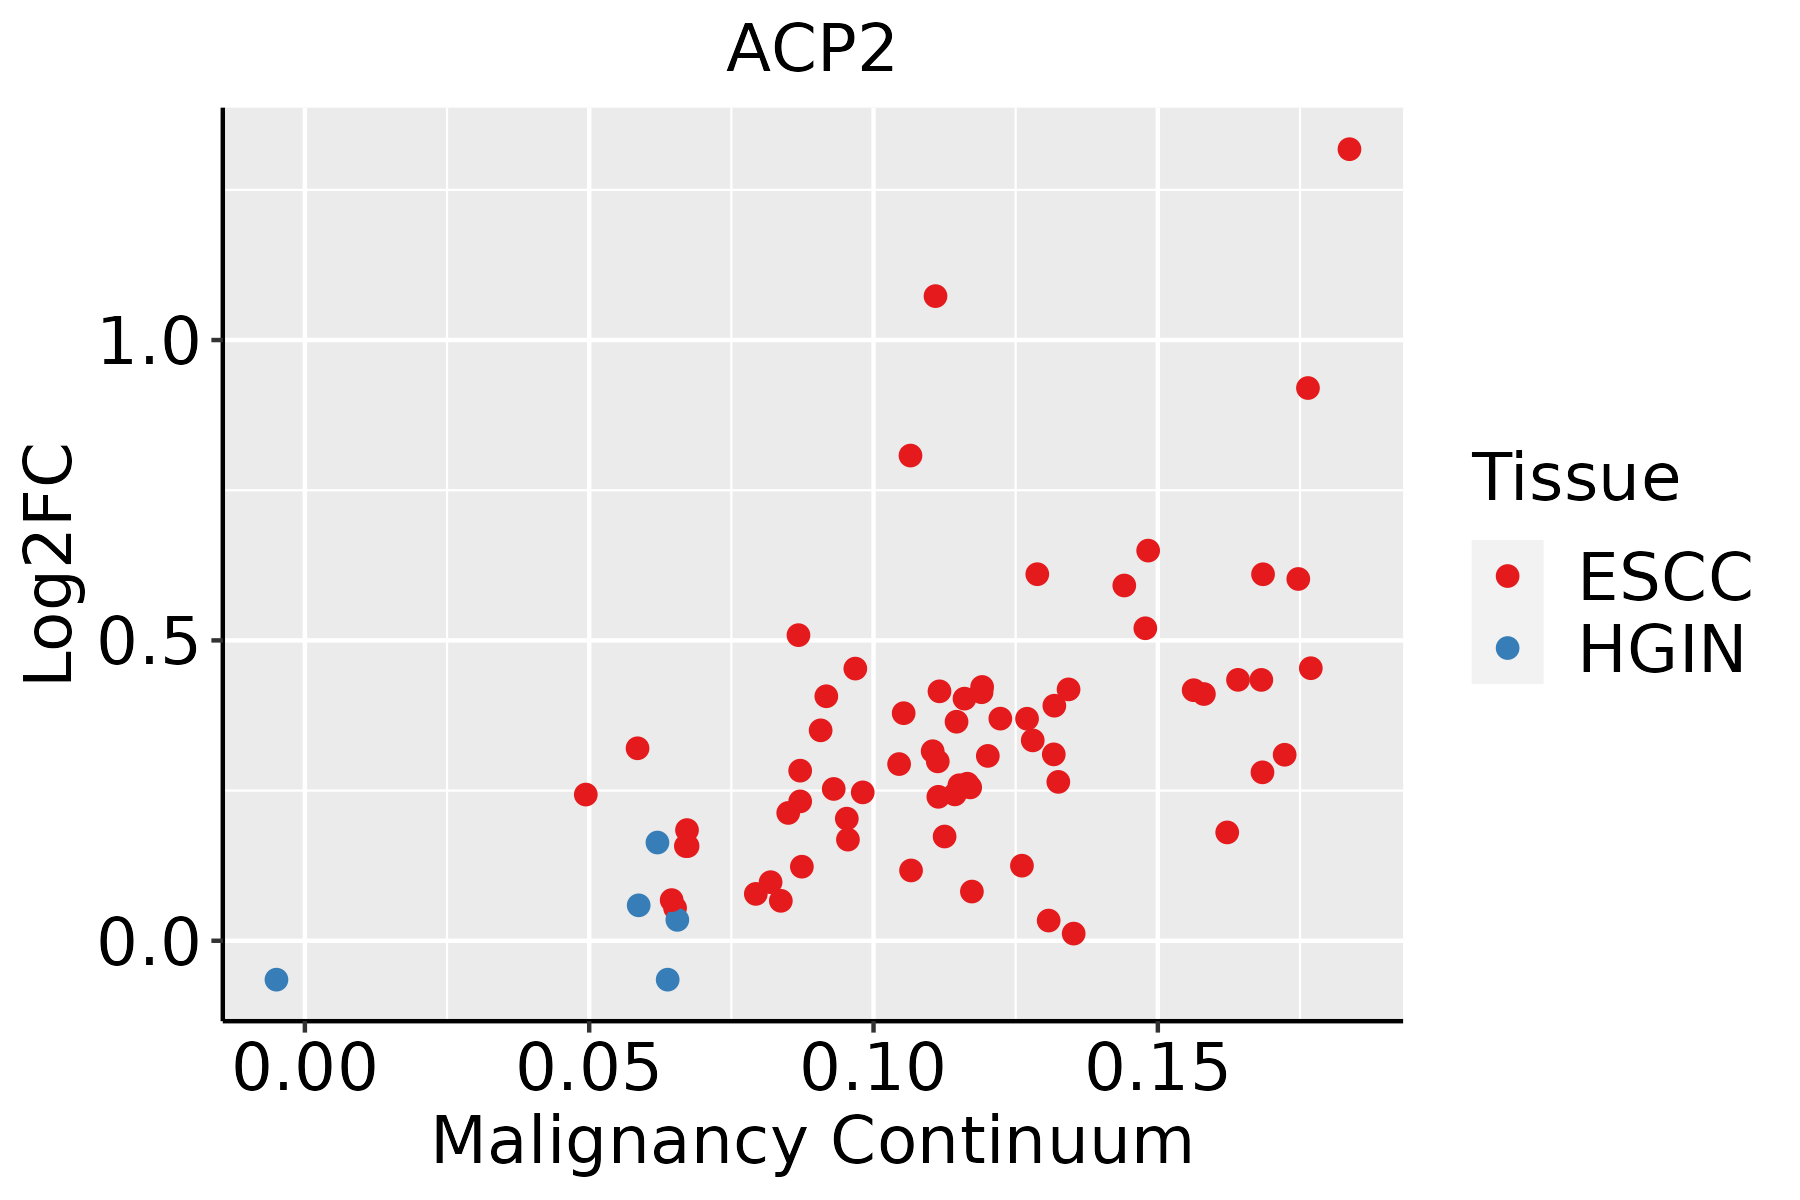 | ESCC: Esophageal squamous cell carcinoma |
| HGIN: High-grade intraepithelial neoplasias | ||
| LGIN: Low-grade intraepithelial neoplasias | ||
| Liver | 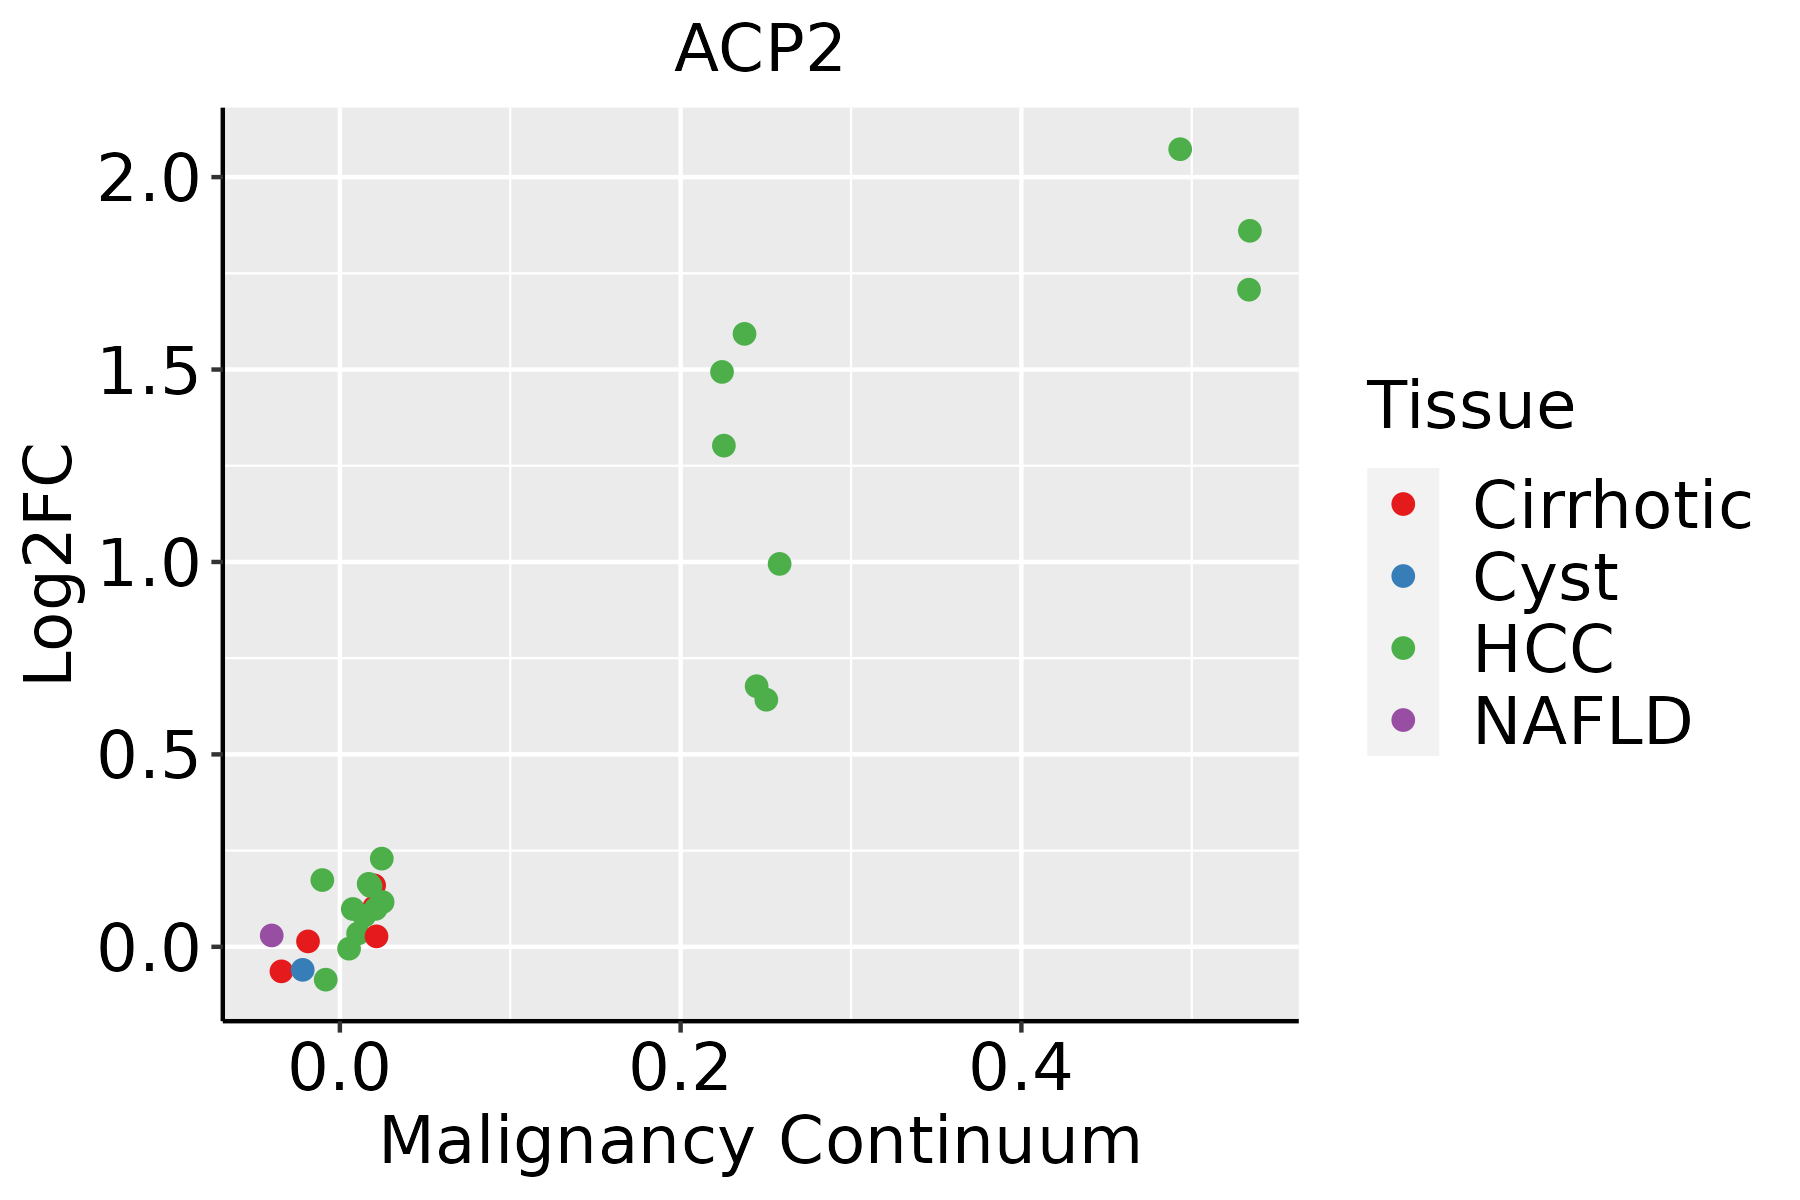 | HCC: Hepatocellular carcinoma |
| NAFLD: Non-alcoholic fatty liver disease | ||
| Oral Cavity | 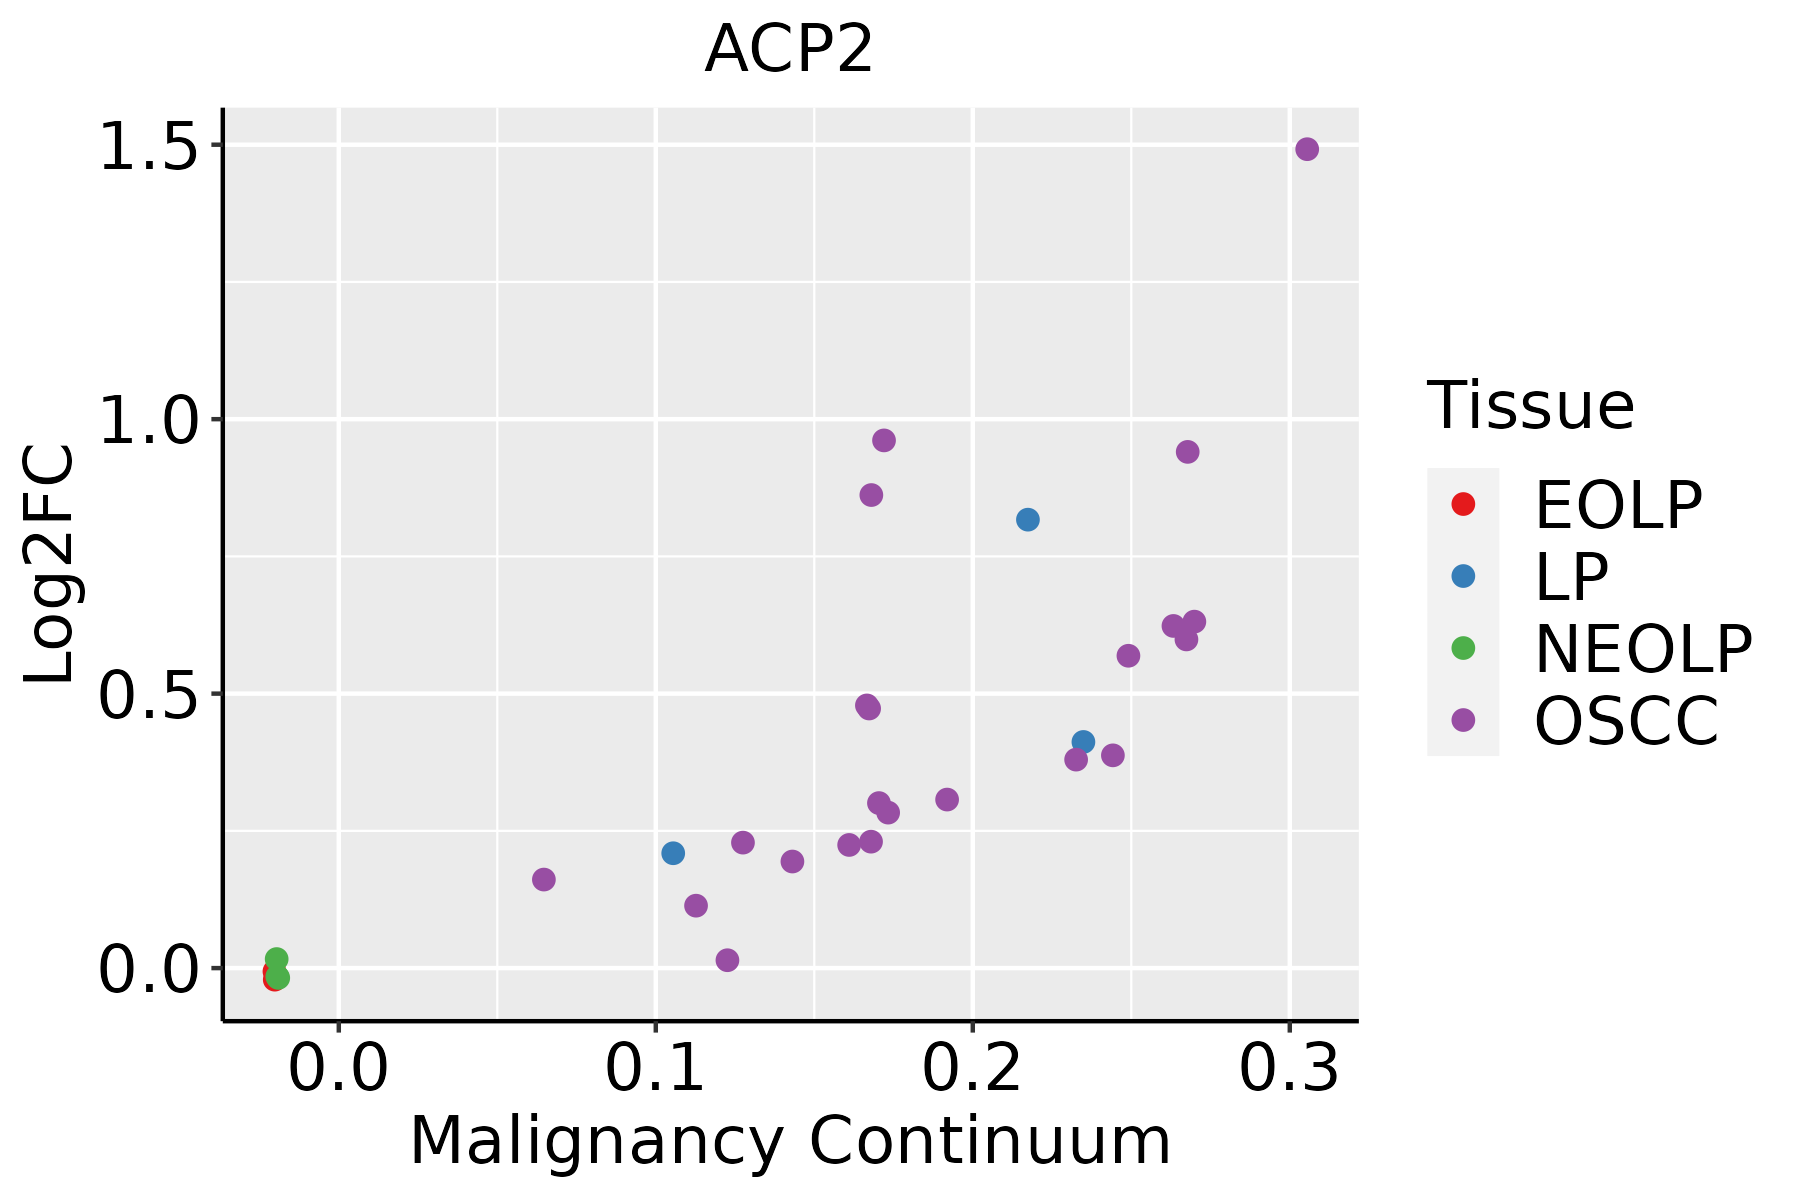 | EOLP: Erosive Oral lichen planus |
| LP: leukoplakia | ||
| NEOLP: Non-erosive oral lichen planus | ||
| OSCC: Oral squamous cell carcinoma | ||
| Skin |  | AK: Actinic keratosis |
| cSCC: Cutaneous squamous cell carcinoma | ||
| SCCIS:squamous cell carcinoma in situ | ||
| Thyroid | 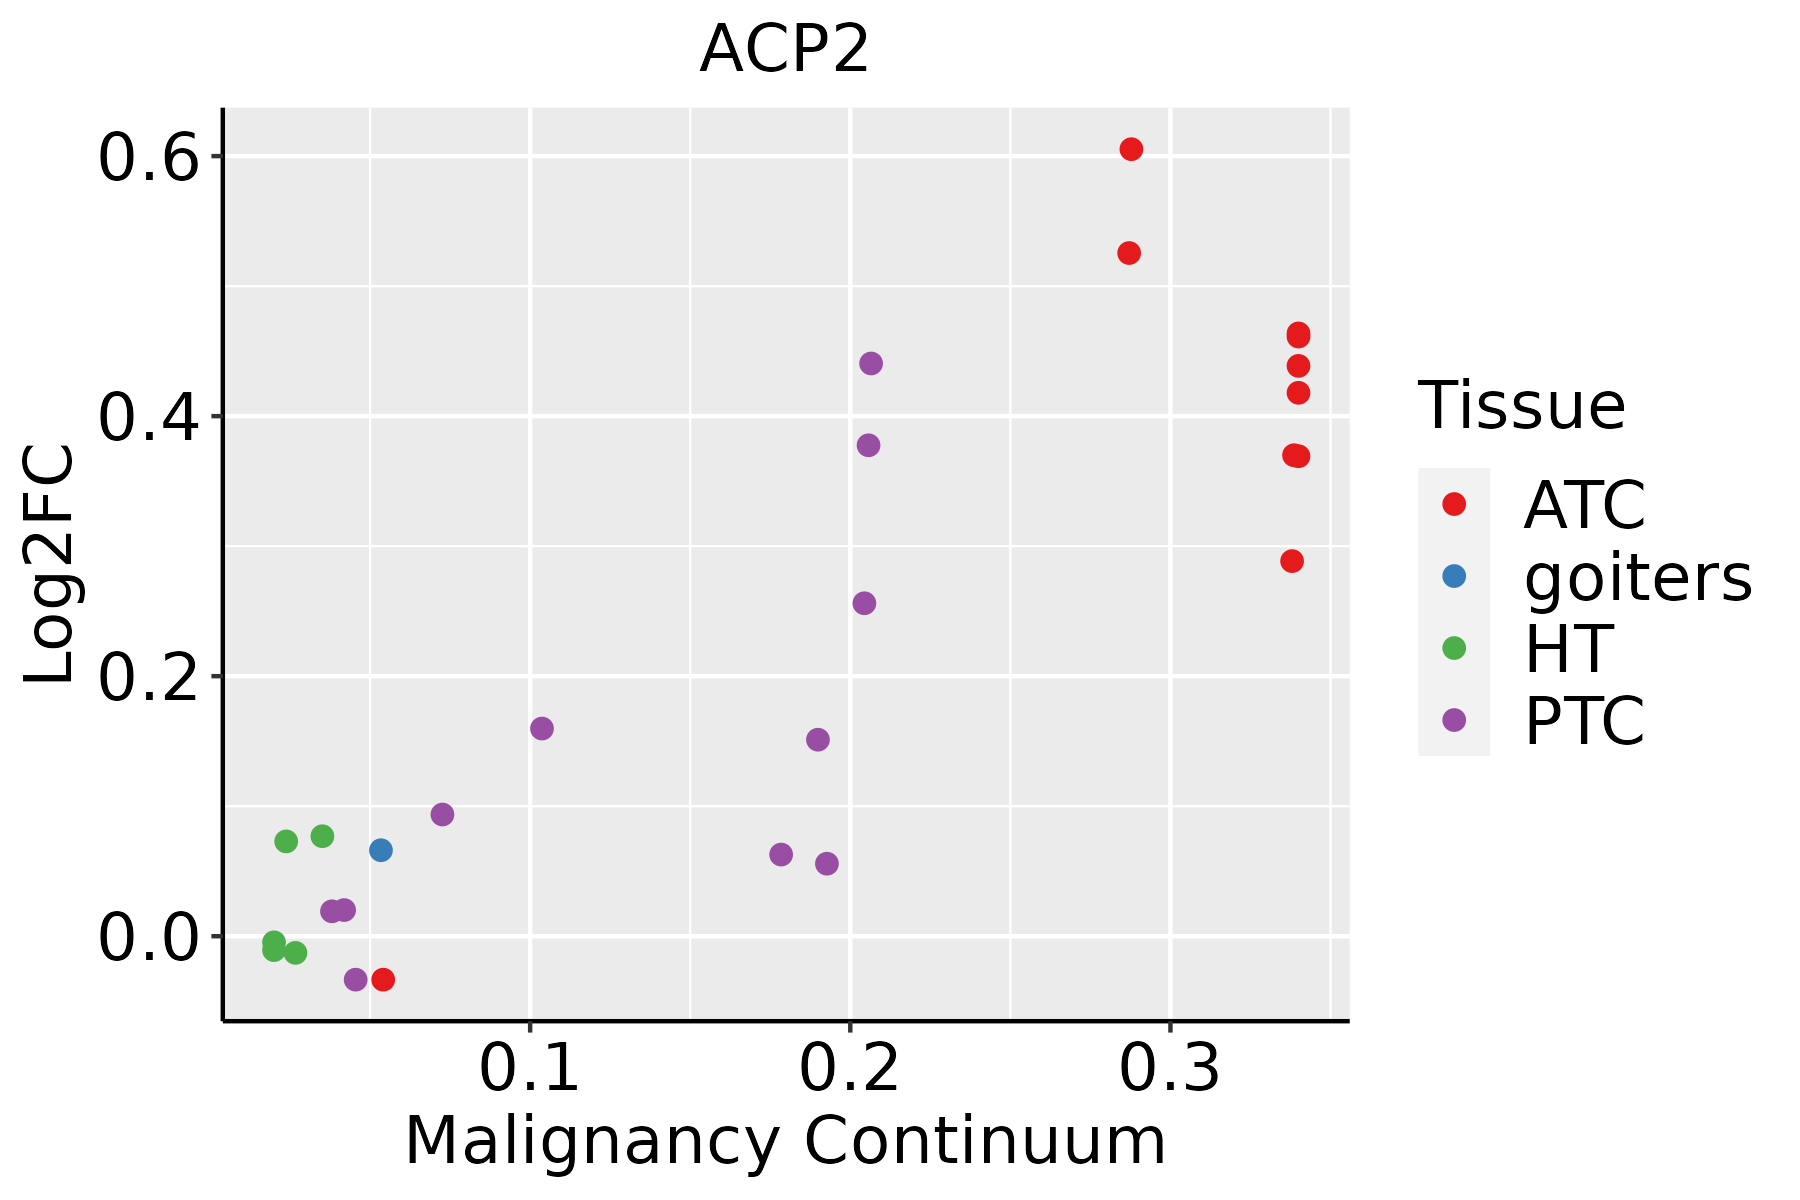 | ATC: Anaplastic thyroid cancer |
| HT: Hashimoto's thyroiditis | ||
| PTC: Papillary thyroid cancer |
| ∗log2FC in expression of this searched gene in stem-like cells from each diseased tissue sample relative to stem-like cells in normal samples in each tissue plotted against the malignancy continuum. Samples are colored based on if they are from different disease stage. |
Top |
Malignant transformation related pathway analysis |
| Find out the enriched GO biological processes and KEGG pathways involved in transition from healthy to precancer to cancer |
| Tissue | Disease Stage | Enriched GO biological Processes |
| Colorectum | AD |  |
| Colorectum | SER |  |
| Colorectum | MSS |  |
| Colorectum | MSI-H |  |
| Colorectum | FAP |  |
| ∗Top 15 enriched GO BP terms are showed in the bar plot of each disease state in each tissue. Each row represents a significant GO biological process which is colored according to the -log10(p.adjust). |
| Page: 1 2 3 4 5 6 7 8 9 |
| GO ID | Tissue | Disease Stage | Description | Gene Ratio | Bg Ratio | pvalue | p.adjust | Count |
| GO:000703314 | Esophagus | ESCC | vacuole organization | 127/8552 | 180/18723 | 1.04e-11 | 3.85e-10 | 127 |
| GO:001631110 | Esophagus | ESCC | dephosphorylation | 251/8552 | 417/18723 | 1.26e-09 | 2.99e-08 | 251 |
| GO:00070403 | Esophagus | ESCC | lysosome organization | 53/8552 | 74/18723 | 5.34e-06 | 5.57e-05 | 53 |
| GO:00801713 | Esophagus | ESCC | lytic vacuole organization | 53/8552 | 74/18723 | 5.34e-06 | 5.57e-05 | 53 |
| GO:00070332 | Liver | Cirrhotic | vacuole organization | 80/4634 | 180/18723 | 5.73e-09 | 2.25e-07 | 80 |
| GO:0007040 | Liver | Cirrhotic | lysosome organization | 35/4634 | 74/18723 | 2.10e-05 | 2.77e-04 | 35 |
| GO:0080171 | Liver | Cirrhotic | lytic vacuole organization | 35/4634 | 74/18723 | 2.10e-05 | 2.77e-04 | 35 |
| GO:001631111 | Liver | Cirrhotic | dephosphorylation | 130/4634 | 417/18723 | 1.58e-03 | 1.03e-02 | 130 |
| GO:000703311 | Liver | HCC | vacuole organization | 119/7958 | 180/18723 | 1.22e-10 | 4.25e-09 | 119 |
| GO:001631121 | Liver | HCC | dephosphorylation | 230/7958 | 417/18723 | 1.00e-07 | 1.96e-06 | 230 |
| GO:00070401 | Liver | HCC | lysosome organization | 47/7958 | 74/18723 | 2.13e-04 | 1.63e-03 | 47 |
| GO:00801711 | Liver | HCC | lytic vacuole organization | 47/7958 | 74/18723 | 2.13e-04 | 1.63e-03 | 47 |
| GO:00070335 | Oral cavity | OSCC | vacuole organization | 115/7305 | 180/18723 | 1.11e-11 | 4.00e-10 | 115 |
| GO:00163119 | Oral cavity | OSCC | dephosphorylation | 220/7305 | 417/18723 | 6.33e-09 | 1.34e-07 | 220 |
| GO:00070402 | Oral cavity | OSCC | lysosome organization | 51/7305 | 74/18723 | 1.77e-07 | 2.87e-06 | 51 |
| GO:00801712 | Oral cavity | OSCC | lytic vacuole organization | 51/7305 | 74/18723 | 1.77e-07 | 2.87e-06 | 51 |
| GO:00070337 | Skin | cSCC | vacuole organization | 77/4864 | 180/18723 | 6.65e-07 | 1.26e-05 | 77 |
| GO:001631115 | Skin | cSCC | dephosphorylation | 134/4864 | 417/18723 | 2.65e-03 | 1.50e-02 | 134 |
| GO:00070404 | Skin | cSCC | lysosome organization | 30/4864 | 74/18723 | 4.32e-03 | 2.27e-02 | 30 |
| GO:00801714 | Skin | cSCC | lytic vacuole organization | 30/4864 | 74/18723 | 4.32e-03 | 2.27e-02 | 30 |
| Page: 1 2 |
| Pathway ID | Tissue | Disease Stage | Description | Gene Ratio | Bg Ratio | pvalue | p.adjust | qvalue | Count |
| hsa0414222 | Esophagus | ESCC | Lysosome | 102/4205 | 132/8465 | 5.11e-11 | 7.13e-10 | 3.65e-10 | 102 |
| hsa0414232 | Esophagus | ESCC | Lysosome | 102/4205 | 132/8465 | 5.11e-11 | 7.13e-10 | 3.65e-10 | 102 |
| hsa041424 | Liver | Cirrhotic | Lysosome | 68/2530 | 132/8465 | 1.34e-07 | 1.97e-06 | 1.21e-06 | 68 |
| hsa0414211 | Liver | Cirrhotic | Lysosome | 68/2530 | 132/8465 | 1.34e-07 | 1.97e-06 | 1.21e-06 | 68 |
| hsa041422 | Liver | HCC | Lysosome | 100/4020 | 132/8465 | 2.32e-11 | 4.31e-10 | 2.40e-10 | 100 |
| hsa041423 | Liver | HCC | Lysosome | 100/4020 | 132/8465 | 2.32e-11 | 4.31e-10 | 2.40e-10 | 100 |
| Page: 1 |
Top |
Cell-cell communication analysis |
| Identification of potential cell-cell interactions between two cell types and their ligand-receptor pairs for different disease states |
| Ligand | Receptor | LRpair | Pathway | Tissue | Disease Stage |
| Page: 1 |
Top |
Single-cell gene regulatory network inference analysis |
| Find out the significant the regulons (TFs) and the target genes of each regulon across cell types for different disease states |
| TF | Cell Type | Tissue | Disease Stage | Target Gene | RSS | Regulon Activity |
| ∗The dot plots of a searched regulon are shown for all cell subpopulations in each disease state of each tissue based on the regulon specific score inferred using pySCENIC and by calculating the average expression. |
| Page: 1 |
Top |
Somatic mutation of malignant transformation related genes |
| Annotation of somatic variants for genes involved in malignant transformation |
| Hugo Symbol | Variant Class | Variant Classification | dbSNP RS | HGVSc | HGVSp | HGVSp Short | SWISSPROT | BIOTYPE | SIFT | PolyPhen | Tumor Sample Barcode | Tissue | Histology | Sex | Age | Stage | Therapy Types | Drugs | Outcome |
| ACP2 | SNV | Missense_Mutation | rs765062000 | c.1042N>T | p.Arg348Cys | p.R348C | P11117 | protein_coding | tolerated(0.18) | benign(0.402) | TCGA-2W-A8YY-01 | Cervix | cervical & endocervical cancer | Female | <65 | I/II | Chemotherapy | cisplatin | CR |
| ACP2 | SNV | Missense_Mutation | c.581N>T | p.Gly194Val | p.G194V | P11117 | protein_coding | deleterious(0) | probably_damaging(1) | TCGA-A6-6653-01 | Colorectum | colon adenocarcinoma | Male | >=65 | I/II | Unknown | Unknown | SD | |
| ACP2 | SNV | Missense_Mutation | rs752483023 | c.1241N>A | p.Arg414His | p.R414H | P11117 | protein_coding | tolerated(0.26) | benign(0) | TCGA-AA-3950-01 | Colorectum | colon adenocarcinoma | Female | >=65 | I/II | Unknown | Unknown | SD |
| ACP2 | SNV | Missense_Mutation | rs199935537 | c.256N>T | p.Arg86Cys | p.R86C | P11117 | protein_coding | deleterious(0) | probably_damaging(1) | TCGA-AZ-6601-01 | Colorectum | colon adenocarcinoma | Male | >=65 | I/II | Unknown | Unknown | PD |
| ACP2 | SNV | Missense_Mutation | novel | c.301N>C | p.Tyr101His | p.Y101H | P11117 | protein_coding | deleterious(0.01) | possibly_damaging(0.867) | TCGA-CK-5916-01 | Colorectum | colon adenocarcinoma | Female | >=65 | I/II | Unknown | Unknown | PD |
| ACP2 | SNV | Missense_Mutation | rs757664236 | c.542N>A | p.Arg181Gln | p.R181Q | P11117 | protein_coding | tolerated(0.63) | benign(0) | TCGA-CM-6171-01 | Colorectum | colon adenocarcinoma | Female | >=65 | I/II | Unknown | Unknown | SD |
| ACP2 | SNV | Missense_Mutation | novel | c.757G>A | p.Ala253Thr | p.A253T | P11117 | protein_coding | deleterious(0.03) | possibly_damaging(0.755) | TCGA-A5-A0G1-01 | Endometrium | uterine corpus endometrioid carcinoma | Female | >=65 | I/II | Unknown | Unknown | SD |
| ACP2 | SNV | Missense_Mutation | novel | c.197N>T | p.Gly66Val | p.G66V | P11117 | protein_coding | deleterious(0) | probably_damaging(1) | TCGA-A5-A0G2-01 | Endometrium | uterine corpus endometrioid carcinoma | Female | <65 | III/IV | Unknown | Unknown | SD |
| ACP2 | SNV | Missense_Mutation | c.328N>T | p.Thr110Ser | p.T110S | P11117 | protein_coding | deleterious(0) | probably_damaging(0.998) | TCGA-A5-A0G9-01 | Endometrium | uterine corpus endometrioid carcinoma | Female | >=65 | I/II | Unknown | Unknown | SD | |
| ACP2 | SNV | Missense_Mutation | novel | c.219N>A | p.Met73Ile | p.M73I | P11117 | protein_coding | tolerated(0.14) | probably_damaging(0.994) | TCGA-A5-A1OF-01 | Endometrium | uterine corpus endometrioid carcinoma | Female | <65 | I/II | Unknown | Unknown | SD |
| Page: 1 2 3 4 |
Top |
Related drugs of malignant transformation related genes |
| Identification of chemicals and drugs interact with genes involved in malignant transfromation |
| (DGIdb 4.0) |
| Entrez ID | Symbol | Category | Interaction Types | Drug Claim Name | Drug Name | PMIDs |
| Page: 1 |

Copyright 2023-Present -The University of Texas Health Science Center at Houston |