
|
|||||
|
 | |
| |
| |
| |
| |
| |
|
Gene: ACP1 |
Gene summary for ACP1 |
| Gene information | Species | Human | Gene symbol | ACP1 | Gene ID | 52 |
| Gene name | acid phosphatase 1 | |
| Gene Alias | HAAP | |
| Cytomap | 2p25.3 | |
| Gene Type | protein-coding | GO ID | GO:0006464 | UniProtAcc | A0A140VK37 |
Top |
Malignant transformation analysis |
| Identification of the aberrant gene expression in precancerous and cancerous lesions by comparing the gene expression of stem-like cells in diseased tissues with normal stem cells |
| Entrez ID | Symbol | Replicates | Species | Organ | Tissue | Adj P-value | Log2FC | Malignancy |
| 52 | ACP1 | HTA11_1938_2000001011 | Human | Colorectum | AD | 3.87e-04 | 2.63e-01 | -0.0811 |
| 52 | ACP1 | HTA11_78_2000001011 | Human | Colorectum | AD | 2.98e-05 | 2.56e-01 | -0.1088 |
| 52 | ACP1 | HTA11_347_2000001011 | Human | Colorectum | AD | 1.29e-08 | 3.35e-01 | -0.1954 |
| 52 | ACP1 | HTA11_1391_2000001011 | Human | Colorectum | AD | 4.67e-03 | 3.18e-01 | -0.059 |
| 52 | ACP1 | HTA11_866_3004761011 | Human | Colorectum | AD | 2.49e-05 | 2.11e-01 | 0.096 |
| 52 | ACP1 | HTA11_99999970781_79442 | Human | Colorectum | MSS | 2.98e-09 | 4.18e-01 | 0.294 |
| 52 | ACP1 | HTA11_99999965104_69814 | Human | Colorectum | MSS | 2.01e-03 | 3.46e-01 | 0.281 |
| 52 | ACP1 | HTA11_99999971662_82457 | Human | Colorectum | MSS | 2.40e-10 | 4.23e-01 | 0.3859 |
| 52 | ACP1 | HTA11_99999974143_84620 | Human | Colorectum | MSS | 1.65e-04 | 2.32e-01 | 0.3005 |
| 52 | ACP1 | AEH-subject1 | Human | Endometrium | AEH | 7.31e-13 | -3.45e-01 | -0.3059 |
| 52 | ACP1 | AEH-subject2 | Human | Endometrium | AEH | 2.40e-09 | -2.82e-01 | -0.2525 |
| 52 | ACP1 | AEH-subject3 | Human | Endometrium | AEH | 9.55e-13 | -2.42e-01 | -0.2576 |
| 52 | ACP1 | AEH-subject4 | Human | Endometrium | AEH | 2.08e-07 | -3.06e-01 | -0.2657 |
| 52 | ACP1 | AEH-subject5 | Human | Endometrium | AEH | 8.21e-09 | -2.48e-01 | -0.2953 |
| 52 | ACP1 | EEC-subject1 | Human | Endometrium | EEC | 2.52e-14 | -3.19e-01 | -0.2682 |
| 52 | ACP1 | EEC-subject2 | Human | Endometrium | EEC | 9.86e-23 | -4.14e-01 | -0.2607 |
| 52 | ACP1 | EEC-subject3 | Human | Endometrium | EEC | 2.43e-45 | -4.29e-01 | -0.2525 |
| 52 | ACP1 | EEC-subject4 | Human | Endometrium | EEC | 4.96e-10 | -2.63e-01 | -0.2571 |
| 52 | ACP1 | EEC-subject5 | Human | Endometrium | EEC | 7.21e-09 | -2.29e-01 | -0.249 |
| 52 | ACP1 | GSM5276934 | Human | Endometrium | EEC | 2.73e-06 | -2.32e-01 | -0.0913 |
| Page: 1 2 3 4 5 6 7 8 9 |
| Tissue | Expression Dynamics | Abbreviation |
| Colorectum (GSE201348) |  | FAP: Familial adenomatous polyposis |
| CRC: Colorectal cancer | ||
| Colorectum (HTA11) |  | AD: Adenomas |
| SER: Sessile serrated lesions | ||
| MSI-H: Microsatellite-high colorectal cancer | ||
| MSS: Microsatellite stable colorectal cancer | ||
| Endometrium | 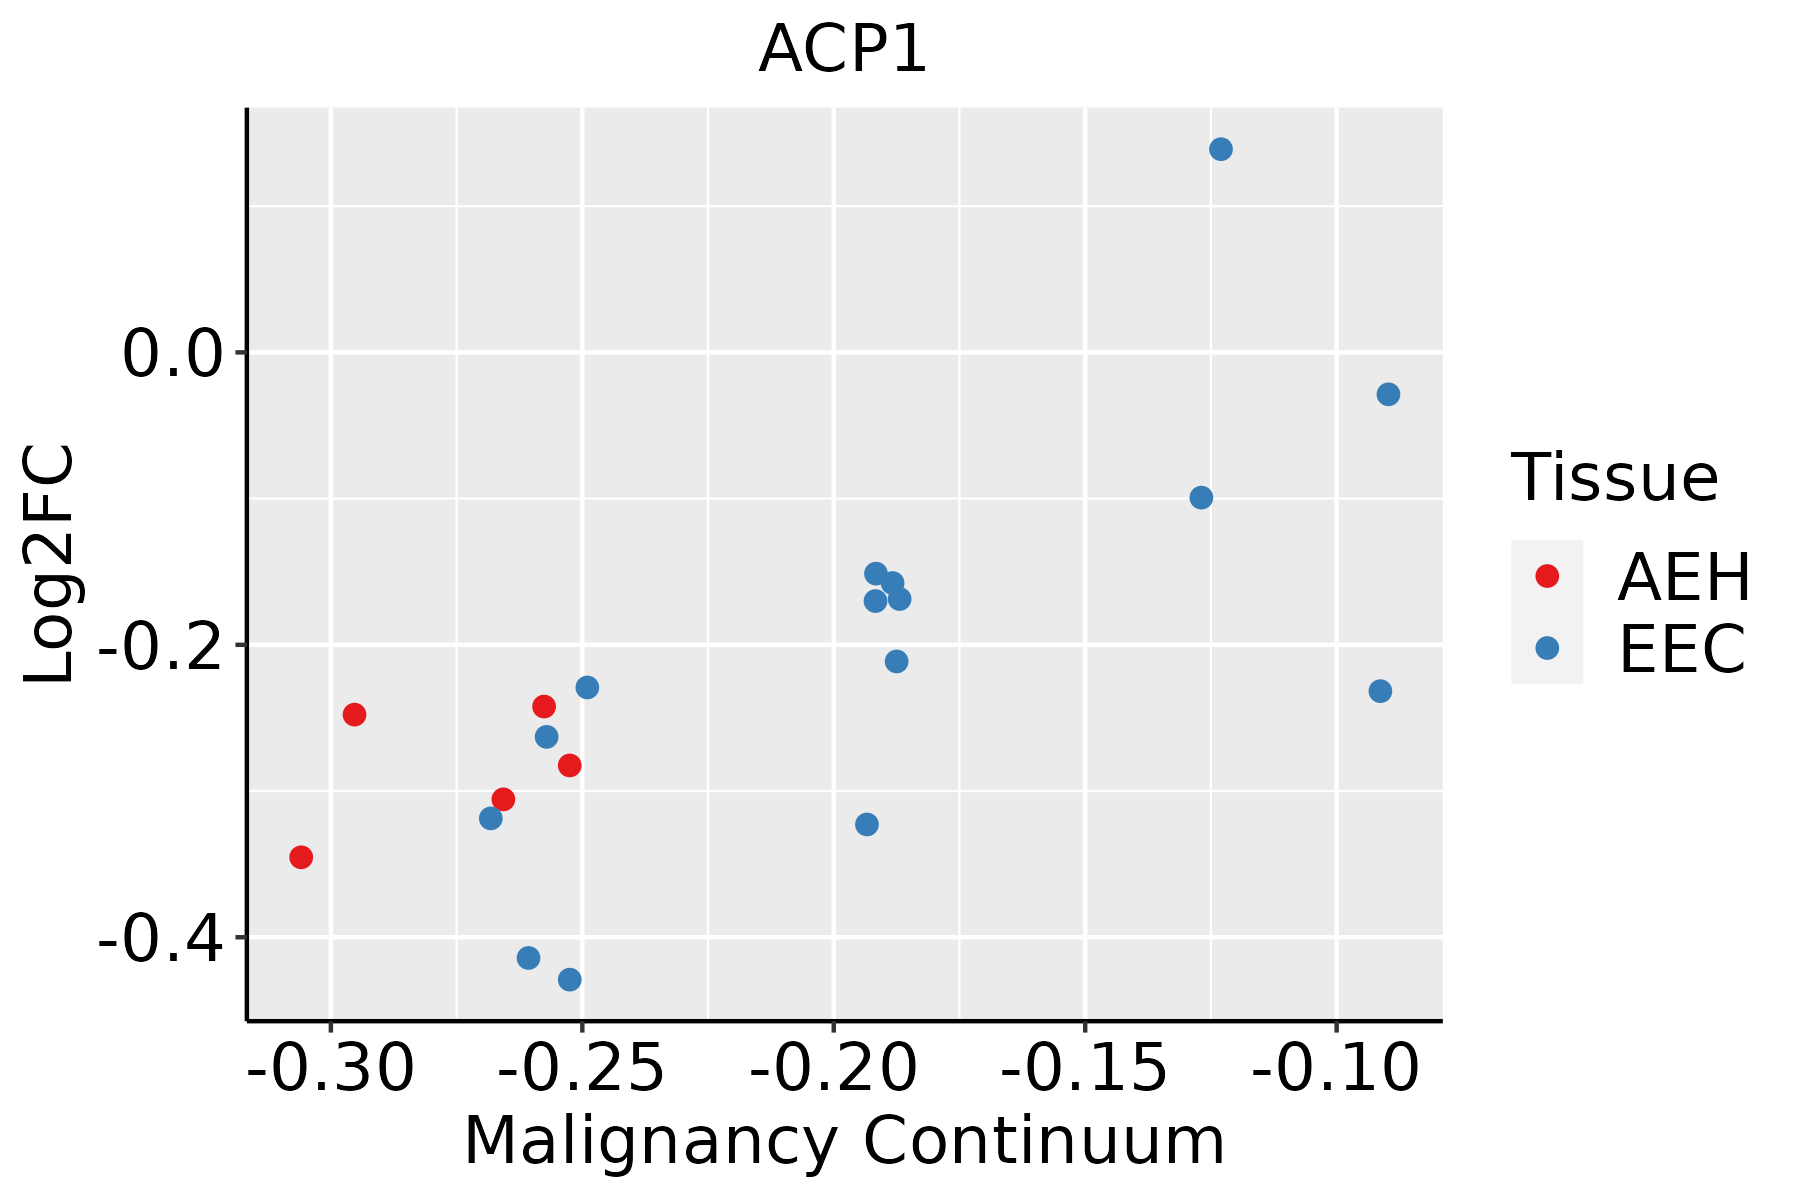 | AEH: Atypical endometrial hyperplasia |
| EEC: Endometrioid Cancer | ||
| Esophagus | 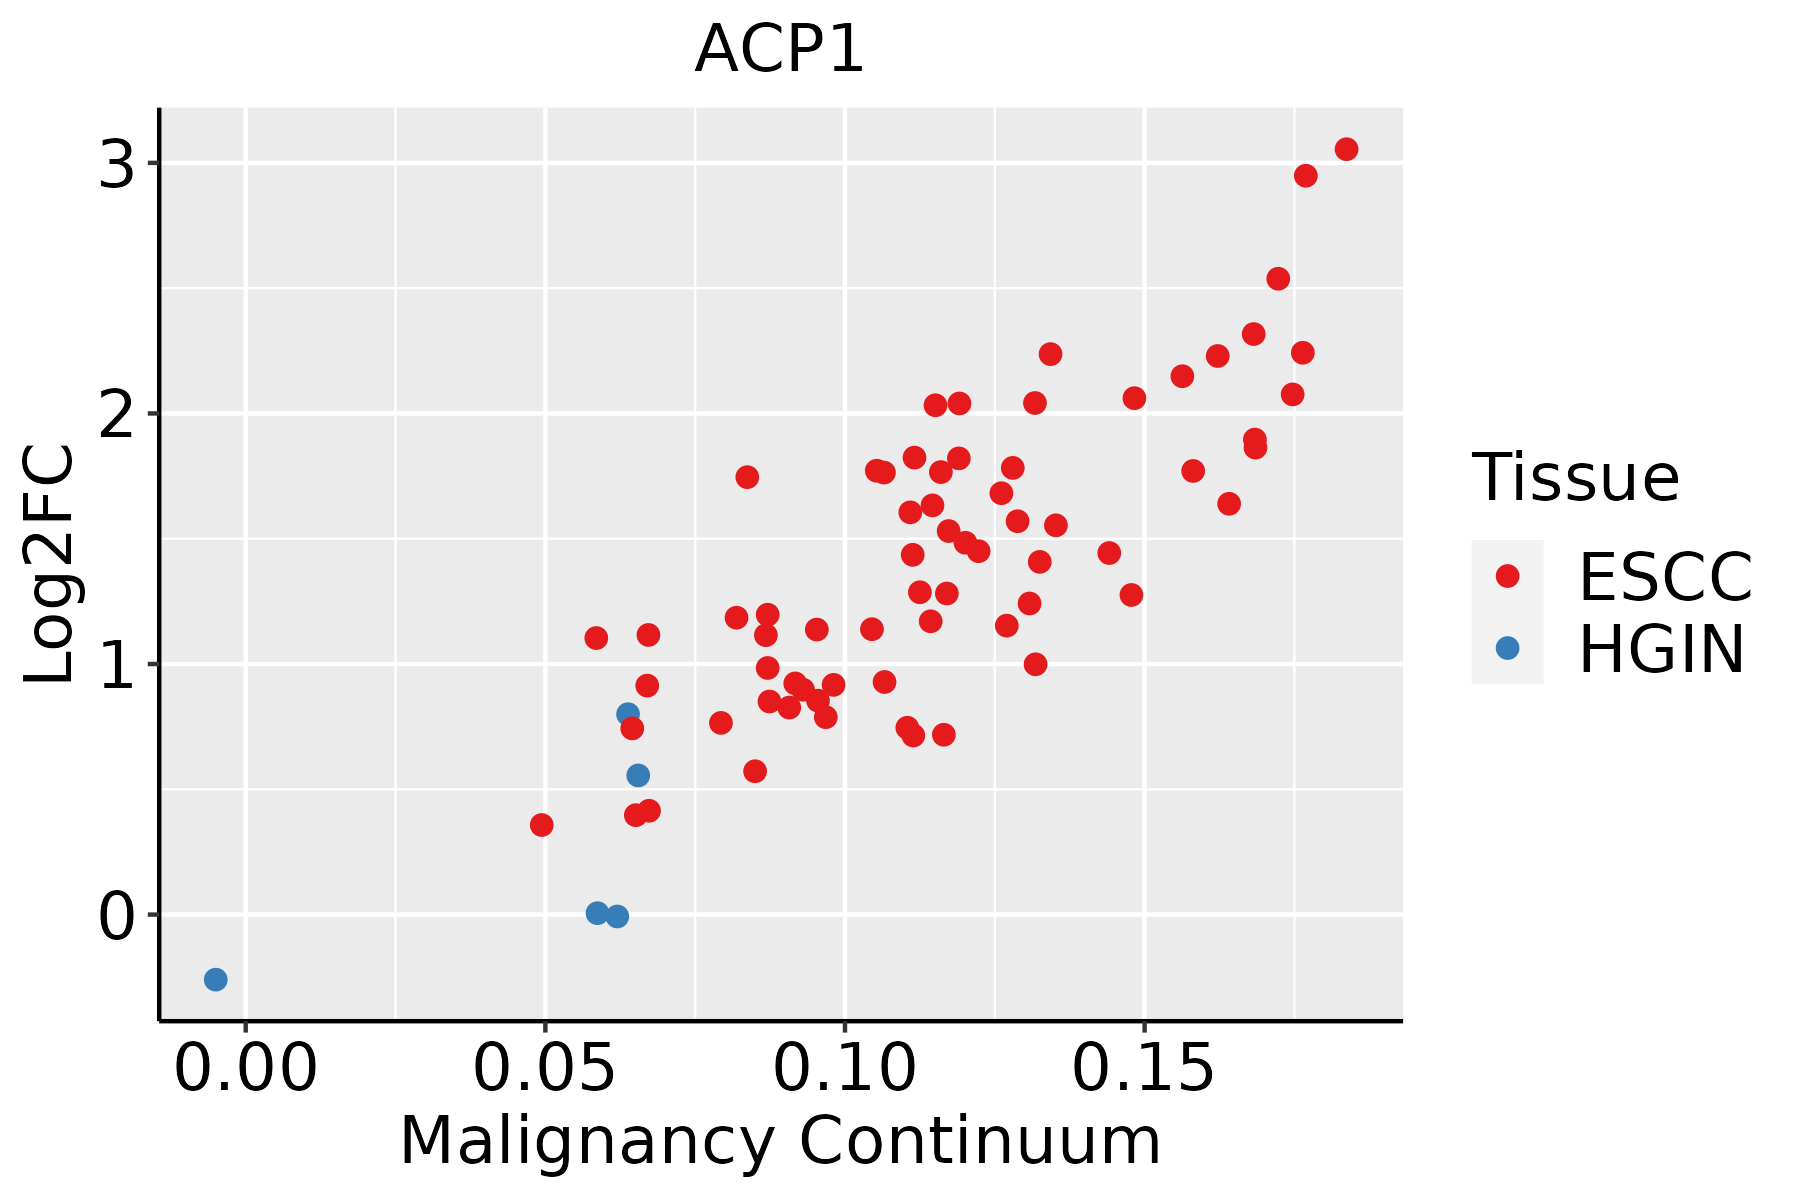 | ESCC: Esophageal squamous cell carcinoma |
| HGIN: High-grade intraepithelial neoplasias | ||
| LGIN: Low-grade intraepithelial neoplasias | ||
| Liver | 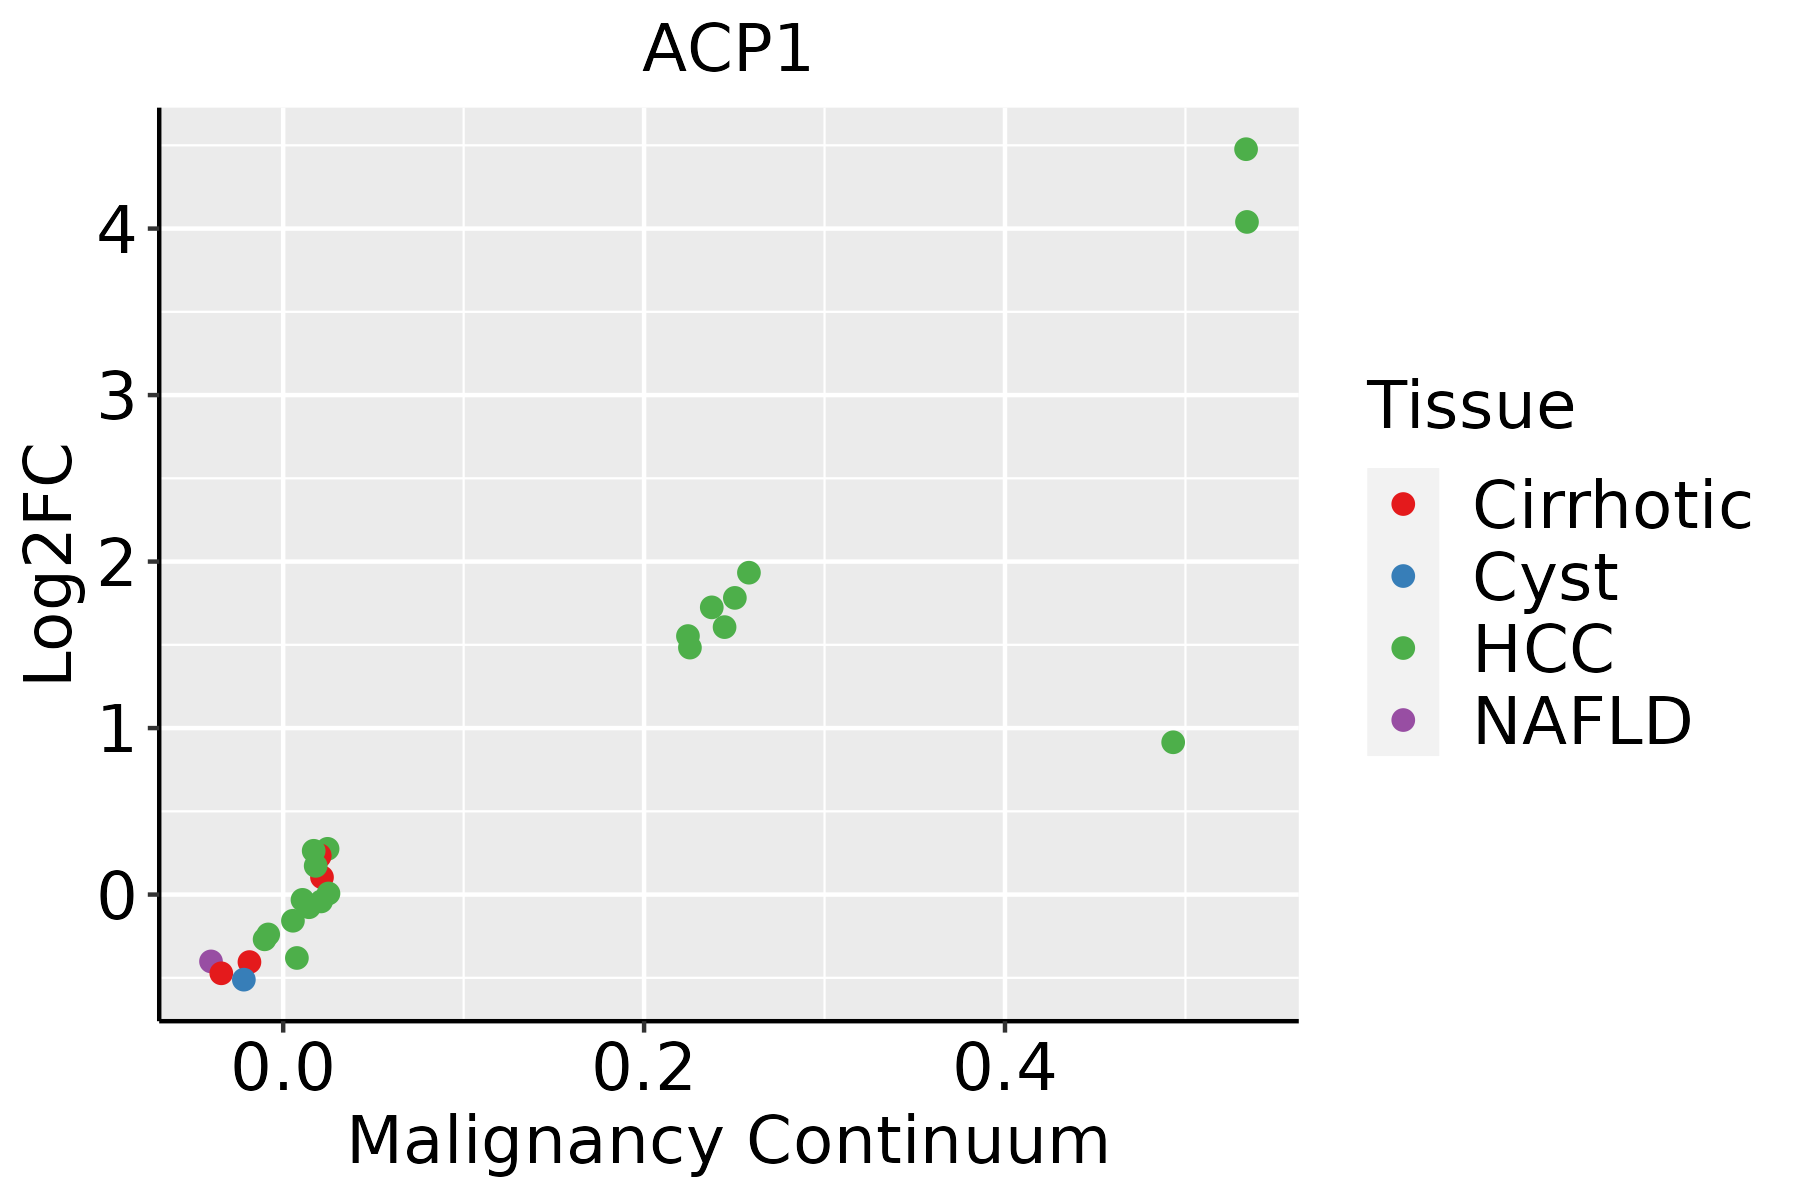 | HCC: Hepatocellular carcinoma |
| NAFLD: Non-alcoholic fatty liver disease | ||
| Oral Cavity |  | EOLP: Erosive Oral lichen planus |
| LP: leukoplakia | ||
| NEOLP: Non-erosive oral lichen planus | ||
| OSCC: Oral squamous cell carcinoma | ||
| Prostate | 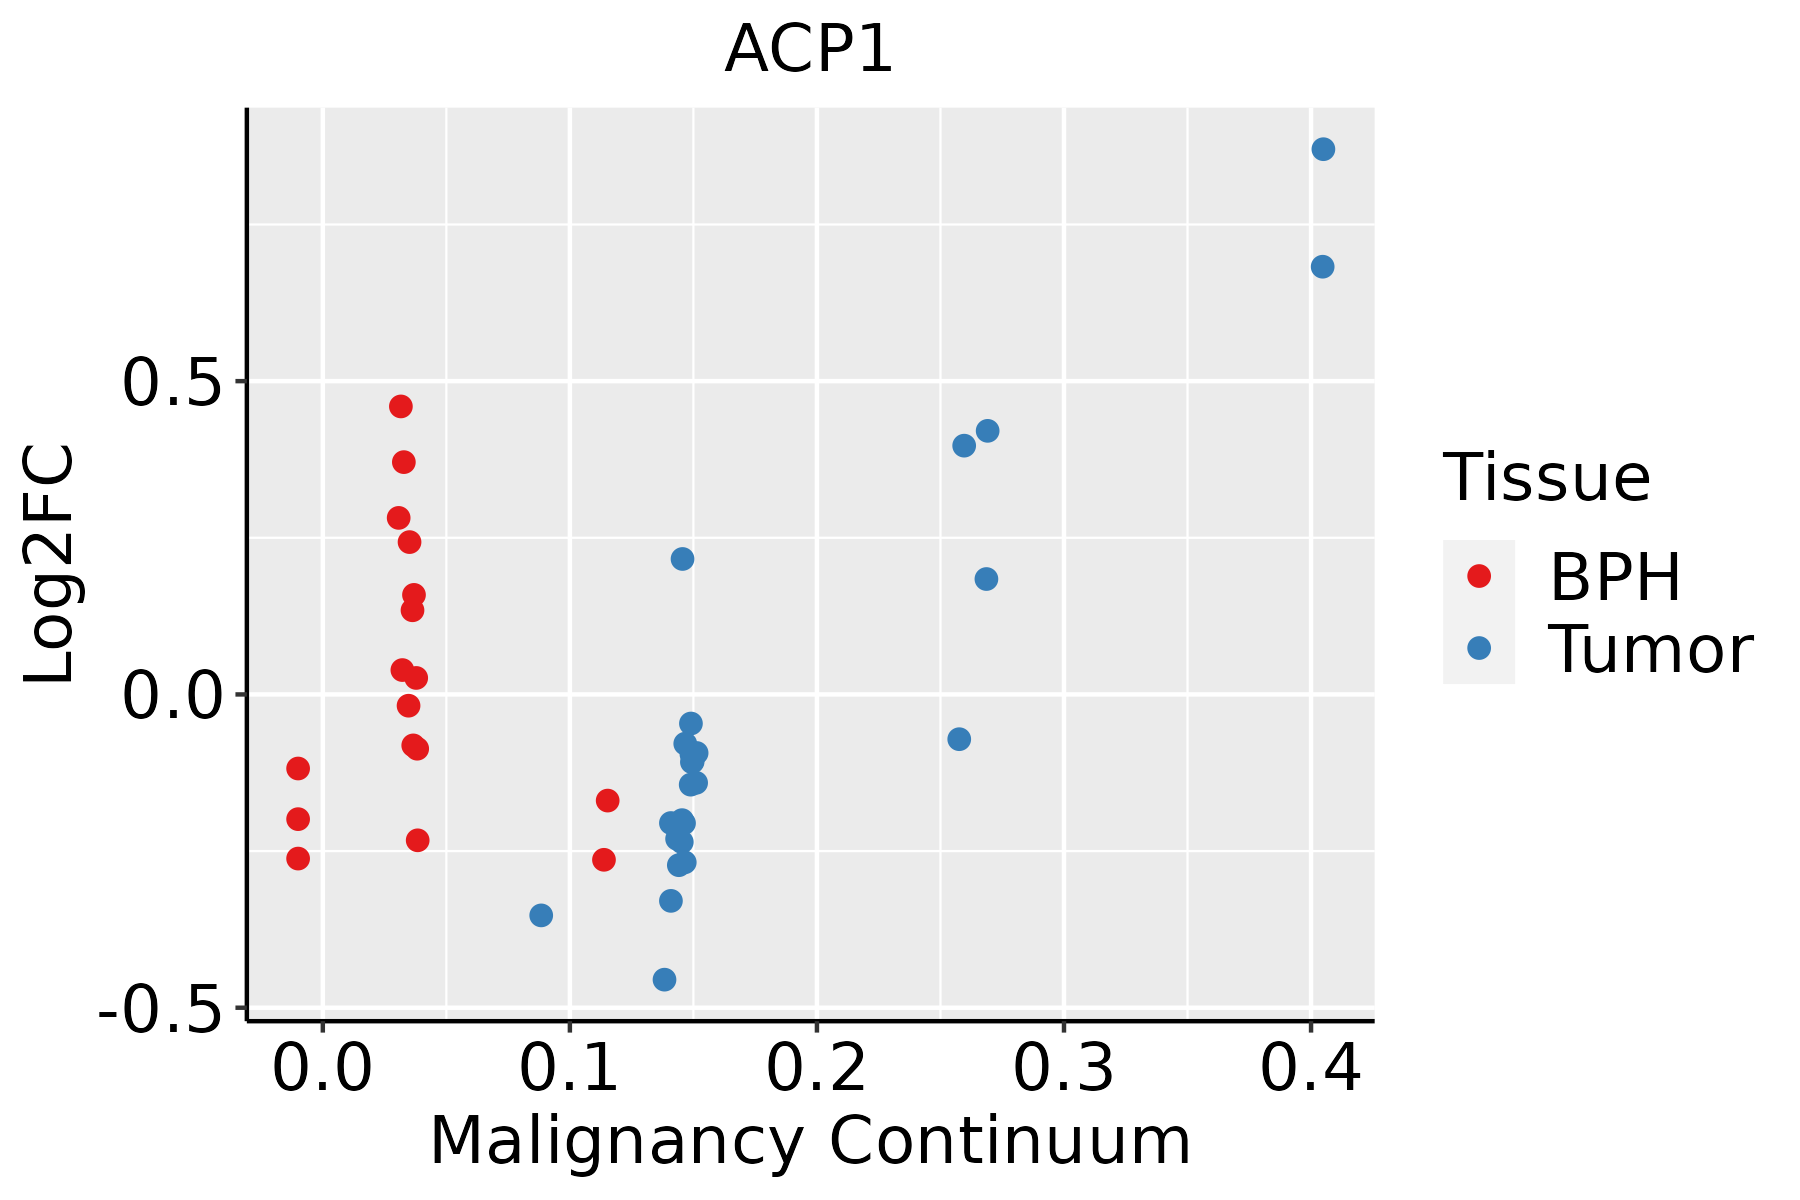 | BPH: Benign Prostatic Hyperplasia |
| Skin |  | AK: Actinic keratosis |
| cSCC: Cutaneous squamous cell carcinoma | ||
| SCCIS:squamous cell carcinoma in situ | ||
| Thyroid | 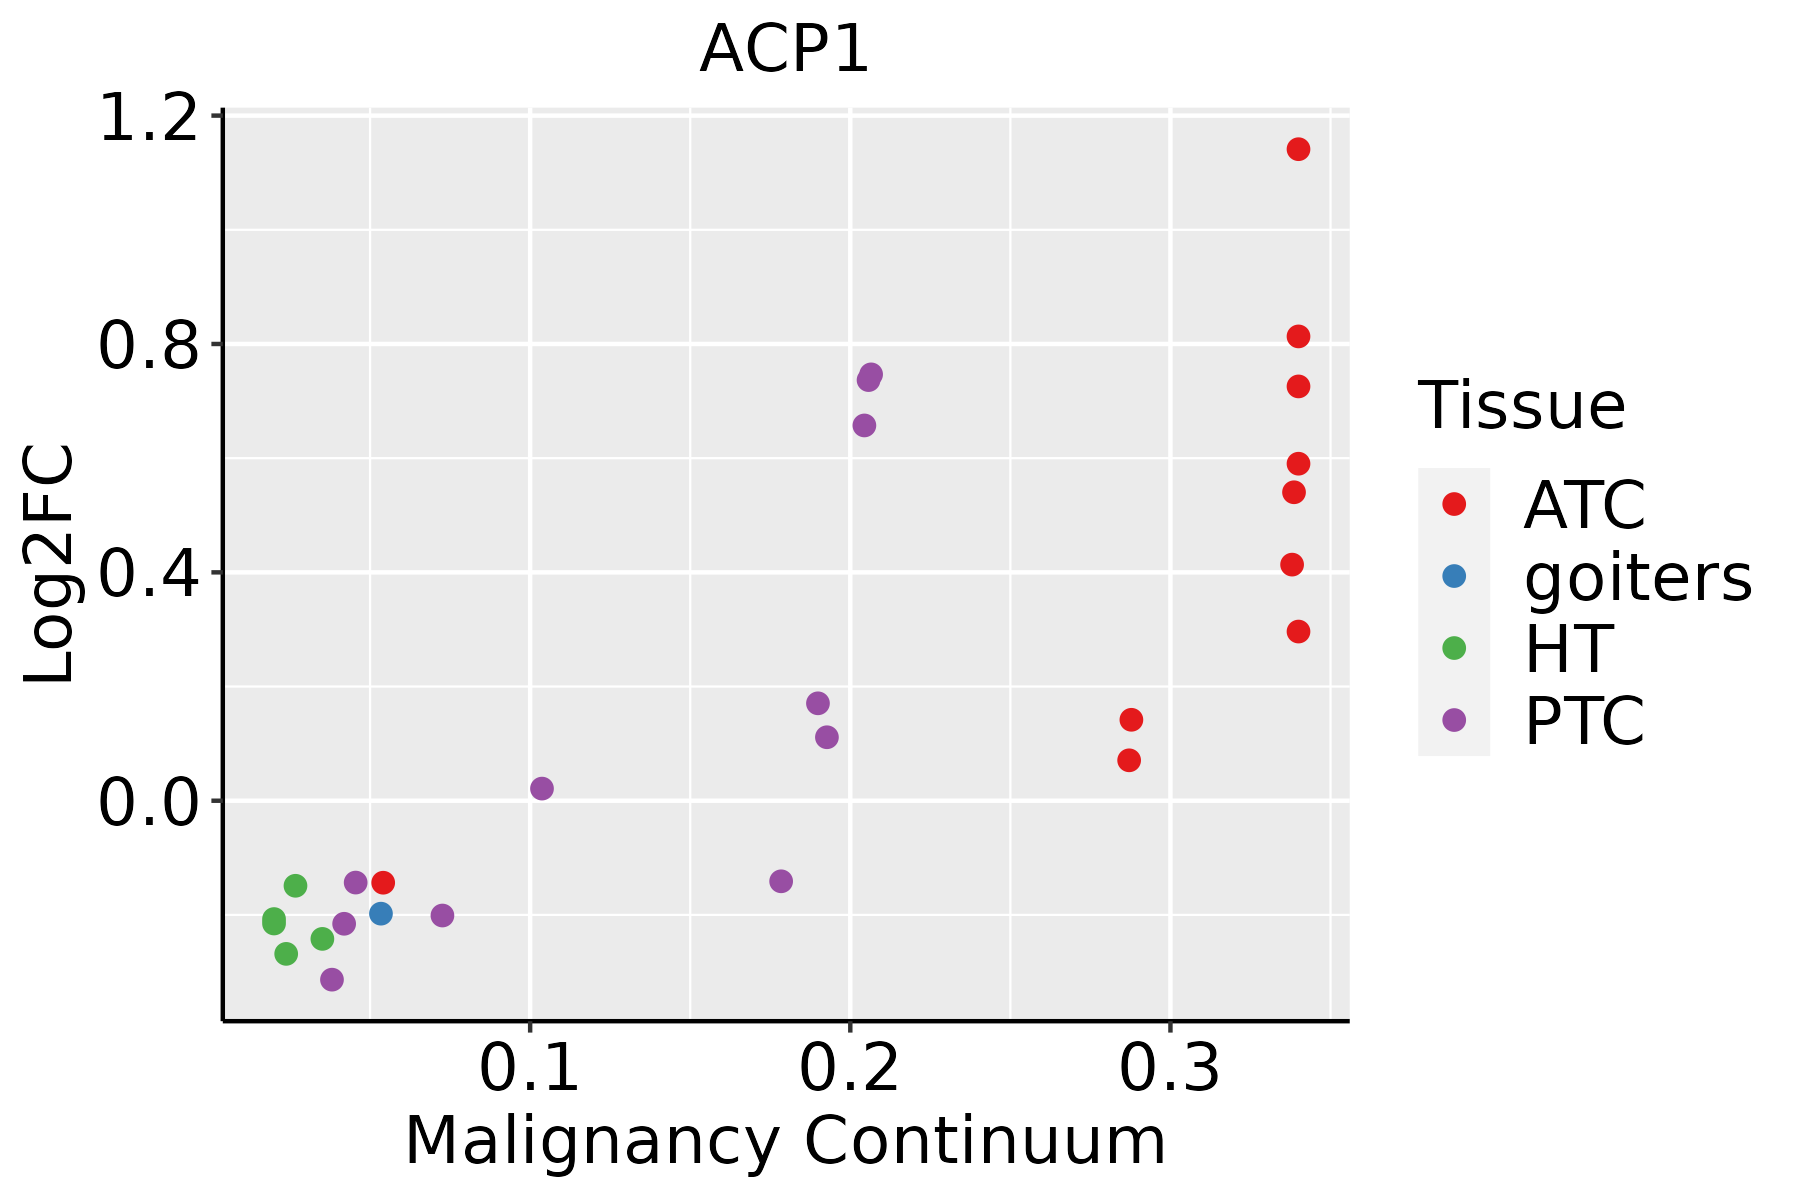 | ATC: Anaplastic thyroid cancer |
| HT: Hashimoto's thyroiditis | ||
| PTC: Papillary thyroid cancer |
| ∗log2FC in expression of this searched gene in stem-like cells from each diseased tissue sample relative to stem-like cells in normal samples in each tissue plotted against the malignancy continuum. Samples are colored based on if they are from different disease stage. |
Top |
Malignant transformation related pathway analysis |
| Find out the enriched GO biological processes and KEGG pathways involved in transition from healthy to precancer to cancer |
| Tissue | Disease Stage | Enriched GO biological Processes |
| Colorectum | AD |  |
| Colorectum | SER |  |
| Colorectum | MSS |  |
| Colorectum | MSI-H |  |
| Colorectum | FAP |  |
| ∗Top 15 enriched GO BP terms are showed in the bar plot of each disease state in each tissue. Each row represents a significant GO biological process which is colored according to the -log10(p.adjust). |
| Page: 1 2 3 4 5 6 7 8 9 |
| GO ID | Tissue | Disease Stage | Description | Gene Ratio | Bg Ratio | pvalue | p.adjust | Count |
| GO:0016311 | Colorectum | AD | dephosphorylation | 123/3918 | 417/18723 | 1.84e-05 | 3.82e-04 | 123 |
| GO:0006470 | Colorectum | AD | protein dephosphorylation | 88/3918 | 281/18723 | 2.56e-05 | 4.89e-04 | 88 |
| GO:00064702 | Colorectum | MSS | protein dephosphorylation | 73/3467 | 281/18723 | 1.15e-03 | 1.12e-02 | 73 |
| GO:00163112 | Colorectum | MSS | dephosphorylation | 101/3467 | 417/18723 | 1.98e-03 | 1.70e-02 | 101 |
| GO:00064709 | Endometrium | AEH | protein dephosphorylation | 50/2100 | 281/18723 | 6.41e-04 | 6.23e-03 | 50 |
| GO:000647013 | Endometrium | EEC | protein dephosphorylation | 51/2168 | 281/18723 | 7.38e-04 | 7.01e-03 | 51 |
| GO:000647017 | Esophagus | HGIN | protein dephosphorylation | 61/2587 | 281/18723 | 1.86e-04 | 3.51e-03 | 61 |
| GO:001631110 | Esophagus | ESCC | dephosphorylation | 251/8552 | 417/18723 | 1.26e-09 | 2.99e-08 | 251 |
| GO:000647018 | Esophagus | ESCC | protein dephosphorylation | 177/8552 | 281/18723 | 3.13e-09 | 6.72e-08 | 177 |
| GO:000647011 | Liver | Cirrhotic | protein dephosphorylation | 96/4634 | 281/18723 | 2.32e-04 | 2.11e-03 | 96 |
| GO:001631111 | Liver | Cirrhotic | dephosphorylation | 130/4634 | 417/18723 | 1.58e-03 | 1.03e-02 | 130 |
| GO:001631121 | Liver | HCC | dephosphorylation | 230/7958 | 417/18723 | 1.00e-07 | 1.96e-06 | 230 |
| GO:000647021 | Liver | HCC | protein dephosphorylation | 162/7958 | 281/18723 | 1.91e-07 | 3.46e-06 | 162 |
| GO:000647015 | Oral cavity | OSCC | protein dephosphorylation | 162/7305 | 281/18723 | 1.56e-10 | 4.56e-09 | 162 |
| GO:00163119 | Oral cavity | OSCC | dephosphorylation | 220/7305 | 417/18723 | 6.33e-09 | 1.34e-07 | 220 |
| GO:000647016 | Oral cavity | LP | protein dephosphorylation | 89/4623 | 281/18723 | 4.60e-03 | 2.93e-02 | 89 |
| GO:000647010 | Prostate | BPH | protein dephosphorylation | 78/3107 | 281/18723 | 1.53e-06 | 2.63e-05 | 78 |
| GO:00163118 | Prostate | BPH | dephosphorylation | 98/3107 | 417/18723 | 1.53e-04 | 1.35e-03 | 98 |
| GO:000647014 | Prostate | Tumor | protein dephosphorylation | 76/3246 | 281/18723 | 2.86e-05 | 3.46e-04 | 76 |
| GO:001631113 | Prostate | Tumor | dephosphorylation | 98/3246 | 417/18723 | 7.31e-04 | 5.08e-03 | 98 |
| Page: 1 2 |
| Pathway ID | Tissue | Disease Stage | Description | Gene Ratio | Bg Ratio | pvalue | p.adjust | qvalue | Count |
| hsa05208 | Colorectum | AD | Chemical carcinogenesis - reactive oxygen species | 126/2092 | 223/8465 | 1.01e-24 | 1.68e-22 | 1.07e-22 | 126 |
| hsa04520 | Colorectum | AD | Adherens junction | 50/2092 | 93/8465 | 1.52e-09 | 2.83e-08 | 1.81e-08 | 50 |
| hsa052081 | Colorectum | AD | Chemical carcinogenesis - reactive oxygen species | 126/2092 | 223/8465 | 1.01e-24 | 1.68e-22 | 1.07e-22 | 126 |
| hsa045201 | Colorectum | AD | Adherens junction | 50/2092 | 93/8465 | 1.52e-09 | 2.83e-08 | 1.81e-08 | 50 |
| hsa052084 | Colorectum | MSS | Chemical carcinogenesis - reactive oxygen species | 118/1875 | 223/8465 | 2.71e-24 | 4.54e-22 | 2.78e-22 | 118 |
| hsa052085 | Colorectum | MSS | Chemical carcinogenesis - reactive oxygen species | 118/1875 | 223/8465 | 2.71e-24 | 4.54e-22 | 2.78e-22 | 118 |
| hsa0520826 | Endometrium | AEH | Chemical carcinogenesis - reactive oxygen species | 91/1197 | 223/8465 | 3.28e-23 | 1.33e-21 | 9.76e-22 | 91 |
| hsa05208112 | Endometrium | AEH | Chemical carcinogenesis - reactive oxygen species | 91/1197 | 223/8465 | 3.28e-23 | 1.33e-21 | 9.76e-22 | 91 |
| hsa0520827 | Endometrium | EEC | Chemical carcinogenesis - reactive oxygen species | 94/1237 | 223/8465 | 4.11e-24 | 1.93e-22 | 1.44e-22 | 94 |
| hsa0520836 | Endometrium | EEC | Chemical carcinogenesis - reactive oxygen species | 94/1237 | 223/8465 | 4.11e-24 | 1.93e-22 | 1.44e-22 | 94 |
| hsa0520839 | Esophagus | HGIN | Chemical carcinogenesis - reactive oxygen species | 92/1383 | 223/8465 | 2.41e-19 | 9.83e-18 | 7.80e-18 | 92 |
| hsa05208115 | Esophagus | HGIN | Chemical carcinogenesis - reactive oxygen species | 92/1383 | 223/8465 | 2.41e-19 | 9.83e-18 | 7.80e-18 | 92 |
| hsa0520822 | Liver | Cirrhotic | Chemical carcinogenesis - reactive oxygen species | 121/2530 | 223/8465 | 1.35e-14 | 4.08e-13 | 2.52e-13 | 121 |
| hsa0452022 | Liver | Cirrhotic | Adherens junction | 52/2530 | 93/8465 | 1.36e-07 | 1.97e-06 | 1.21e-06 | 52 |
| hsa0520832 | Liver | Cirrhotic | Chemical carcinogenesis - reactive oxygen species | 121/2530 | 223/8465 | 1.35e-14 | 4.08e-13 | 2.52e-13 | 121 |
| hsa0452032 | Liver | Cirrhotic | Adherens junction | 52/2530 | 93/8465 | 1.36e-07 | 1.97e-06 | 1.21e-06 | 52 |
| hsa0520842 | Liver | HCC | Chemical carcinogenesis - reactive oxygen species | 167/4020 | 223/8465 | 2.85e-17 | 1.91e-15 | 1.06e-15 | 167 |
| hsa0452042 | Liver | HCC | Adherens junction | 68/4020 | 93/8465 | 3.99e-07 | 4.46e-06 | 2.48e-06 | 68 |
| hsa0520852 | Liver | HCC | Chemical carcinogenesis - reactive oxygen species | 167/4020 | 223/8465 | 2.85e-17 | 1.91e-15 | 1.06e-15 | 167 |
| hsa0452052 | Liver | HCC | Adherens junction | 68/4020 | 93/8465 | 3.99e-07 | 4.46e-06 | 2.48e-06 | 68 |
| Page: 1 2 |
Top |
Cell-cell communication analysis |
| Identification of potential cell-cell interactions between two cell types and their ligand-receptor pairs for different disease states |
| Ligand | Receptor | LRpair | Pathway | Tissue | Disease Stage |
| Page: 1 |
Top |
Single-cell gene regulatory network inference analysis |
| Find out the significant the regulons (TFs) and the target genes of each regulon across cell types for different disease states |
| TF | Cell Type | Tissue | Disease Stage | Target Gene | RSS | Regulon Activity |
| ∗The dot plots of a searched regulon are shown for all cell subpopulations in each disease state of each tissue based on the regulon specific score inferred using pySCENIC and by calculating the average expression. |
| Page: 1 |
Top |
Somatic mutation of malignant transformation related genes |
| Annotation of somatic variants for genes involved in malignant transformation |
| Hugo Symbol | Variant Class | Variant Classification | dbSNP RS | HGVSc | HGVSp | HGVSp Short | SWISSPROT | BIOTYPE | SIFT | PolyPhen | Tumor Sample Barcode | Tissue | Histology | Sex | Age | Stage | Therapy Types | Drugs | Outcome |
| ACP1 | SNV | Missense_Mutation | novel | c.418N>C | p.Glu140Gln | p.E140Q | P24666 | protein_coding | tolerated(0.05) | probably_damaging(0.948) | TCGA-C5-A2LZ-01 | Cervix | cervical & endocervical cancer | Female | >=65 | III/IV | Unknown | Unknown | PD |
| ACP1 | SNV | Missense_Mutation | novel | c.271N>C | p.Cys91Arg | p.C91R | P24666 | protein_coding | tolerated(0.07) | benign(0.351) | TCGA-5M-AAT6-01 | Colorectum | colon adenocarcinoma | Female | <65 | III/IV | Unknown | Unknown | PD |
| ACP1 | SNV | Missense_Mutation | rs769115575 | c.56N>A | p.Arg19Gln | p.R19Q | P24666 | protein_coding | tolerated(0.06) | possibly_damaging(0.801) | TCGA-AA-A010-01 | Colorectum | colon adenocarcinoma | Female | <65 | I/II | Chemotherapy | folinic | CR |
| ACP1 | SNV | Missense_Mutation | c.356N>A | p.Ser119Asn | p.S119N | P24666 | protein_coding | tolerated(0.11) | benign(0.005) | TCGA-AA-A010-01 | Colorectum | colon adenocarcinoma | Female | <65 | I/II | Chemotherapy | folinic | CR | |
| ACP1 | SNV | Missense_Mutation | rs763912438 | c.158N>A | p.Gly53Asp | p.G53D | P24666 | protein_coding | deleterious(0) | probably_damaging(0.951) | TCGA-D5-6930-01 | Colorectum | colon adenocarcinoma | Male | >=65 | I/II | Unknown | Unknown | SD |
| ACP1 | SNV | Missense_Mutation | novel | c.110N>T | p.Ser37Leu | p.S37L | P24666 | protein_coding | tolerated(0.39) | benign(0.001) | TCGA-4E-A92E-01 | Endometrium | uterine corpus endometrioid carcinoma | Female | <65 | I/II | Unknown | Unknown | SD |
| ACP1 | SNV | Missense_Mutation | c.128N>G | p.Asp43Gly | p.D43G | P24666 | protein_coding | deleterious(0.02) | benign(0.434) | TCGA-AX-A05Z-01 | Endometrium | uterine corpus endometrioid carcinoma | Female | <65 | III/IV | Chemotherapy | adriamycin | SD | |
| ACP1 | SNV | Missense_Mutation | c.439N>A | p.Val147Ile | p.V147I | P24666 | protein_coding | tolerated(0.08) | benign(0.003) | TCGA-BC-A10Z-01 | Liver | liver hepatocellular carcinoma | Female | <65 | I/II | Unknown | Unknown | SD | |
| ACP1 | SNV | Missense_Mutation | c.208N>T | p.His70Tyr | p.H70Y | P24666 | protein_coding | tolerated(0.05) | benign(0.01) | TCGA-38-4625-01 | Lung | lung adenocarcinoma | Female | >=65 | I/II | Unknown | Unknown | SD | |
| ACP1 | SNV | Missense_Mutation | novel | c.385G>C | p.Glu129Gln | p.E129Q | P24666 | protein_coding | tolerated(0.16) | benign(0.052) | TCGA-86-8673-01 | Lung | lung adenocarcinoma | Male | <65 | I/II | Unknown | Unknown | PD |
| Page: 1 2 |
Top |
Related drugs of malignant transformation related genes |
| Identification of chemicals and drugs interact with genes involved in malignant transfromation |
| (DGIdb 4.0) |
| Entrez ID | Symbol | Category | Interaction Types | Drug Claim Name | Drug Name | PMIDs |
| 52 | ACP1 | ENZYME, DRUGGABLE GENOME, PROTEIN PHOSPHATASE | GNF-PF-4353 | CHEMBL527307 | ||
| 52 | ACP1 | ENZYME, DRUGGABLE GENOME, PROTEIN PHOSPHATASE | GNF-PF-3542 | CHEMBL598477 | ||
| 52 | ACP1 | ENZYME, DRUGGABLE GENOME, PROTEIN PHOSPHATASE | NCI-372939 | CHEMBL84440 | ||
| 52 | ACP1 | ENZYME, DRUGGABLE GENOME, PROTEIN PHOSPHATASE | CEFDINIR | CEFDINIR | ||
| 52 | ACP1 | ENZYME, DRUGGABLE GENOME, PROTEIN PHOSPHATASE | AKT INHIBITOR VIII | CHEMBL258844 | ||
| 52 | ACP1 | ENZYME, DRUGGABLE GENOME, PROTEIN PHOSPHATASE | TCMDC-125603 | CHEMBL528734 | ||
| 52 | ACP1 | ENZYME, DRUGGABLE GENOME, PROTEIN PHOSPHATASE | PYRIMETHAMINE | PYRIMETHAMINE | ||
| 52 | ACP1 | ENZYME, DRUGGABLE GENOME, PROTEIN PHOSPHATASE | DNDI1417461 | CHEMBL1520282 | ||
| 52 | ACP1 | ENZYME, DRUGGABLE GENOME, PROTEIN PHOSPHATASE | GNF-PF-992 | CHEMBL602561 | ||
| 52 | ACP1 | ENZYME, DRUGGABLE GENOME, PROTEIN PHOSPHATASE | FIDUXOSIN HYDROCHLORIDE | FIDUXOSIN HYDROCHLORIDE |
| Page: 1 |

Copyright 2023-Present -The University of Texas Health Science Center at Houston |