
|
|||||
|
 | |
| |
| |
| |
| |
| |
|
Gene: ACOX2 |
Gene summary for ACOX2 |
| Gene information | Species | Human | Gene symbol | ACOX2 | Gene ID | 8309 |
| Gene name | acyl-CoA oxidase 2 | |
| Gene Alias | BCOX | |
| Cytomap | 3p14.3 | |
| Gene Type | protein-coding | GO ID | GO:0000038 | UniProtAcc | Q99424 |
Top |
Malignant transformation analysis |
| Identification of the aberrant gene expression in precancerous and cancerous lesions by comparing the gene expression of stem-like cells in diseased tissues with normal stem cells |
| Entrez ID | Symbol | Replicates | Species | Organ | Tissue | Adj P-value | Log2FC | Malignancy |
| 8309 | ACOX2 | GSM4909291 | Human | Breast | IDC | 4.81e-02 | 1.77e-01 | 0.1753 |
| 8309 | ACOX2 | GSM4909297 | Human | Breast | IDC | 3.51e-04 | 2.20e-01 | 0.1517 |
| 8309 | ACOX2 | GSM4909307 | Human | Breast | IDC | 1.69e-10 | 2.63e-01 | 0.1569 |
| 8309 | ACOX2 | GSM4909308 | Human | Breast | IDC | 1.72e-11 | 2.66e-01 | 0.158 |
| 8309 | ACOX2 | GSM4909317 | Human | Breast | IDC | 2.29e-03 | 1.27e-01 | 0.1355 |
| 8309 | ACOX2 | GSM4909321 | Human | Breast | IDC | 4.78e-31 | 7.89e-01 | 0.1559 |
| 8309 | ACOX2 | M1 | Human | Breast | IDC | 1.57e-21 | 5.22e-01 | 0.1577 |
| 8309 | ACOX2 | NCCBC14 | Human | Breast | DCIS | 3.88e-06 | 3.32e-01 | 0.2021 |
| 8309 | ACOX2 | NAFLD1 | Human | Liver | NAFLD | 1.37e-05 | 5.69e-01 | -0.04 |
| 8309 | ACOX2 | HCC1_Meng | Human | Liver | HCC | 2.06e-54 | 4.03e-01 | 0.0246 |
| 8309 | ACOX2 | S027 | Human | Liver | HCC | 2.51e-08 | 7.13e-01 | 0.2446 |
| 8309 | ACOX2 | S028 | Human | Liver | HCC | 1.45e-18 | 9.90e-01 | 0.2503 |
| 8309 | ACOX2 | S029 | Human | Liver | HCC | 9.19e-21 | 1.08e+00 | 0.2581 |
| Page: 1 |
| Tissue | Expression Dynamics | Abbreviation |
| Breast | 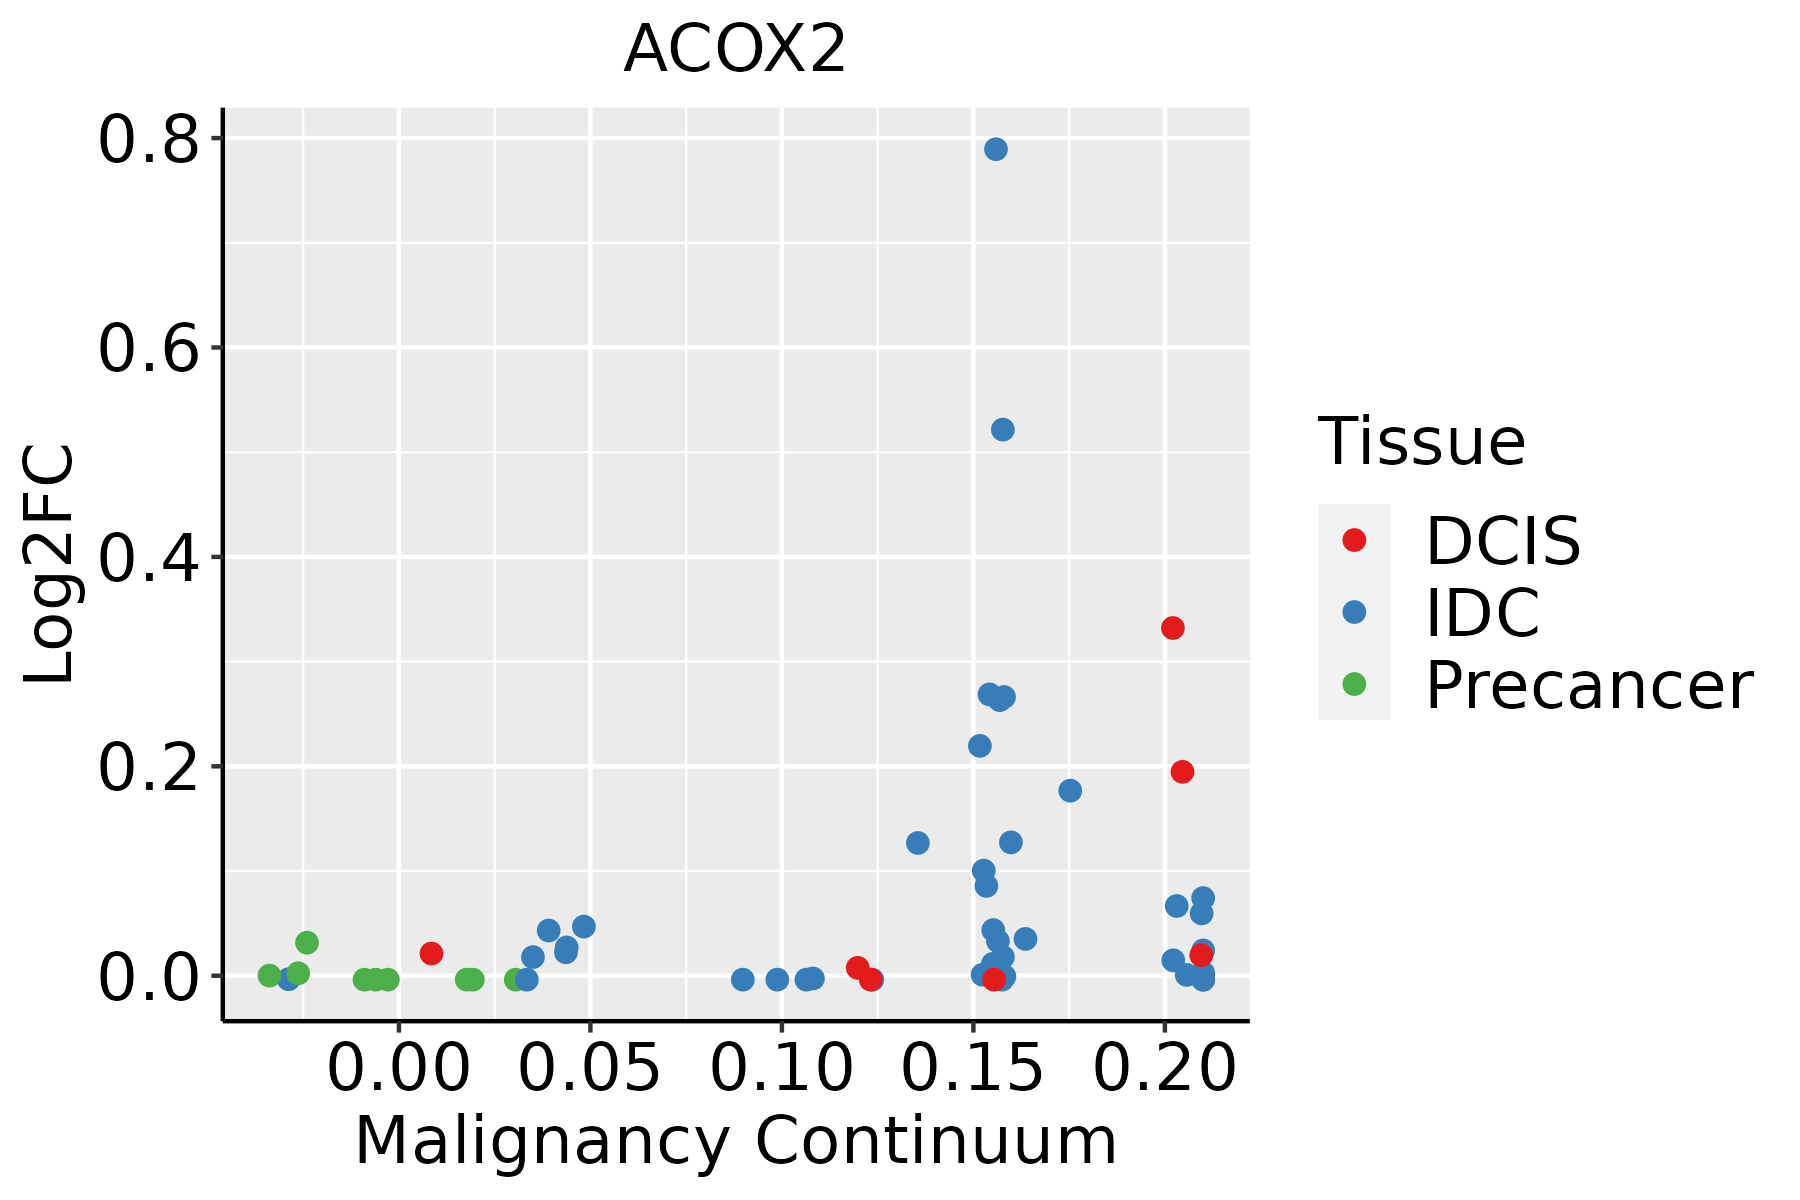 | IDC: Invasive ductal carcinoma |
| DCIS: Ductal carcinoma in situ | ||
| Precancer(BRCA1-mut): Precancerous lesion from BRCA1 mutation carriers | ||
| Liver | 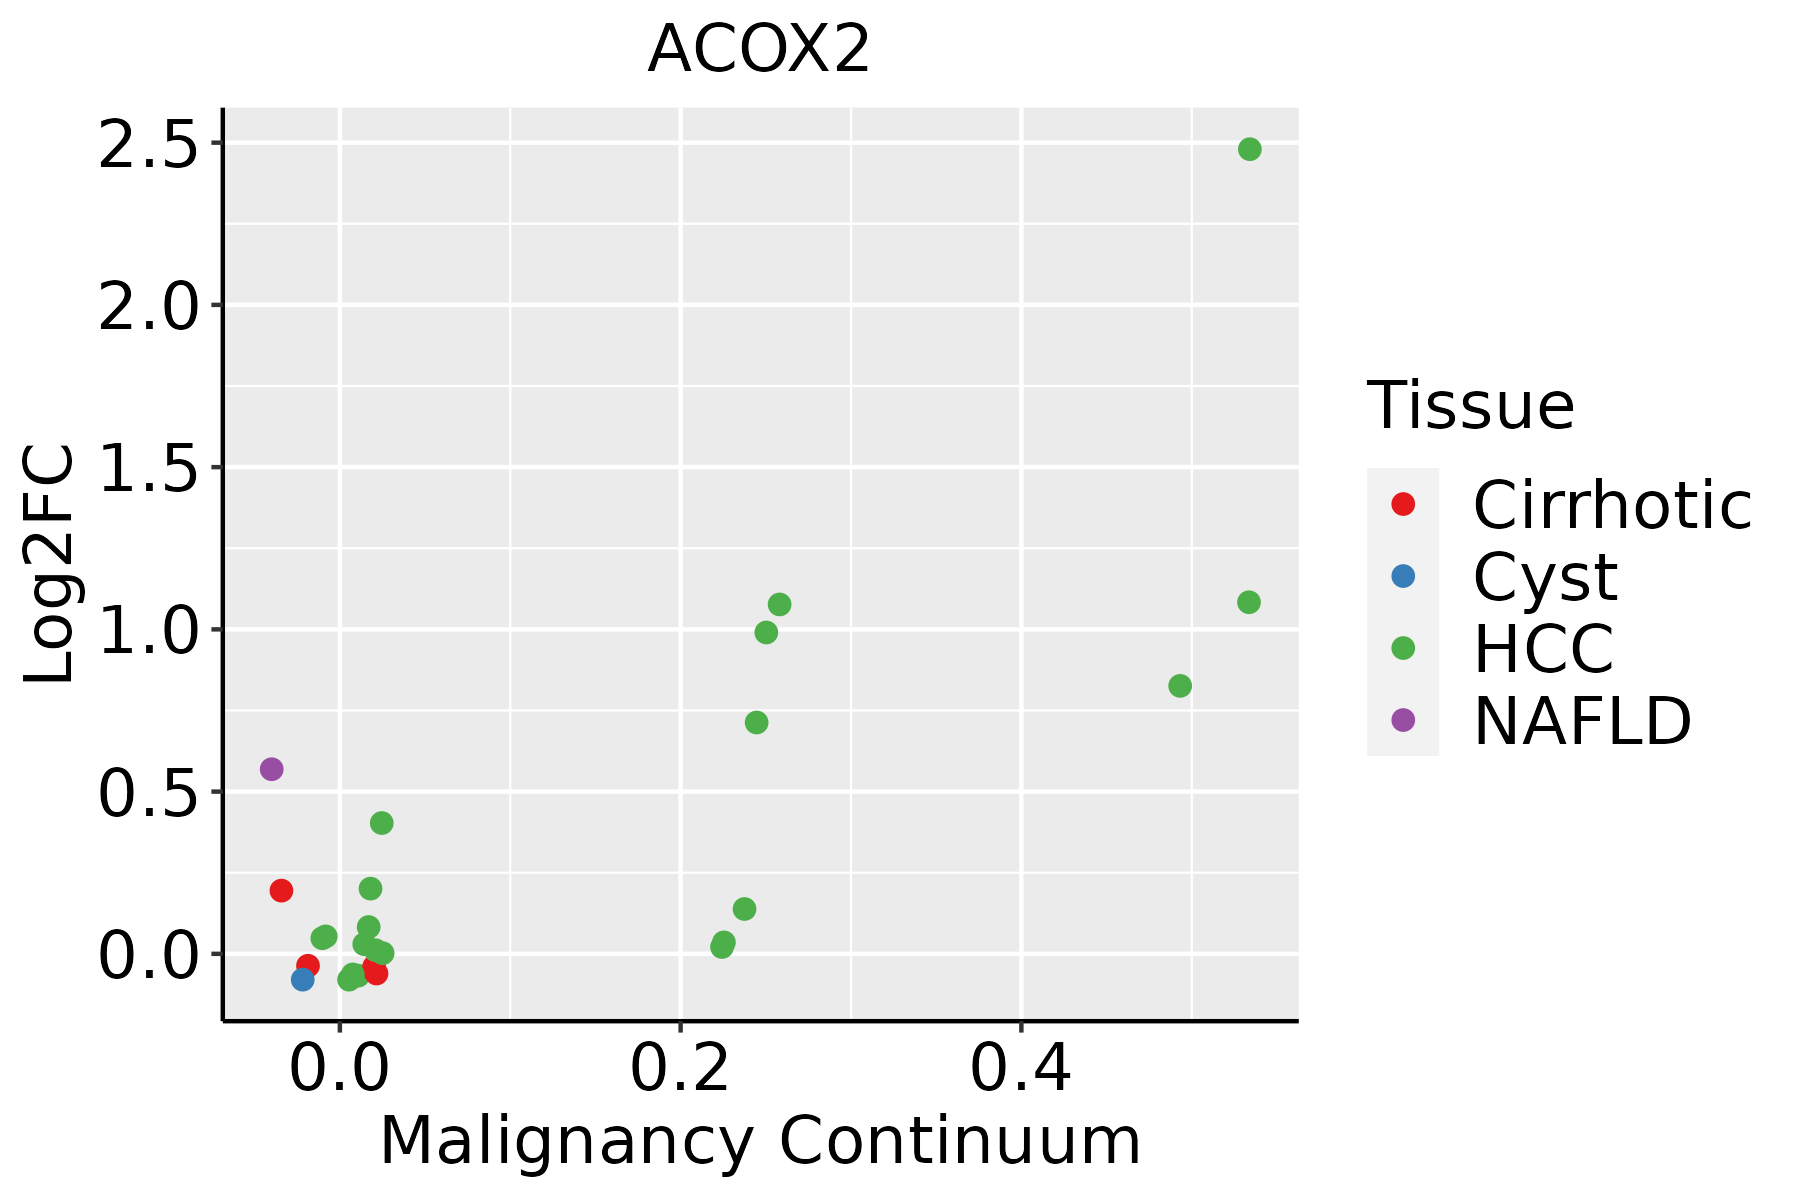 | HCC: Hepatocellular carcinoma |
| NAFLD: Non-alcoholic fatty liver disease |
| ∗log2FC in expression of this searched gene in stem-like cells from each diseased tissue sample relative to stem-like cells in normal samples in each tissue plotted against the malignancy continuum. Samples are colored based on if they are from different disease stage. |
Top |
Malignant transformation related pathway analysis |
| Find out the enriched GO biological processes and KEGG pathways involved in transition from healthy to precancer to cancer |
| Tissue | Disease Stage | Enriched GO biological Processes |
| Colorectum | AD |  |
| Colorectum | SER |  |
| Colorectum | MSS |  |
| Colorectum | MSI-H |  |
| Colorectum | FAP |  |
| ∗Top 15 enriched GO BP terms are showed in the bar plot of each disease state in each tissue. Each row represents a significant GO biological process which is colored according to the -log10(p.adjust). |
| Page: 1 2 3 4 5 6 7 8 9 |
| GO ID | Tissue | Disease Stage | Description | Gene Ratio | Bg Ratio | pvalue | p.adjust | Count |
| GO:000697914 | Breast | IDC | response to oxidative stress | 83/1434 | 446/18723 | 2.36e-14 | 7.06e-12 | 83 |
| GO:190288214 | Breast | IDC | regulation of response to oxidative stress | 16/1434 | 98/18723 | 3.06e-03 | 2.60e-02 | 16 |
| GO:000697924 | Breast | DCIS | response to oxidative stress | 82/1390 | 446/18723 | 1.22e-14 | 3.85e-12 | 82 |
| GO:190288223 | Breast | DCIS | regulation of response to oxidative stress | 16/1390 | 98/18723 | 2.24e-03 | 2.05e-02 | 16 |
| GO:00463953 | Liver | NAFLD | carboxylic acid catabolic process | 73/1882 | 236/18723 | 4.16e-19 | 1.22e-15 | 73 |
| GO:00160544 | Liver | NAFLD | organic acid catabolic process | 73/1882 | 240/18723 | 1.20e-18 | 2.34e-15 | 73 |
| GO:00442825 | Liver | NAFLD | small molecule catabolic process | 91/1882 | 376/18723 | 8.96e-16 | 1.31e-12 | 91 |
| GO:00066316 | Liver | NAFLD | fatty acid metabolic process | 92/1882 | 390/18723 | 3.38e-15 | 3.29e-12 | 92 |
| GO:00723295 | Liver | NAFLD | monocarboxylic acid catabolic process | 39/1882 | 122/18723 | 2.40e-11 | 8.77e-09 | 39 |
| GO:00090626 | Liver | NAFLD | fatty acid catabolic process | 34/1882 | 100/18723 | 6.81e-11 | 1.99e-08 | 34 |
| GO:00193956 | Liver | NAFLD | fatty acid oxidation | 33/1882 | 103/18723 | 7.58e-10 | 1.53e-07 | 33 |
| GO:00442425 | Liver | NAFLD | cellular lipid catabolic process | 52/1882 | 214/18723 | 1.15e-09 | 2.17e-07 | 52 |
| GO:00550883 | Liver | NAFLD | lipid homeostasis | 44/1882 | 167/18723 | 1.48e-09 | 2.54e-07 | 44 |
| GO:00344405 | Liver | NAFLD | lipid oxidation | 33/1882 | 108/18723 | 2.96e-09 | 4.56e-07 | 33 |
| GO:00302585 | Liver | NAFLD | lipid modification | 49/1882 | 212/18723 | 1.97e-08 | 2.17e-06 | 49 |
| GO:00160426 | Liver | NAFLD | lipid catabolic process | 63/1882 | 320/18723 | 1.35e-07 | 1.02e-05 | 63 |
| GO:00066356 | Liver | NAFLD | fatty acid beta-oxidation | 23/1882 | 74/18723 | 5.09e-07 | 3.07e-05 | 23 |
| GO:00069797 | Liver | NAFLD | response to oxidative stress | 78/1882 | 446/18723 | 7.85e-07 | 4.29e-05 | 78 |
| GO:0033540 | Liver | NAFLD | fatty acid beta-oxidation using acyl-CoA oxidase | 5/1882 | 12/18723 | 4.41e-03 | 3.57e-02 | 5 |
| GO:000697922 | Liver | HCC | response to oxidative stress | 281/7958 | 446/18723 | 9.75e-19 | 1.24e-16 | 281 |
| Page: 1 2 |
| Pathway ID | Tissue | Disease Stage | Description | Gene Ratio | Bg Ratio | pvalue | p.adjust | qvalue | Count |
| hsa033206 | Liver | NAFLD | PPAR signaling pathway | 25/1043 | 75/8465 | 1.61e-06 | 6.62e-05 | 5.33e-05 | 25 |
| hsa04146 | Liver | NAFLD | Peroxisome | 19/1043 | 82/8465 | 4.37e-03 | 4.10e-02 | 3.30e-02 | 19 |
| hsa0332011 | Liver | NAFLD | PPAR signaling pathway | 25/1043 | 75/8465 | 1.61e-06 | 6.62e-05 | 5.33e-05 | 25 |
| hsa041461 | Liver | NAFLD | Peroxisome | 19/1043 | 82/8465 | 4.37e-03 | 4.10e-02 | 3.30e-02 | 19 |
| hsa041464 | Liver | HCC | Peroxisome | 58/4020 | 82/8465 | 1.57e-05 | 1.05e-04 | 5.85e-05 | 58 |
| hsa033204 | Liver | HCC | PPAR signaling pathway | 48/4020 | 75/8465 | 2.83e-03 | 9.37e-03 | 5.21e-03 | 48 |
| hsa001202 | Liver | HCC | Primary bile acid biosynthesis | 14/4020 | 17/8465 | 3.49e-03 | 1.12e-02 | 6.22e-03 | 14 |
| hsa041465 | Liver | HCC | Peroxisome | 58/4020 | 82/8465 | 1.57e-05 | 1.05e-04 | 5.85e-05 | 58 |
| hsa033205 | Liver | HCC | PPAR signaling pathway | 48/4020 | 75/8465 | 2.83e-03 | 9.37e-03 | 5.21e-03 | 48 |
| hsa001203 | Liver | HCC | Primary bile acid biosynthesis | 14/4020 | 17/8465 | 3.49e-03 | 1.12e-02 | 6.22e-03 | 14 |
| Page: 1 |
Top |
Cell-cell communication analysis |
| Identification of potential cell-cell interactions between two cell types and their ligand-receptor pairs for different disease states |
| Ligand | Receptor | LRpair | Pathway | Tissue | Disease Stage |
| Page: 1 |
Top |
Single-cell gene regulatory network inference analysis |
| Find out the significant the regulons (TFs) and the target genes of each regulon across cell types for different disease states |
| TF | Cell Type | Tissue | Disease Stage | Target Gene | RSS | Regulon Activity |
| ∗The dot plots of a searched regulon are shown for all cell subpopulations in each disease state of each tissue based on the regulon specific score inferred using pySCENIC and by calculating the average expression. |
| Page: 1 |
Top |
Somatic mutation of malignant transformation related genes |
| Annotation of somatic variants for genes involved in malignant transformation |
| Hugo Symbol | Variant Class | Variant Classification | dbSNP RS | HGVSc | HGVSp | HGVSp Short | SWISSPROT | BIOTYPE | SIFT | PolyPhen | Tumor Sample Barcode | Tissue | Histology | Sex | Age | Stage | Therapy Types | Drugs | Outcome |
| ACOX2 | SNV | Missense_Mutation | c.304N>A | p.Glu102Lys | p.E102K | Q99424 | protein_coding | deleterious(0.02) | possibly_damaging(0.558) | TCGA-AC-A23H-01 | Breast | breast invasive carcinoma | Female | >=65 | I/II | Unknown | Unknown | PD | |
| ACOX2 | SNV | Missense_Mutation | novel | c.1783N>A | p.Ala595Thr | p.A595T | Q99424 | protein_coding | deleterious(0) | benign(0.22) | TCGA-AO-A128-01 | Breast | breast invasive carcinoma | Female | <65 | I/II | Chemotherapy | doxorubicin | SD |
| ACOX2 | SNV | Missense_Mutation | c.1601A>G | p.Gln534Arg | p.Q534R | Q99424 | protein_coding | tolerated(0.53) | benign(0.007) | TCGA-AR-A251-01 | Breast | breast invasive carcinoma | Female | <65 | III/IV | Chemotherapy | doxorubicin | SD | |
| ACOX2 | insertion | Frame_Shift_Ins | novel | c.251_252insCCATTTACATCTAGGTAGTCATAGGTTCATATGCTCCGAGG | p.Phe85HisfsTer19 | p.F85Hfs*19 | Q99424 | protein_coding | TCGA-A8-A090-01 | Breast | breast invasive carcinoma | Female | >=65 | I/II | Unknown | Unknown | SD | ||
| ACOX2 | insertion | Nonsense_Mutation | novel | c.476_477insACATAAGAGAGAGACATGAGCCGGGTGCGGT | p.Thr160HisfsTer6 | p.T160Hfs*6 | Q99424 | protein_coding | TCGA-BH-A0GY-01 | Breast | breast invasive carcinoma | Female | >=65 | I/II | Chemotherapy | cyotxan | SD | ||
| ACOX2 | SNV | Missense_Mutation | rs762372178 | c.1474G>A | p.Asp492Asn | p.D492N | Q99424 | protein_coding | tolerated(0.16) | benign(0.354) | TCGA-2W-A8YY-01 | Cervix | cervical & endocervical cancer | Female | <65 | I/II | Chemotherapy | cisplatin | CR |
| ACOX2 | SNV | Missense_Mutation | c.742N>A | p.Asp248Asn | p.D248N | Q99424 | protein_coding | tolerated(0.25) | benign(0.011) | TCGA-C5-A1BQ-01 | Cervix | cervical & endocervical cancer | Female | >=65 | III/IV | Chemotherapy | cisplatin | CR | |
| ACOX2 | SNV | Missense_Mutation | c.1464N>C | p.Gln488His | p.Q488H | Q99424 | protein_coding | deleterious(0.03) | benign(0.009) | TCGA-JW-A5VL-01 | Cervix | cervical & endocervical cancer | Female | <65 | I/II | Unknown | Unknown | SD | |
| ACOX2 | SNV | Missense_Mutation | novel | c.1403N>T | p.Arg468Ile | p.R468I | Q99424 | protein_coding | tolerated(0.1) | benign(0.045) | TCGA-AA-A00N-01 | Colorectum | colon adenocarcinoma | Male | >=65 | I/II | Unknown | Unknown | PD |
| ACOX2 | SNV | Missense_Mutation | c.1331N>G | p.Tyr444Cys | p.Y444C | Q99424 | protein_coding | deleterious(0.01) | possibly_damaging(0.894) | TCGA-AD-6964-01 | Colorectum | colon adenocarcinoma | Male | <65 | III/IV | Chemotherapy | folfox | PD |
| Page: 1 2 3 4 5 6 |
Top |
Related drugs of malignant transformation related genes |
| Identification of chemicals and drugs interact with genes involved in malignant transfromation |
| (DGIdb 4.0) |
| Entrez ID | Symbol | Category | Interaction Types | Drug Claim Name | Drug Name | PMIDs |
| Page: 1 |

Copyright 2023-Present -The University of Texas Health Science Center at Houston |