Schematic overview of the cellular and molecular mechanisms involved in the cancer progression, including the proposed cellular and molecular mechanisms in cancer cells trajectory. AT1: alveolar type 1 cells; AT2: alveolar type 2 cells; AAH: atypical adenomatous hyperplasia; AIS: adenocarcinoma in situ; MIA: minimally invasive adenocarcinoma; IA: invasive adenocarcinoma; EMT: epithelial-mesenchymal transition

Home

Download

Statistics

Help

Contact

Center for Computational Systems Medicine
leaf

Gene summary

leaf

Malignant transformation analysis

leaf

Malignant transformation related pathway analysis

leaf

Cell-cell communication analysis

leaf

Single-cell gene regulatory network inference analysis

leaf

Somatic mutation of malignant transformation related genes

leaf

Related drugs of malignant transformation related genes

Gene: ACOT9

Gene summary for ACOT9

check button Gene summary.

Gene informationSpeciesHuman
Gene symbol

ACOT9

Gene ID

23597

Gene nameacyl-CoA thioesterase 9
Gene AliasACATE2
CytomapXp22.11
Gene Typeprotein-coding
GO ID

GO:0006139

UniProtAcc

Q9Y305


Top

Malignant transformation analysis

check button Identification of the aberrant gene expression in precancerous and cancerous lesions by comparing the gene expression of stem-like cells in diseased tissues with normal stem cells
check button Malignant transformation involving gene list.
Entrez IDSymbolReplicatesSpeciesOrganTissueAdj P-valueLog2FCMalignancy
23597ACOT9LZE4THumanEsophagusESCC7.14e-143.87e-010.0811
23597ACOT9LZE7THumanEsophagusESCC2.65e-084.58e-010.0667
23597ACOT9LZE8THumanEsophagusESCC5.54e-062.95e-010.067
23597ACOT9LZE22THumanEsophagusESCC3.24e-062.69e-010.068
23597ACOT9LZE24THumanEsophagusESCC1.37e-048.57e-020.0596
23597ACOT9LZE6THumanEsophagusESCC2.19e-062.20e-010.0845
23597ACOT9P1T-EHumanEsophagusESCC1.78e-041.76e-010.0875
23597ACOT9P2T-EHumanEsophagusESCC1.04e-103.21e-010.1177
23597ACOT9P4T-EHumanEsophagusESCC5.82e-193.51e-010.1323
23597ACOT9P5T-EHumanEsophagusESCC5.91e-245.43e-010.1327
23597ACOT9P8T-EHumanEsophagusESCC6.63e-325.90e-010.0889
23597ACOT9P9T-EHumanEsophagusESCC8.51e-102.19e-010.1131
23597ACOT9P10T-EHumanEsophagusESCC3.49e-142.53e-010.116
23597ACOT9P11T-EHumanEsophagusESCC1.07e-166.88e-010.1426
23597ACOT9P12T-EHumanEsophagusESCC9.43e-194.38e-010.1122
23597ACOT9P15T-EHumanEsophagusESCC1.06e-081.96e-010.1149
23597ACOT9P16T-EHumanEsophagusESCC1.48e-183.33e-010.1153
23597ACOT9P17T-EHumanEsophagusESCC2.40e-093.50e-010.1278
23597ACOT9P19T-EHumanEsophagusESCC2.98e-111.74e+000.1662
23597ACOT9P20T-EHumanEsophagusESCC7.13e-048.86e-020.1124
Page: 1 2 3 4 5 6 

check button Transcriptomic changes along malignancy continuum.
TissueExpression DynamicsAbbreviation
EsophagusThe image shows the transcriptomic changes along malignancy continuum.log2FC in expression of this searched gene in stem-like cells from each diseased tissue sample relative to stem-like cells in normal samples in each tissue plotted against the malignancy continuum. Samples are colored based on if they are from different disease stage.
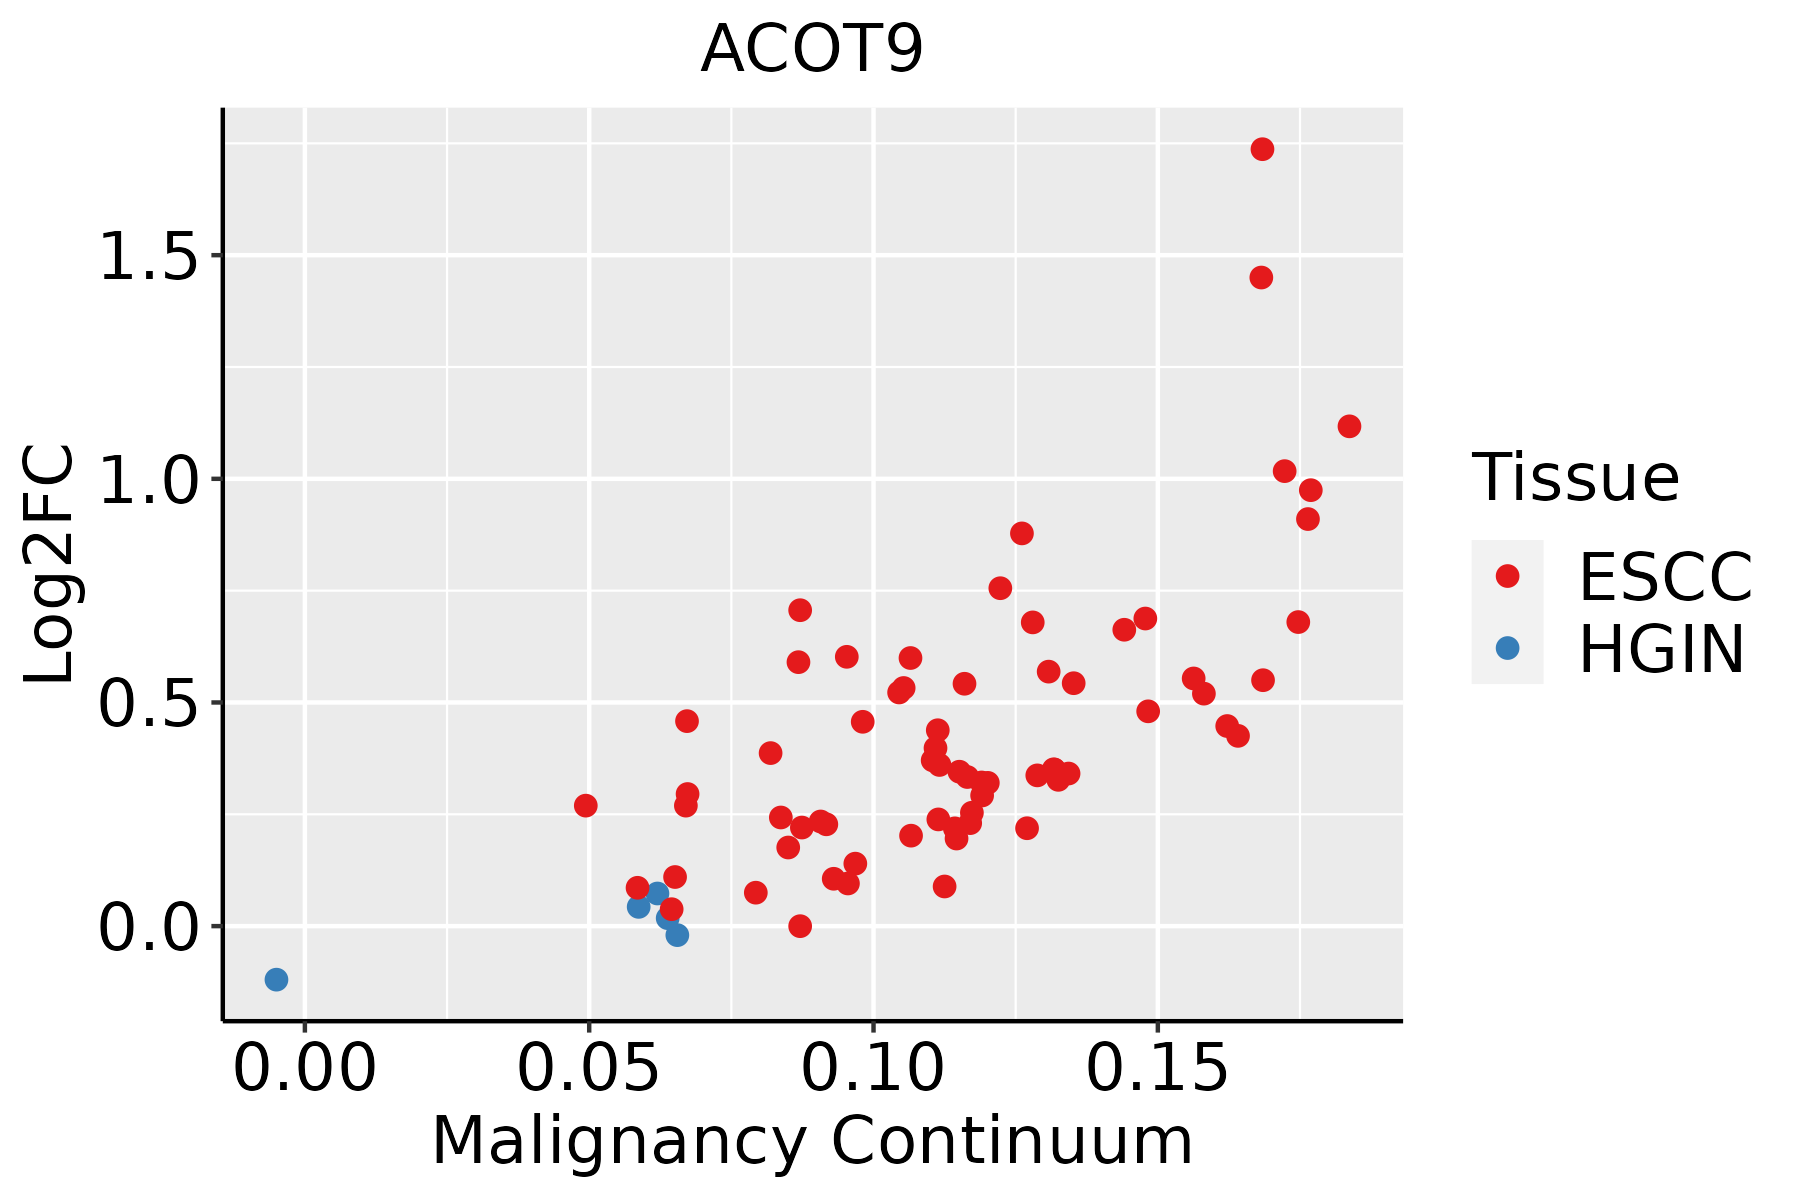
ESCC: Esophageal squamous cell carcinoma
HGIN: High-grade intraepithelial neoplasias
LGIN: Low-grade intraepithelial neoplasias
LiverThe image shows the transcriptomic changes along malignancy continuum.log2FC in expression of this searched gene in stem-like cells from each diseased tissue sample relative to stem-like cells in normal samples in each tissue plotted against the malignancy continuum. Samples are colored based on if they are from different disease stage.
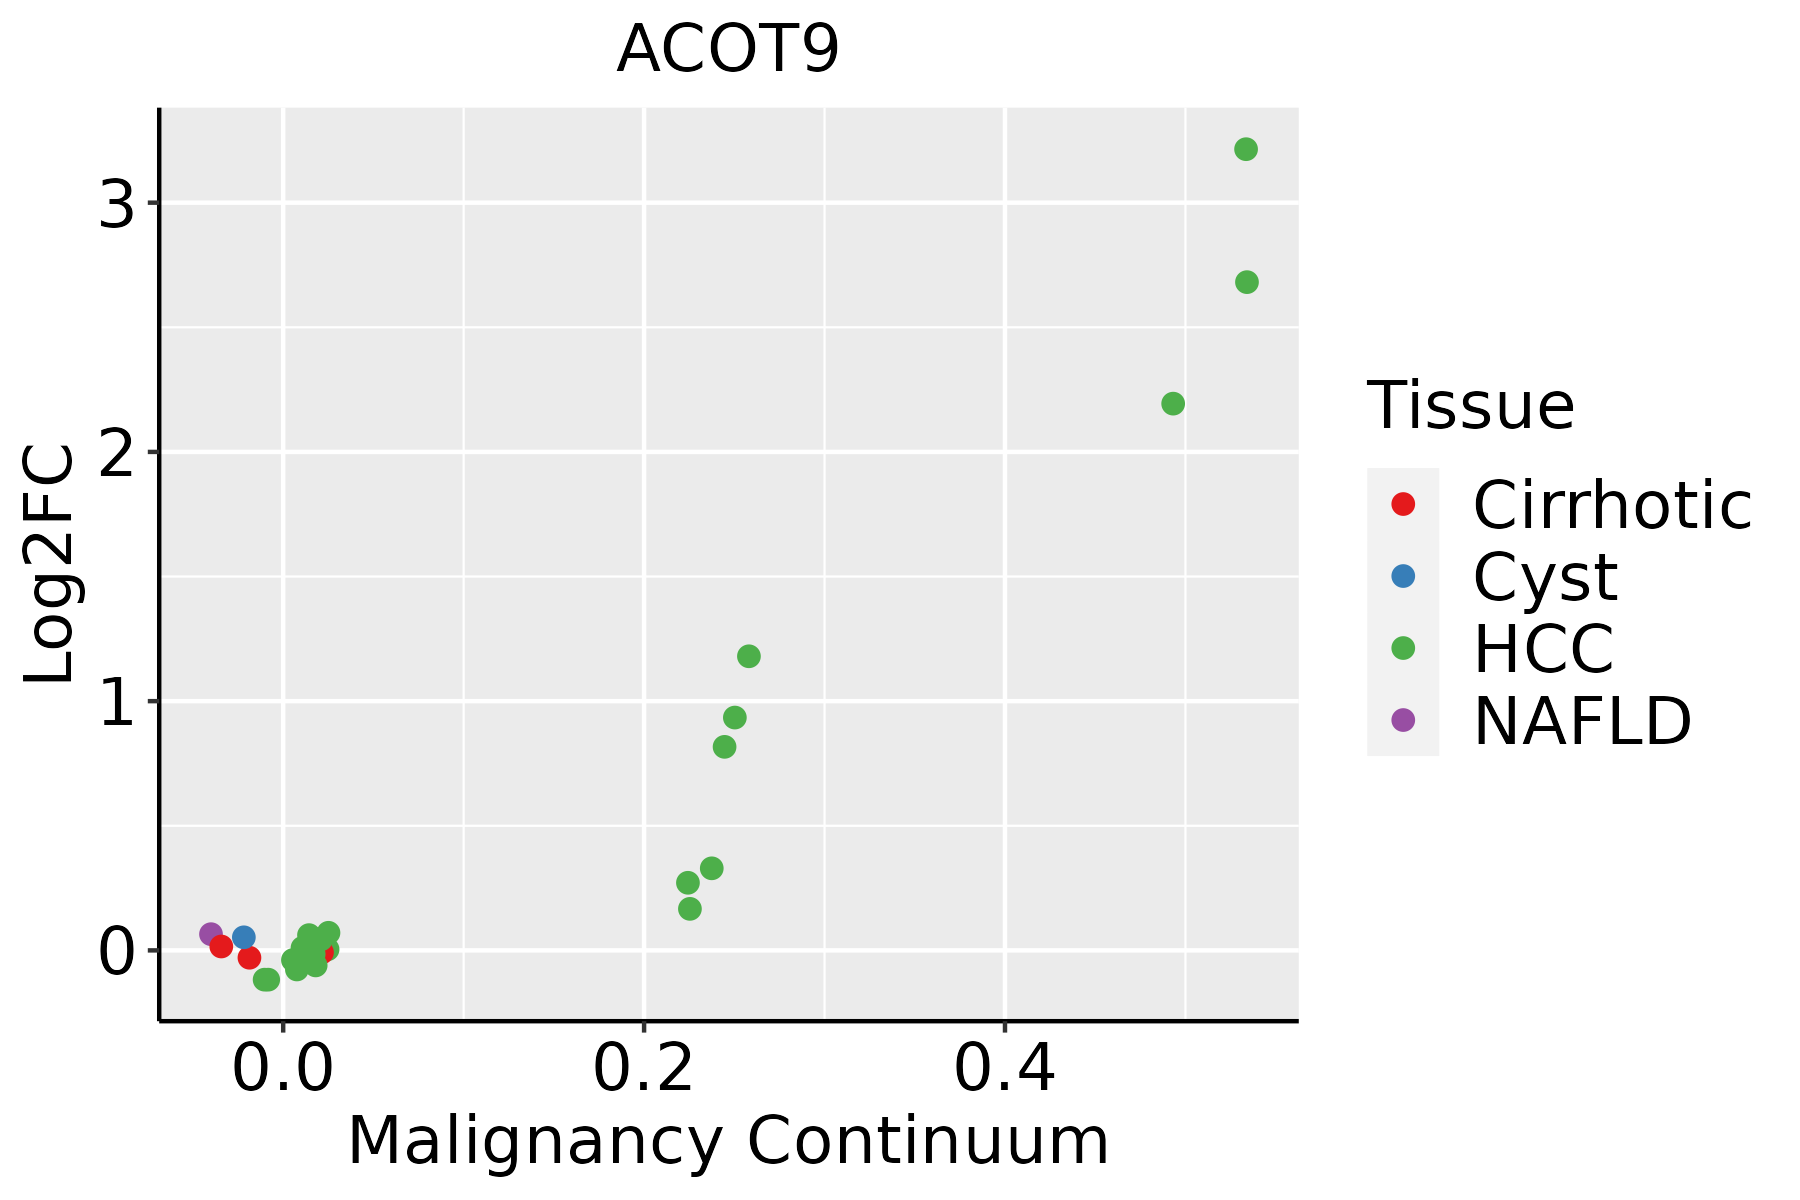
HCC: Hepatocellular carcinoma
NAFLD: Non-alcoholic fatty liver disease
Oral CavityThe image shows the transcriptomic changes along malignancy continuum.log2FC in expression of this searched gene in stem-like cells from each diseased tissue sample relative to stem-like cells in normal samples in each tissue plotted against the malignancy continuum. Samples are colored based on if they are from different disease stage.
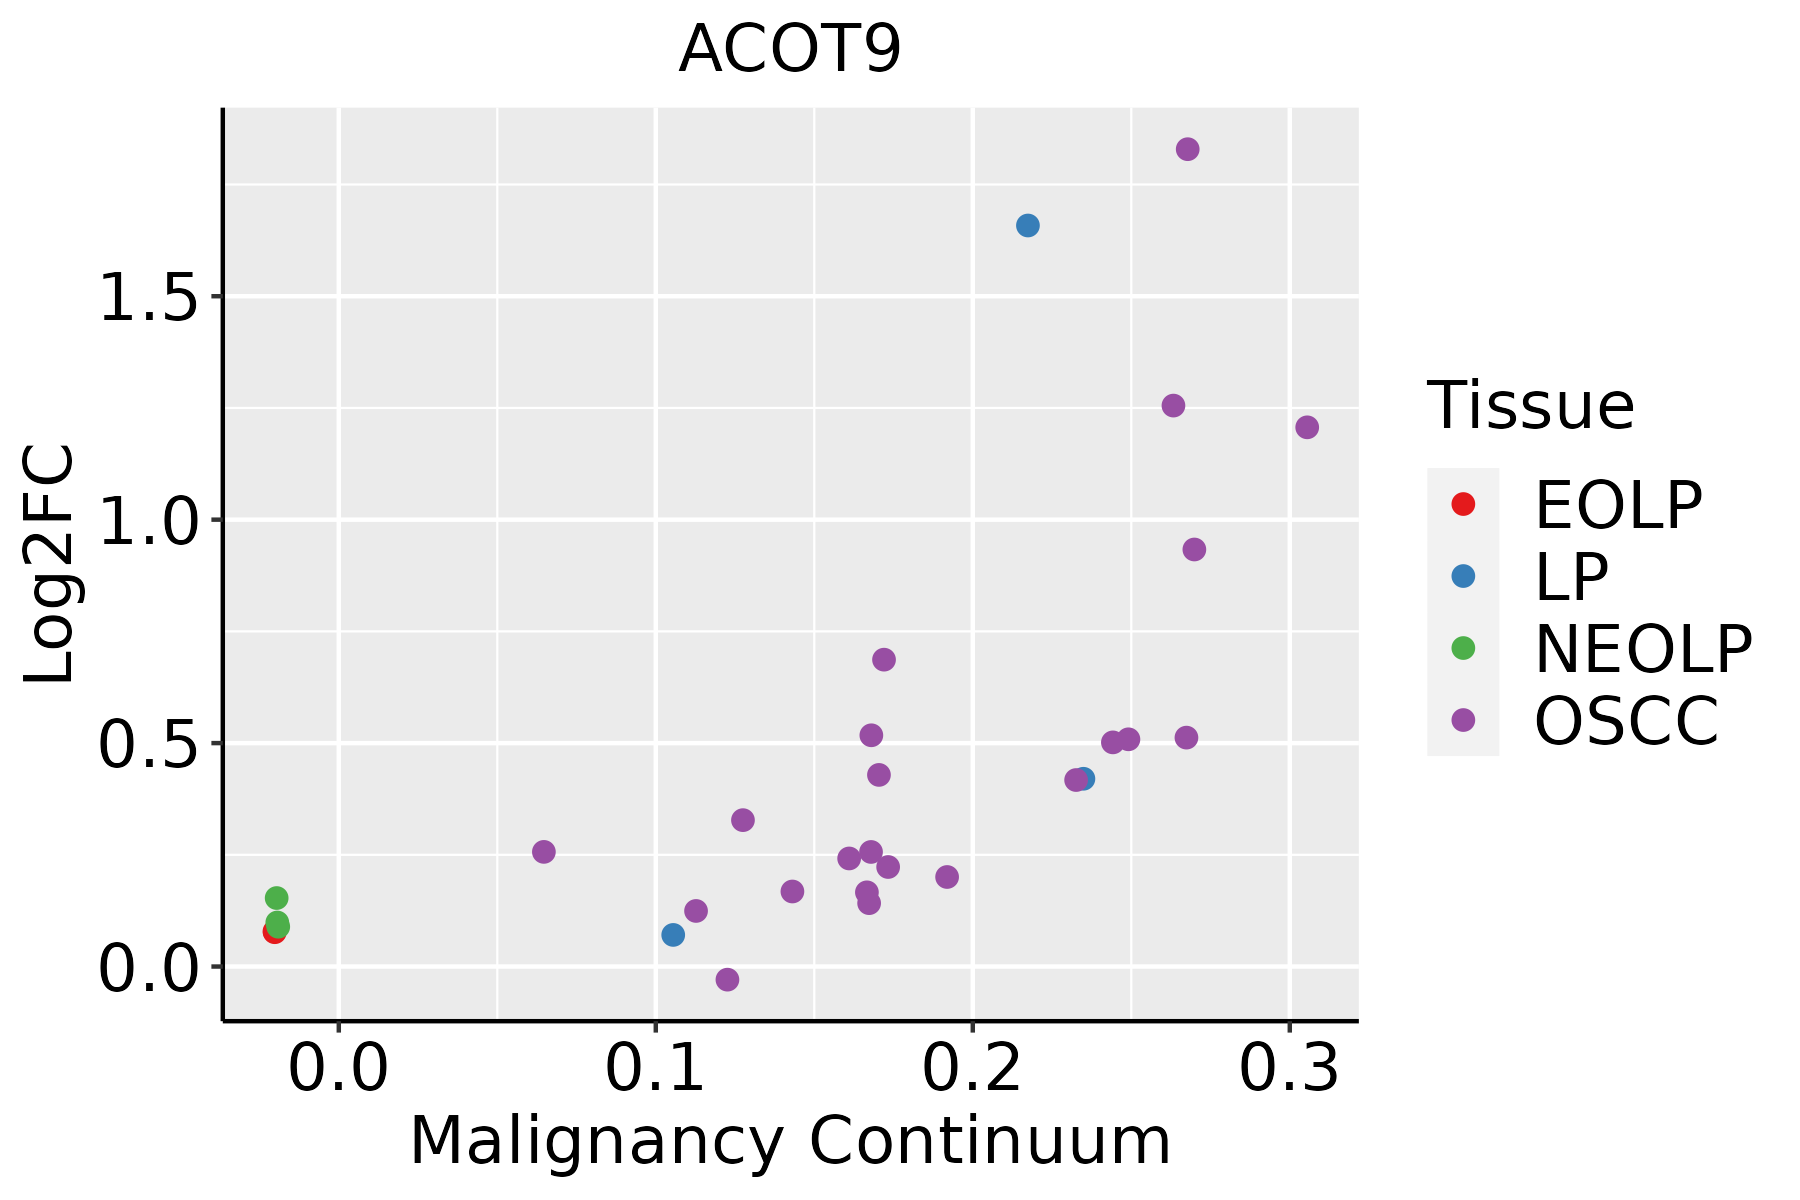
EOLP: Erosive Oral lichen planus
LP: leukoplakia
NEOLP: Non-erosive oral lichen planus
OSCC: Oral squamous cell carcinoma
SkinThe image shows the transcriptomic changes along malignancy continuum.log2FC in expression of this searched gene in stem-like cells from each diseased tissue sample relative to stem-like cells in normal samples in each tissue plotted against the malignancy continuum. Samples are colored based on if they are from different disease stage.
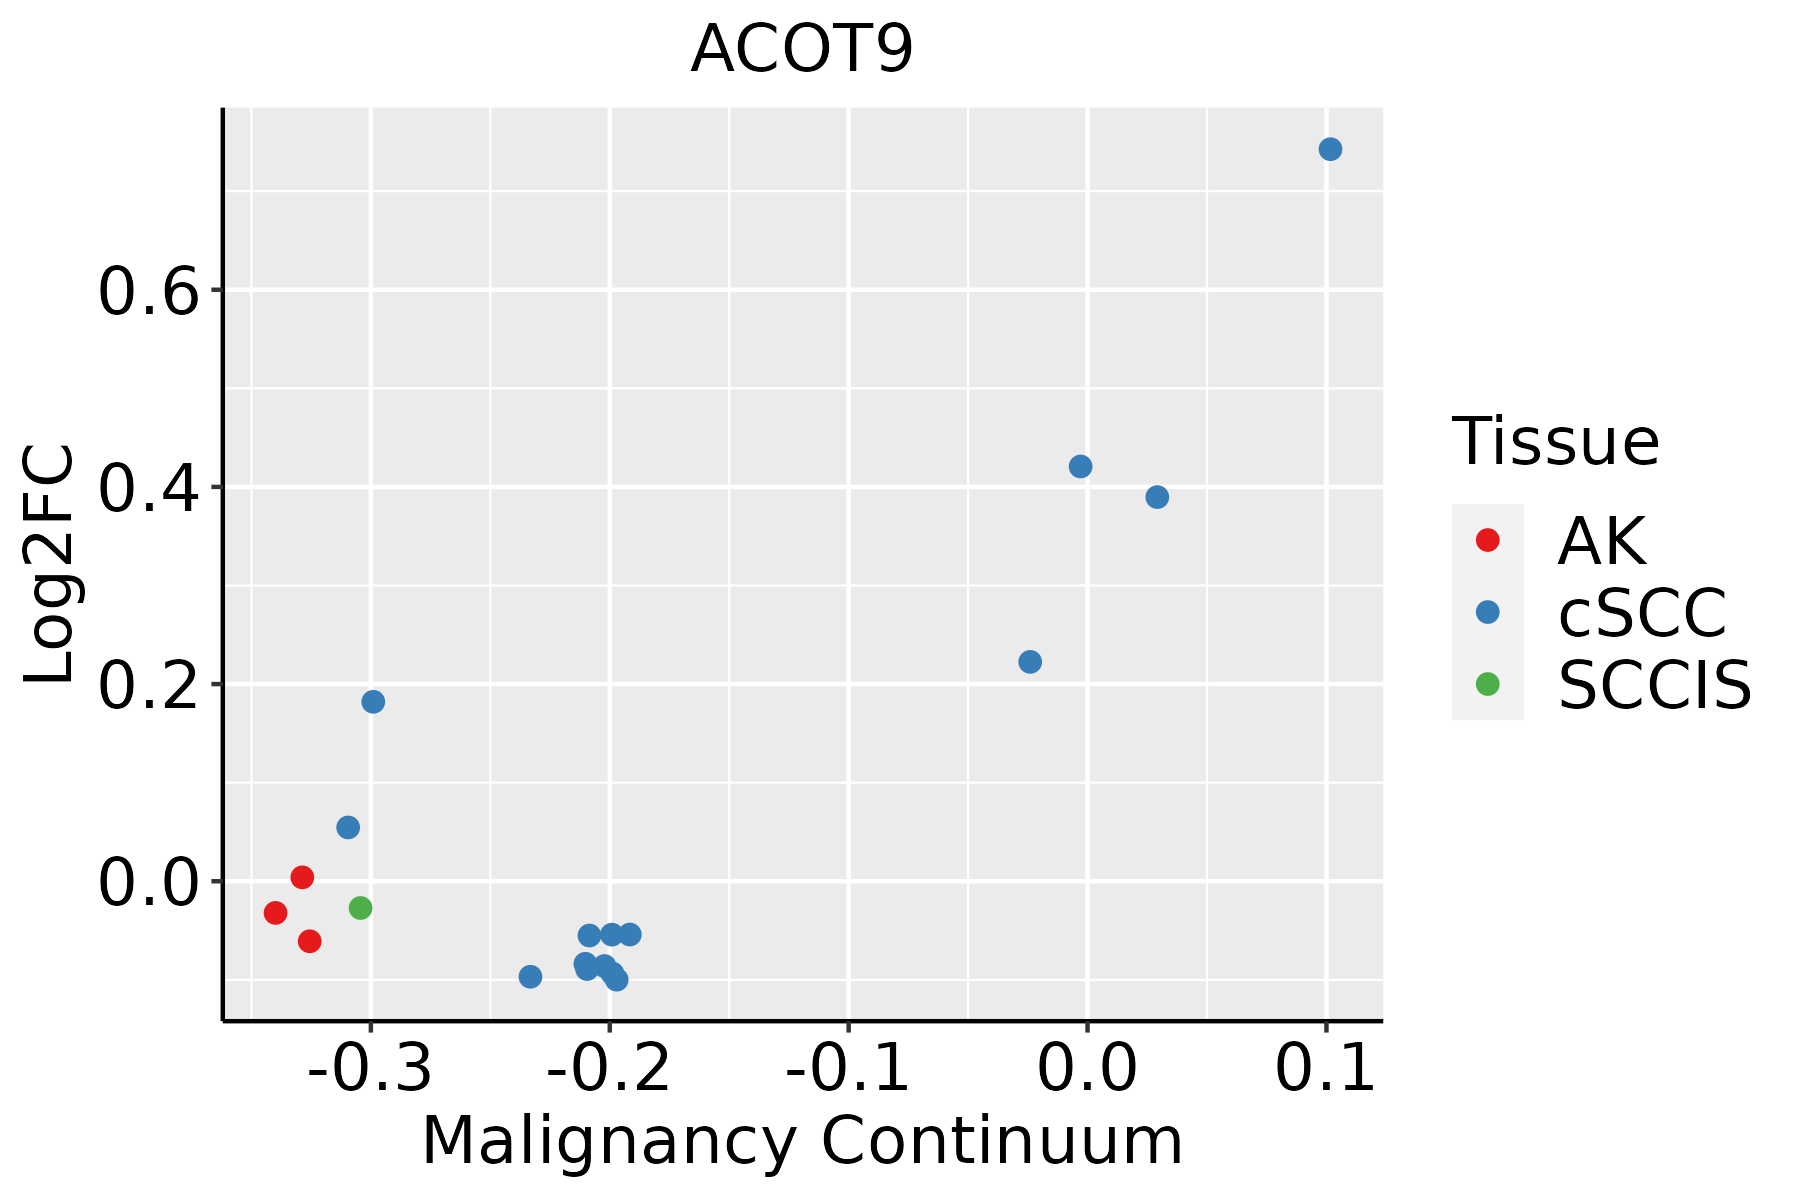
AK: Actinic keratosis
cSCC: Cutaneous squamous cell carcinoma
SCCIS:squamous cell carcinoma in situ
ThyroidThe image shows the transcriptomic changes along malignancy continuum.log2FC in expression of this searched gene in stem-like cells from each diseased tissue sample relative to stem-like cells in normal samples in each tissue plotted against the malignancy continuum. Samples are colored based on if they are from different disease stage.ATC: Anaplastic thyroid cancer
HT: Hashimoto's thyroiditis
PTC: Papillary thyroid cancer
∗log2FC in expression of this searched gene in stem-like cells from each diseased tissue sample relative to stem-like cells in normal samples in each tissue plotted against the malignancy continuum. Samples are colored based on if they are from different disease stage.

Top

Malignant transformation related pathway analysis

check buttonFind out the enriched GO biological processes and KEGG pathways involved in transition from healthy to precancer to cancer
check button Figure of enriched GO biological processes.
TissueDisease StageEnriched GO biological Processes
ColorectumADGO analysis - Figure of enriched GO biological processes: Top 15 enriched GO BP terms are showed in the bar plot of each disease state in each tissue. Each row represents a significant GO biological process which is colored according to the -log10(p.adjust).
ColorectumSERGO analysis - Figure of enriched GO biological processes: Top 15 enriched GO BP terms are showed in the bar plot of each disease state in each tissue. Each row represents a significant GO biological process which is colored according to the -log10(p.adjust).
ColorectumMSSGO analysis - Figure of enriched GO biological processes: Top 15 enriched GO BP terms are showed in the bar plot of each disease state in each tissue. Each row represents a significant GO biological process which is colored according to the -log10(p.adjust).
ColorectumMSI-HGO analysis - Figure of enriched GO biological processes: Top 15 enriched GO BP terms are showed in the bar plot of each disease state in each tissue. Each row represents a significant GO biological process which is colored according to the -log10(p.adjust).
ColorectumFAPGO analysis - Figure of enriched GO biological processes: Top 15 enriched GO BP terms are showed in the bar plot of each disease state in each tissue. Each row represents a significant GO biological process which is colored according to the -log10(p.adjust).
∗Top 15 enriched GO BP terms are showed in the bar plot of each disease state in each tissue. Each row represents a significant GO biological process which is colored according to the -log10(p.adjust).
Page: 1 2 3 4 5 6 7 8 9 

check button Enriched GO biological processes.
GO IDTissueDisease StageDescriptionGene RatioBg Ratiopvaluep.adjustCount
GO:0006753110EsophagusESCCnucleoside phosphate metabolic process288/8552497/187231.80e-083.50e-07288
GO:0019693111EsophagusESCCribose phosphate metabolic process234/8552396/187234.24e-087.76e-07234
GO:0009117111EsophagusESCCnucleotide metabolic process282/8552489/187234.70e-088.50e-07282
GO:00067906EsophagusESCCsulfur compound metabolic process201/8552339/187232.64e-073.94e-06201
GO:0009259111EsophagusESCCribonucleotide metabolic process224/8552385/187234.41e-076.00e-06224
GO:0072521111EsophagusESCCpurine-containing compound metabolic process238/8552416/187231.20e-061.49e-05238
GO:0009150111EsophagusESCCpurine ribonucleotide metabolic process213/8552368/187231.40e-061.69e-05213
GO:0006163111EsophagusESCCpurine nucleotide metabolic process226/8552396/187232.81e-063.21e-05226
GO:00338655EsophagusESCCnucleoside bisphosphate metabolic process77/8552128/187236.71e-043.55e-0377
GO:00338755EsophagusESCCribonucleoside bisphosphate metabolic process77/8552128/187236.71e-043.55e-0377
GO:00340325EsophagusESCCpurine nucleoside bisphosphate metabolic process77/8552128/187236.71e-043.55e-0377
GO:00066374EsophagusESCCacyl-CoA metabolic process55/855296/187231.45e-024.71e-0255
GO:00353834EsophagusESCCthioester metabolic process55/855296/187231.45e-024.71e-0255
GO:000911722LiverHCCnucleotide metabolic process300/7958489/187231.61e-171.71e-15300
GO:000675322LiverHCCnucleoside phosphate metabolic process304/7958497/187231.78e-171.85e-15304
GO:001969322LiverHCCribose phosphate metabolic process248/7958396/187233.15e-162.70e-14248
GO:000925922LiverHCCribonucleotide metabolic process240/7958385/187232.07e-151.51e-13240
GO:000679021LiverHCCsulfur compound metabolic process212/7958339/187235.60e-143.39e-12212
GO:000915022LiverHCCpurine ribonucleotide metabolic process226/7958368/187231.36e-137.69e-12226
GO:007252122LiverHCCpurine-containing compound metabolic process250/7958416/187232.26e-131.24e-11250
Page: 1 2 3 4 

check button Enriched KEGG pathways.
Pathway IDTissueDisease StageDescriptionGene RatioBg Ratiopvaluep.adjustqvalueCount
Page: 1 

Top

Cell-cell communication analysis

check buttonIdentification of potential cell-cell interactions between two cell types and their ligand-receptor pairs for different disease states
LigandReceptorLRpairPathwayTissueDisease Stage
Page: 1 

Top

Single-cell gene regulatory network inference analysis

check buttonFind out the significant the regulons (TFs) and the target genes of each regulon across cell types for different disease states
TFCell TypeTissueDisease StageTarget GeneRSSRegulon Activity
∗The dot plots of a searched regulon are shown for all cell subpopulations in each disease state of each tissue based on the regulon specific score inferred using pySCENIC and by calculating the average expression.
Page: 1 

Top

Somatic mutation of malignant transformation related genes

check buttonAnnotation of somatic variants for genes involved in malignant transformation
Hugo SymbolVariant ClassVariant ClassificationdbSNP RSHGVScHGVSpHGVSp ShortSWISSPROTBIOTYPESIFTPolyPhenTumor Sample BarcodeTissueHistologySexAgeStageTherapy TypesDrugsOutcome
ACOT9SNVMissense_Mutationnovelc.86N>Gp.Pro29Argp.P29RQ9Y305protein_codingtolerated_low_confidence(0.21)benign(0.075)TCGA-AC-A8OP-01Breastbreast invasive carcinomaFemale>=65I/IIUnknownUnknownSD
ACOT9SNVMissense_Mutationnovelc.947N>Gp.Phe316Cysp.F316CQ9Y305protein_codingdeleterious(0)probably_damaging(0.987)TCGA-AR-A0U0-01Breastbreast invasive carcinomaFemale>=65I/IIUnknownUnknownSD
ACOT9SNVMissense_Mutationc.304C>Tp.Pro102Serp.P102SQ9Y305protein_codingdeleterious(0)probably_damaging(1)TCGA-BH-A0HF-01Breastbreast invasive carcinomaFemale>=65I/IIHormone TherapyarimidexSD
ACOT9SNVMissense_Mutationnovelc.845N>Gp.Thr282Serp.T282SQ9Y305protein_codingtolerated(0.54)benign(0.044)TCGA-PE-A5DC-01Breastbreast invasive carcinomaFemale>=65III/IVUnknownUnknownSD
ACOT9SNVMissense_Mutationnovelc.182N>Tp.Thr61Ilep.T61IQ9Y305protein_codingdeleterious(0.03)possibly_damaging(0.735)TCGA-2W-A8YY-01Cervixcervical & endocervical cancerFemale<65I/IIChemotherapycisplatinCR
ACOT9SNVMissense_Mutationnovelc.112N>Tp.His38Tyrp.H38YQ9Y305protein_codingtolerated_low_confidence(0.49)benign(0.058)TCGA-C5-A3HE-01Cervixcervical & endocervical cancerFemale<65I/IIUnknownUnknownPD
ACOT9SNVMissense_Mutationc.1225N>Cp.Glu409Glnp.E409QQ9Y305protein_codingtolerated(0.18)benign(0.361)TCGA-JW-A5VL-01Cervixcervical & endocervical cancerFemale<65I/IIUnknownUnknownSD
ACOT9SNVMissense_Mutationnovelc.806C>Ap.Thr269Asnp.T269NQ9Y305protein_codingdeleterious(0.04)benign(0.306)TCGA-VS-A959-01Cervixcervical & endocervical cancerFemale>=65I/IIUnknownUnknownSD
ACOT9SNVMissense_Mutationc.155A>Cp.Lys52Thrp.K52TQ9Y305protein_codingtolerated(0.11)benign(0.009)TCGA-CA-6717-01Colorectumcolon adenocarcinomaMale<65I/IIChemotherapyoxaliplatinCR
ACOT9SNVMissense_Mutationnovelc.100A>Cp.Ile34Leup.I34LQ9Y305protein_codingtolerated_low_confidence(0.71)benign(0)TCGA-A5-A1OF-01Endometriumuterine corpus endometrioid carcinomaFemale<65I/IIUnknownUnknownSD
Page: 1 2 3 4 

Top

Related drugs of malignant transformation related genes

check buttonIdentification of chemicals and drugs interact with genes involved in malignant transfromation
(DGIdb 4.0)
Entrez IDSymbolCategoryInteraction TypesDrug Claim NameDrug NamePMIDs
Page: 1