
|
|||||
|
 | |
| |
| |
| |
| |
| |
|
Gene: ACOT7 |
Gene summary for ACOT7 |
| Gene information | Species | Human | Gene symbol | ACOT7 | Gene ID | 11332 |
| Gene name | acyl-CoA thioesterase 7 | |
| Gene Alias | ACH1 | |
| Cytomap | 1p36.31 | |
| Gene Type | protein-coding | GO ID | GO:0001676 | UniProtAcc | O00154 |
Top |
Malignant transformation analysis |
| Identification of the aberrant gene expression in precancerous and cancerous lesions by comparing the gene expression of stem-like cells in diseased tissues with normal stem cells |
| Entrez ID | Symbol | Replicates | Species | Organ | Tissue | Adj P-value | Log2FC | Malignancy |
| 11332 | ACOT7 | HTA11_347_2000001011 | Human | Colorectum | AD | 2.66e-07 | 3.09e-01 | -0.1954 |
| 11332 | ACOT7 | HTA11_2112_2000001011 | Human | Colorectum | SER | 3.19e-02 | 7.49e-01 | -0.2196 |
| 11332 | ACOT7 | HTA11_83_2000001011 | Human | Colorectum | SER | 1.37e-03 | 4.01e-01 | -0.1526 |
| 11332 | ACOT7 | HTA11_1391_2000001011 | Human | Colorectum | AD | 7.02e-06 | 4.00e-01 | -0.059 |
| 11332 | ACOT7 | A015-C-203 | Human | Colorectum | FAP | 3.87e-03 | -1.11e-01 | -0.1294 |
| 11332 | ACOT7 | A015-C-104 | Human | Colorectum | FAP | 7.11e-05 | -1.45e-01 | -0.1899 |
| 11332 | ACOT7 | A002-C-016 | Human | Colorectum | FAP | 5.39e-03 | -6.30e-02 | 0.0521 |
| 11332 | ACOT7 | A002-C-116 | Human | Colorectum | FAP | 1.87e-03 | -9.70e-02 | -0.0452 |
| 11332 | ACOT7 | F072B | Human | Colorectum | FAP | 9.10e-04 | -1.27e-01 | 0.257 |
| 11332 | ACOT7 | LZE4T | Human | Esophagus | ESCC | 5.52e-10 | 3.66e-01 | 0.0811 |
| 11332 | ACOT7 | LZE7T | Human | Esophagus | ESCC | 1.35e-06 | 4.44e-01 | 0.0667 |
| 11332 | ACOT7 | LZE20T | Human | Esophagus | ESCC | 1.40e-02 | 1.38e-01 | 0.0662 |
| 11332 | ACOT7 | LZE6T | Human | Esophagus | ESCC | 5.75e-17 | 9.80e-01 | 0.0845 |
| 11332 | ACOT7 | P1T-E | Human | Esophagus | ESCC | 7.88e-05 | 2.39e-01 | 0.0875 |
| 11332 | ACOT7 | P2T-E | Human | Esophagus | ESCC | 3.37e-34 | 6.90e-01 | 0.1177 |
| 11332 | ACOT7 | P4T-E | Human | Esophagus | ESCC | 3.98e-22 | 6.00e-01 | 0.1323 |
| 11332 | ACOT7 | P5T-E | Human | Esophagus | ESCC | 6.58e-54 | 1.06e+00 | 0.1327 |
| 11332 | ACOT7 | P8T-E | Human | Esophagus | ESCC | 7.72e-10 | 2.28e-01 | 0.0889 |
| 11332 | ACOT7 | P9T-E | Human | Esophagus | ESCC | 6.43e-06 | 2.59e-01 | 0.1131 |
| 11332 | ACOT7 | P10T-E | Human | Esophagus | ESCC | 2.20e-13 | 1.95e-01 | 0.116 |
| Page: 1 2 3 4 5 6 |
| Tissue | Expression Dynamics | Abbreviation |
| Colorectum (GSE201348) |  | FAP: Familial adenomatous polyposis |
| CRC: Colorectal cancer | ||
| Colorectum (HTA11) |  | AD: Adenomas |
| SER: Sessile serrated lesions | ||
| MSI-H: Microsatellite-high colorectal cancer | ||
| MSS: Microsatellite stable colorectal cancer | ||
| Esophagus |  | ESCC: Esophageal squamous cell carcinoma |
| HGIN: High-grade intraepithelial neoplasias | ||
| LGIN: Low-grade intraepithelial neoplasias | ||
| Liver |  | HCC: Hepatocellular carcinoma |
| NAFLD: Non-alcoholic fatty liver disease | ||
| Oral Cavity |  | EOLP: Erosive Oral lichen planus |
| LP: leukoplakia | ||
| NEOLP: Non-erosive oral lichen planus | ||
| OSCC: Oral squamous cell carcinoma | ||
| Skin | 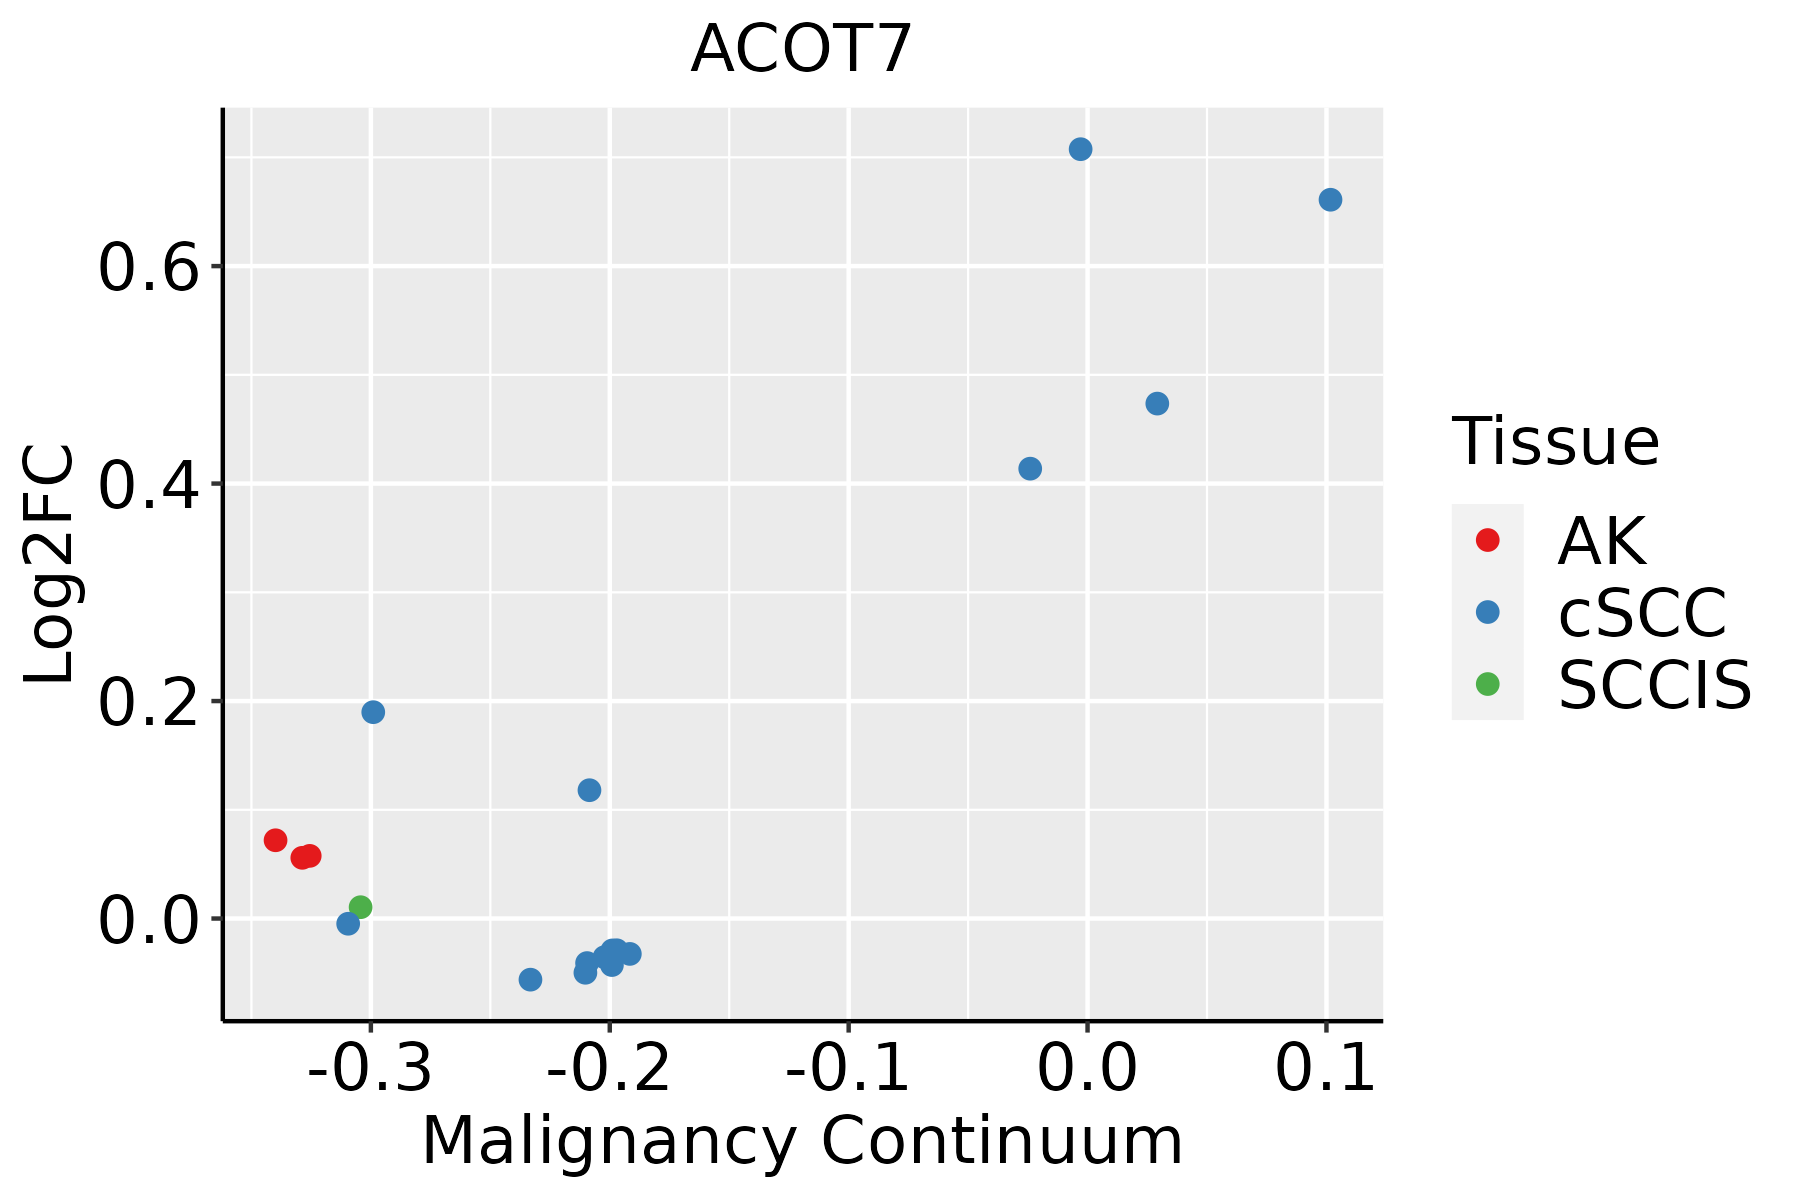 | AK: Actinic keratosis |
| cSCC: Cutaneous squamous cell carcinoma | ||
| SCCIS:squamous cell carcinoma in situ | ||
| Thyroid | 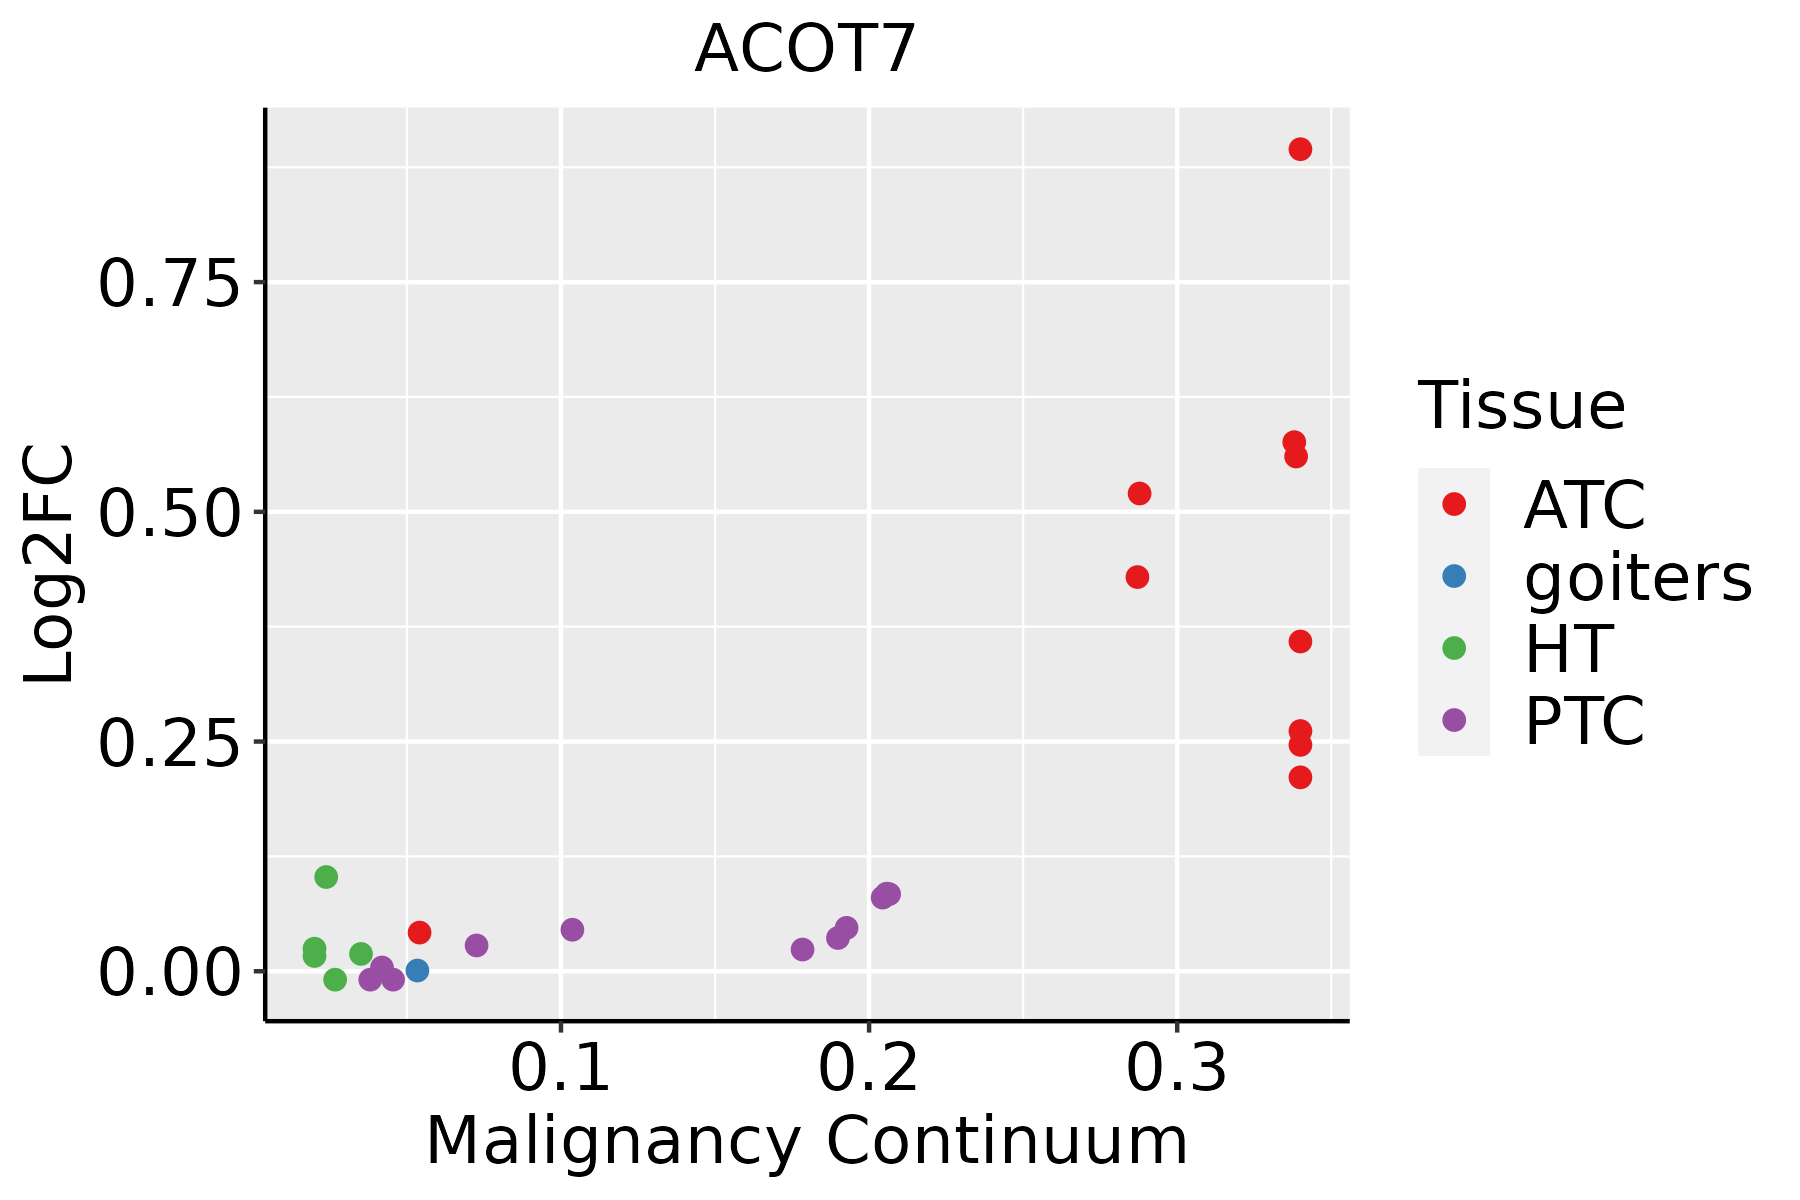 | ATC: Anaplastic thyroid cancer |
| HT: Hashimoto's thyroiditis | ||
| PTC: Papillary thyroid cancer |
| ∗log2FC in expression of this searched gene in stem-like cells from each diseased tissue sample relative to stem-like cells in normal samples in each tissue plotted against the malignancy continuum. Samples are colored based on if they are from different disease stage. |
Top |
Malignant transformation related pathway analysis |
| Find out the enriched GO biological processes and KEGG pathways involved in transition from healthy to precancer to cancer |
| Tissue | Disease Stage | Enriched GO biological Processes |
| Colorectum | AD |  |
| Colorectum | SER |  |
| Colorectum | MSS |  |
| Colorectum | MSI-H |  |
| Colorectum | FAP |  |
| ∗Top 15 enriched GO BP terms are showed in the bar plot of each disease state in each tissue. Each row represents a significant GO biological process which is colored according to the -log10(p.adjust). |
| Page: 1 2 3 4 5 6 7 8 9 |
| GO ID | Tissue | Disease Stage | Description | Gene Ratio | Bg Ratio | pvalue | p.adjust | Count |
| GO:0009150 | Colorectum | AD | purine ribonucleotide metabolic process | 142/3918 | 368/18723 | 4.29e-15 | 1.17e-12 | 142 |
| GO:0006163 | Colorectum | AD | purine nucleotide metabolic process | 149/3918 | 396/18723 | 1.08e-14 | 2.80e-12 | 149 |
| GO:0072521 | Colorectum | AD | purine-containing compound metabolic process | 153/3918 | 416/18723 | 4.34e-14 | 1.01e-11 | 153 |
| GO:0009259 | Colorectum | AD | ribonucleotide metabolic process | 144/3918 | 385/18723 | 5.25e-14 | 1.13e-11 | 144 |
| GO:0019693 | Colorectum | AD | ribose phosphate metabolic process | 145/3918 | 396/18723 | 3.01e-13 | 5.71e-11 | 145 |
| GO:0009117 | Colorectum | AD | nucleotide metabolic process | 168/3918 | 489/18723 | 2.20e-12 | 3.36e-10 | 168 |
| GO:0006753 | Colorectum | AD | nucleoside phosphate metabolic process | 169/3918 | 497/18723 | 4.99e-12 | 6.98e-10 | 169 |
| GO:0044270 | Colorectum | AD | cellular nitrogen compound catabolic process | 147/3918 | 451/18723 | 3.35e-09 | 2.23e-07 | 147 |
| GO:0046700 | Colorectum | AD | heterocycle catabolic process | 145/3918 | 445/18723 | 4.37e-09 | 2.84e-07 | 145 |
| GO:0034655 | Colorectum | AD | nucleobase-containing compound catabolic process | 133/3918 | 407/18723 | 1.56e-08 | 9.12e-07 | 133 |
| GO:0019439 | Colorectum | AD | aromatic compound catabolic process | 146/3918 | 467/18723 | 7.48e-08 | 3.84e-06 | 146 |
| GO:1901361 | Colorectum | AD | organic cyclic compound catabolic process | 153/3918 | 495/18723 | 8.23e-08 | 4.18e-06 | 153 |
| GO:0009152 | Colorectum | AD | purine ribonucleotide biosynthetic process | 64/3918 | 169/18723 | 3.09e-07 | 1.22e-05 | 64 |
| GO:0009260 | Colorectum | AD | ribonucleotide biosynthetic process | 66/3918 | 182/18723 | 1.25e-06 | 4.02e-05 | 66 |
| GO:0046390 | Colorectum | AD | ribose phosphate biosynthetic process | 67/3918 | 190/18723 | 3.21e-06 | 9.05e-05 | 67 |
| GO:0006164 | Colorectum | AD | purine nucleotide biosynthetic process | 66/3918 | 191/18723 | 8.22e-06 | 1.97e-04 | 66 |
| GO:0072522 | Colorectum | AD | purine-containing compound biosynthetic process | 68/3918 | 200/18723 | 1.12e-05 | 2.55e-04 | 68 |
| GO:0006631 | Colorectum | AD | fatty acid metabolic process | 114/3918 | 390/18723 | 5.58e-05 | 9.44e-04 | 114 |
| GO:1901293 | Colorectum | AD | nucleoside phosphate biosynthetic process | 80/3918 | 256/18723 | 6.31e-05 | 1.05e-03 | 80 |
| GO:0006790 | Colorectum | AD | sulfur compound metabolic process | 101/3918 | 339/18723 | 6.46e-05 | 1.07e-03 | 101 |
| Page: 1 2 3 4 5 6 7 8 9 10 11 12 13 14 |
| Pathway ID | Tissue | Disease Stage | Description | Gene Ratio | Bg Ratio | pvalue | p.adjust | qvalue | Count |
| hsa00062 | Colorectum | SER | Fatty acid elongation | 11/1580 | 27/8465 | 6.38e-03 | 3.68e-02 | 2.67e-02 | 11 |
| hsa000621 | Colorectum | SER | Fatty acid elongation | 11/1580 | 27/8465 | 6.38e-03 | 3.68e-02 | 2.67e-02 | 11 |
| hsa01040 | Liver | Cirrhotic | Biosynthesis of unsaturated fatty acids | 14/2530 | 27/8465 | 1.36e-02 | 4.25e-02 | 2.62e-02 | 14 |
| hsa010401 | Liver | Cirrhotic | Biosynthesis of unsaturated fatty acids | 14/2530 | 27/8465 | 1.36e-02 | 4.25e-02 | 2.62e-02 | 14 |
| hsa000622 | Liver | HCC | Fatty acid elongation | 20/4020 | 27/8465 | 4.58e-03 | 1.36e-02 | 7.55e-03 | 20 |
| hsa010402 | Liver | HCC | Biosynthesis of unsaturated fatty acids | 19/4020 | 27/8465 | 1.37e-02 | 3.33e-02 | 1.85e-02 | 19 |
| hsa0006211 | Liver | HCC | Fatty acid elongation | 20/4020 | 27/8465 | 4.58e-03 | 1.36e-02 | 7.55e-03 | 20 |
| hsa010403 | Liver | HCC | Biosynthesis of unsaturated fatty acids | 19/4020 | 27/8465 | 1.37e-02 | 3.33e-02 | 1.85e-02 | 19 |
| Page: 1 |
Top |
Cell-cell communication analysis |
| Identification of potential cell-cell interactions between two cell types and their ligand-receptor pairs for different disease states |
| Ligand | Receptor | LRpair | Pathway | Tissue | Disease Stage |
| Page: 1 |
Top |
Single-cell gene regulatory network inference analysis |
| Find out the significant the regulons (TFs) and the target genes of each regulon across cell types for different disease states |
| TF | Cell Type | Tissue | Disease Stage | Target Gene | RSS | Regulon Activity |
| ∗The dot plots of a searched regulon are shown for all cell subpopulations in each disease state of each tissue based on the regulon specific score inferred using pySCENIC and by calculating the average expression. |
| Page: 1 |
Top |
Somatic mutation of malignant transformation related genes |
| Annotation of somatic variants for genes involved in malignant transformation |
| Hugo Symbol | Variant Class | Variant Classification | dbSNP RS | HGVSc | HGVSp | HGVSp Short | SWISSPROT | BIOTYPE | SIFT | PolyPhen | Tumor Sample Barcode | Tissue | Histology | Sex | Age | Stage | Therapy Types | Drugs | Outcome |
| ACOT7 | SNV | Missense_Mutation | c.368A>G | p.His123Arg | p.H123R | O00154 | protein_coding | deleterious(0.01) | possibly_damaging(0.578) | TCGA-BH-A18G-01 | Breast | breast invasive carcinoma | Female | >=65 | I/II | Unknown | Unknown | SD | |
| ACOT7 | SNV | Missense_Mutation | novel | c.728N>A | p.Gly243Asp | p.G243D | O00154 | protein_coding | tolerated(0.08) | benign(0.273) | TCGA-E2-A2P5-01 | Breast | breast invasive carcinoma | Female | >=65 | III/IV | Hormone Therapy | arimidex | PD |
| ACOT7 | SNV | Missense_Mutation | rs201654646 | c.325C>T | p.Arg109Cys | p.R109C | O00154 | protein_coding | deleterious(0.03) | benign(0.121) | TCGA-DG-A2KK-01 | Cervix | cervical & endocervical cancer | Female | <65 | III/IV | Chemotherapy | cisplatin | SD |
| ACOT7 | SNV | Missense_Mutation | novel | c.228N>G | p.Ile76Met | p.I76M | O00154 | protein_coding | deleterious(0) | probably_damaging(0.923) | TCGA-JW-A5VL-01 | Cervix | cervical & endocervical cancer | Female | <65 | I/II | Unknown | Unknown | SD |
| ACOT7 | SNV | Missense_Mutation | rs746127296 | c.965N>A | p.Arg322His | p.R322H | O00154 | protein_coding | deleterious(0.01) | possibly_damaging(0.617) | TCGA-VS-A94Z-01 | Cervix | cervical & endocervical cancer | Female | <65 | I/II | Chemotherapy | cisplatin | CR |
| ACOT7 | SNV | Missense_Mutation | c.659N>A | p.Pro220Gln | p.P220Q | O00154 | protein_coding | tolerated(0.16) | benign(0.021) | TCGA-AA-3663-01 | Colorectum | colon adenocarcinoma | Male | <65 | I/II | Unknown | Unknown | SD | |
| ACOT7 | SNV | Missense_Mutation | rs781024703 | c.1090C>T | p.Arg364Trp | p.R364W | O00154 | protein_coding | deleterious(0) | probably_damaging(0.998) | TCGA-AA-3864-01 | Colorectum | colon adenocarcinoma | Male | >=65 | I/II | Unknown | Unknown | SD |
| ACOT7 | SNV | Missense_Mutation | novel | c.976N>A | p.Ala326Thr | p.A326T | O00154 | protein_coding | tolerated(0.17) | benign(0.097) | TCGA-AA-3877-01 | Colorectum | colon adenocarcinoma | Female | >=65 | I/II | Unknown | Unknown | SD |
| ACOT7 | SNV | Missense_Mutation | novel | c.377N>T | p.Ala126Val | p.A126V | O00154 | protein_coding | deleterious(0) | probably_damaging(1) | TCGA-AA-A010-01 | Colorectum | colon adenocarcinoma | Female | <65 | I/II | Chemotherapy | folinic | CR |
| ACOT7 | SNV | Missense_Mutation | c.761N>A | p.Met254Lys | p.M254K | O00154 | protein_coding | deleterious(0) | probably_damaging(0.952) | TCGA-AD-6895-01 | Colorectum | colon adenocarcinoma | Male | >=65 | III/IV | Unknown | Unknown | SD |
| Page: 1 2 3 4 |
Top |
Related drugs of malignant transformation related genes |
| Identification of chemicals and drugs interact with genes involved in malignant transfromation |
| (DGIdb 4.0) |
| Entrez ID | Symbol | Category | Interaction Types | Drug Claim Name | Drug Name | PMIDs |
| Page: 1 |

Copyright 2023-Present -The University of Texas Health Science Center at Houston |