
|
|||||
|
 | |
| |
| |
| |
| |
| |
|
Gene: ACOT13 |
Gene summary for ACOT13 |
| Gene information | Species | Human | Gene symbol | ACOT13 | Gene ID | 55856 |
| Gene name | acyl-CoA thioesterase 13 | |
| Gene Alias | HT012 | |
| Cytomap | 6p22.3 | |
| Gene Type | protein-coding | GO ID | GO:0001659 | UniProtAcc | Q9NPJ3 |
Top |
Malignant transformation analysis |
| Identification of the aberrant gene expression in precancerous and cancerous lesions by comparing the gene expression of stem-like cells in diseased tissues with normal stem cells |
| Entrez ID | Symbol | Replicates | Species | Organ | Tissue | Adj P-value | Log2FC | Malignancy |
| 55856 | ACOT13 | LZE4T | Human | Esophagus | ESCC | 1.61e-12 | 4.09e-01 | 0.0811 |
| 55856 | ACOT13 | LZE7T | Human | Esophagus | ESCC | 1.36e-07 | 6.01e-01 | 0.0667 |
| 55856 | ACOT13 | LZE20T | Human | Esophagus | ESCC | 1.54e-03 | 1.94e-01 | 0.0662 |
| 55856 | ACOT13 | LZE22D1 | Human | Esophagus | HGIN | 1.45e-02 | 1.76e-01 | 0.0595 |
| 55856 | ACOT13 | LZE22T | Human | Esophagus | ESCC | 2.14e-03 | 4.87e-01 | 0.068 |
| 55856 | ACOT13 | LZE24T | Human | Esophagus | ESCC | 1.20e-13 | 4.31e-01 | 0.0596 |
| 55856 | ACOT13 | LZE21T | Human | Esophagus | ESCC | 2.39e-03 | 2.68e-01 | 0.0655 |
| 55856 | ACOT13 | LZE6T | Human | Esophagus | ESCC | 5.43e-09 | 5.98e-01 | 0.0845 |
| 55856 | ACOT13 | P1T-E | Human | Esophagus | ESCC | 2.52e-07 | 4.72e-01 | 0.0875 |
| 55856 | ACOT13 | P2T-E | Human | Esophagus | ESCC | 5.66e-24 | 4.53e-01 | 0.1177 |
| 55856 | ACOT13 | P4T-E | Human | Esophagus | ESCC | 1.89e-55 | 1.24e+00 | 0.1323 |
| 55856 | ACOT13 | P5T-E | Human | Esophagus | ESCC | 7.97e-04 | -9.46e-04 | 0.1327 |
| 55856 | ACOT13 | P8T-E | Human | Esophagus | ESCC | 1.63e-12 | 2.71e-01 | 0.0889 |
| 55856 | ACOT13 | P9T-E | Human | Esophagus | ESCC | 7.33e-17 | 5.19e-01 | 0.1131 |
| 55856 | ACOT13 | P10T-E | Human | Esophagus | ESCC | 4.44e-13 | 2.79e-01 | 0.116 |
| 55856 | ACOT13 | P11T-E | Human | Esophagus | ESCC | 1.56e-07 | 3.80e-01 | 0.1426 |
| 55856 | ACOT13 | P12T-E | Human | Esophagus | ESCC | 8.66e-21 | 4.43e-01 | 0.1122 |
| 55856 | ACOT13 | P15T-E | Human | Esophagus | ESCC | 2.57e-16 | 3.83e-01 | 0.1149 |
| 55856 | ACOT13 | P16T-E | Human | Esophagus | ESCC | 4.57e-21 | 2.73e-01 | 0.1153 |
| 55856 | ACOT13 | P17T-E | Human | Esophagus | ESCC | 8.34e-17 | 7.77e-01 | 0.1278 |
| Page: 1 2 3 4 5 6 |
| Tissue | Expression Dynamics | Abbreviation |
| Esophagus | 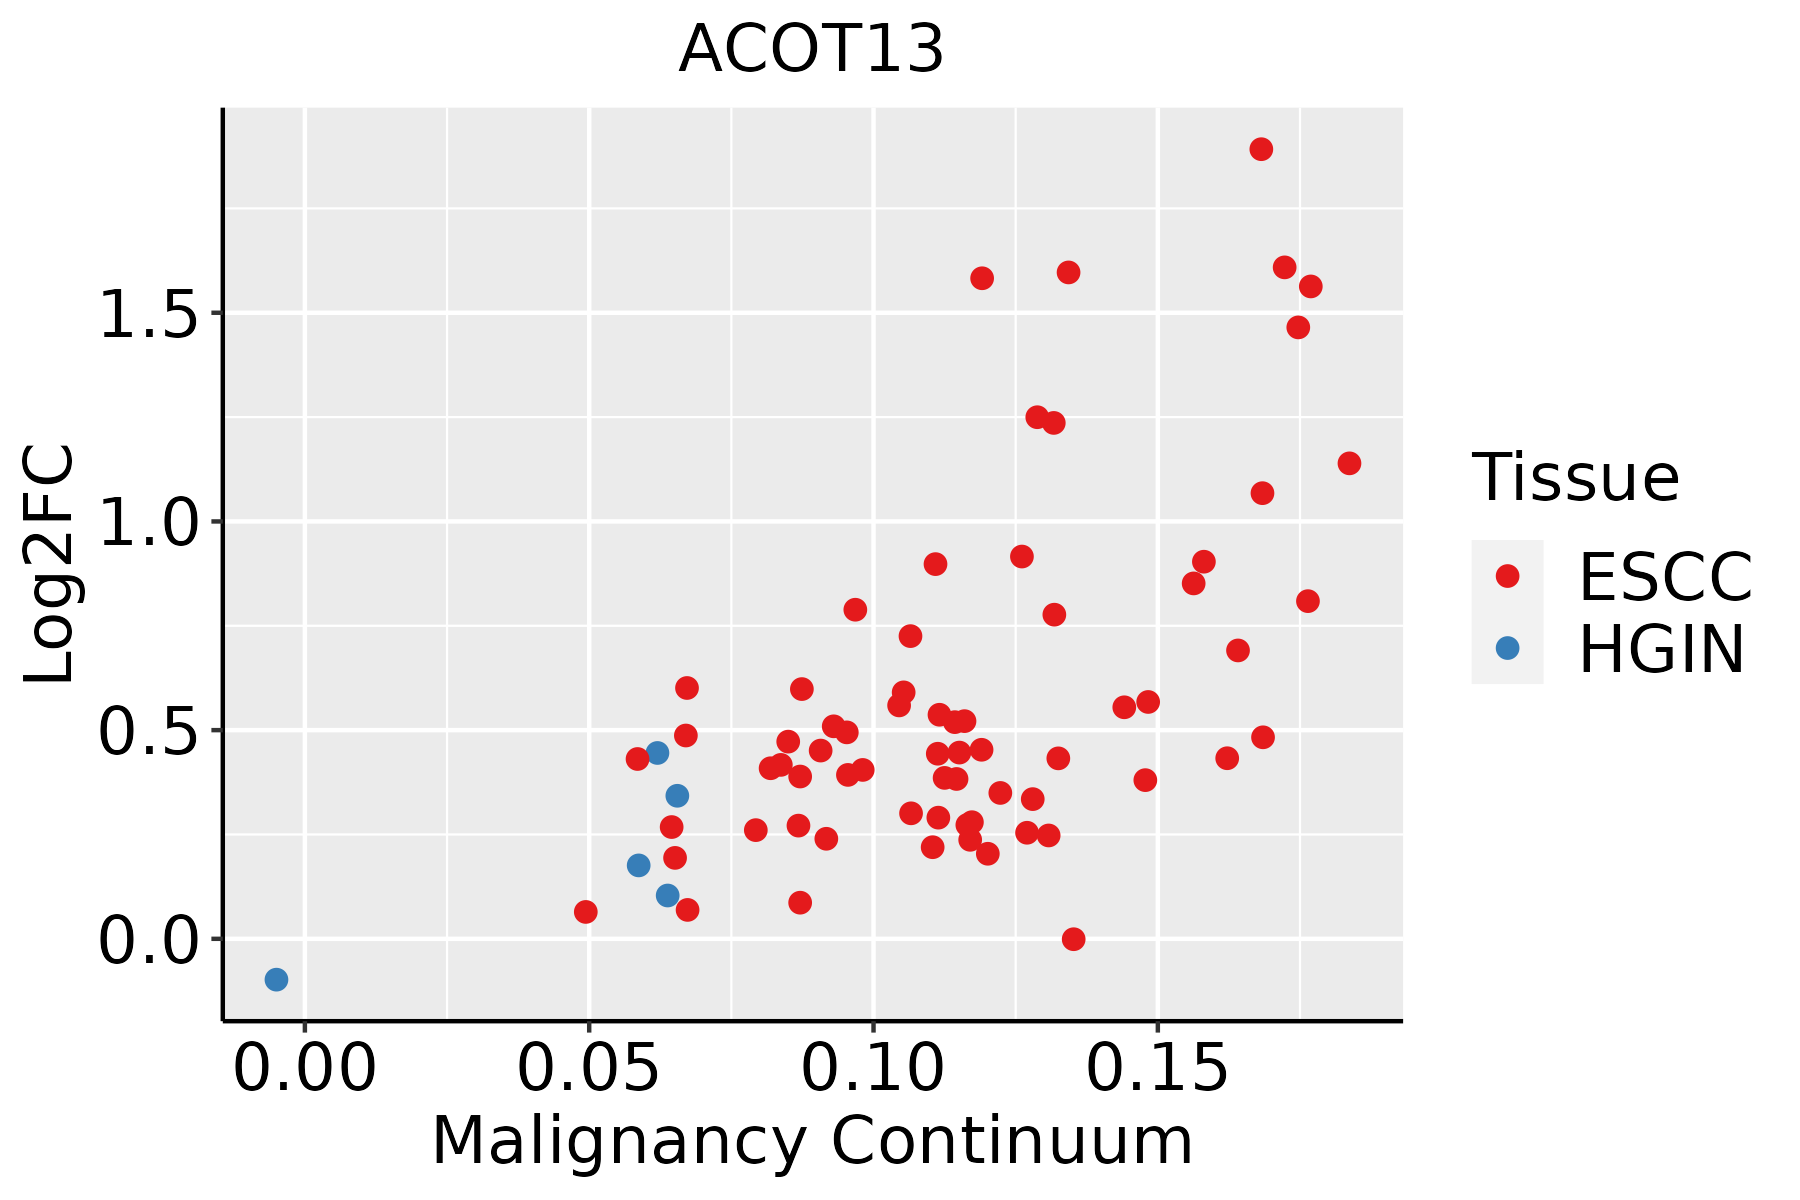 | ESCC: Esophageal squamous cell carcinoma |
| HGIN: High-grade intraepithelial neoplasias | ||
| LGIN: Low-grade intraepithelial neoplasias | ||
| Liver |  | HCC: Hepatocellular carcinoma |
| NAFLD: Non-alcoholic fatty liver disease | ||
| Oral Cavity | 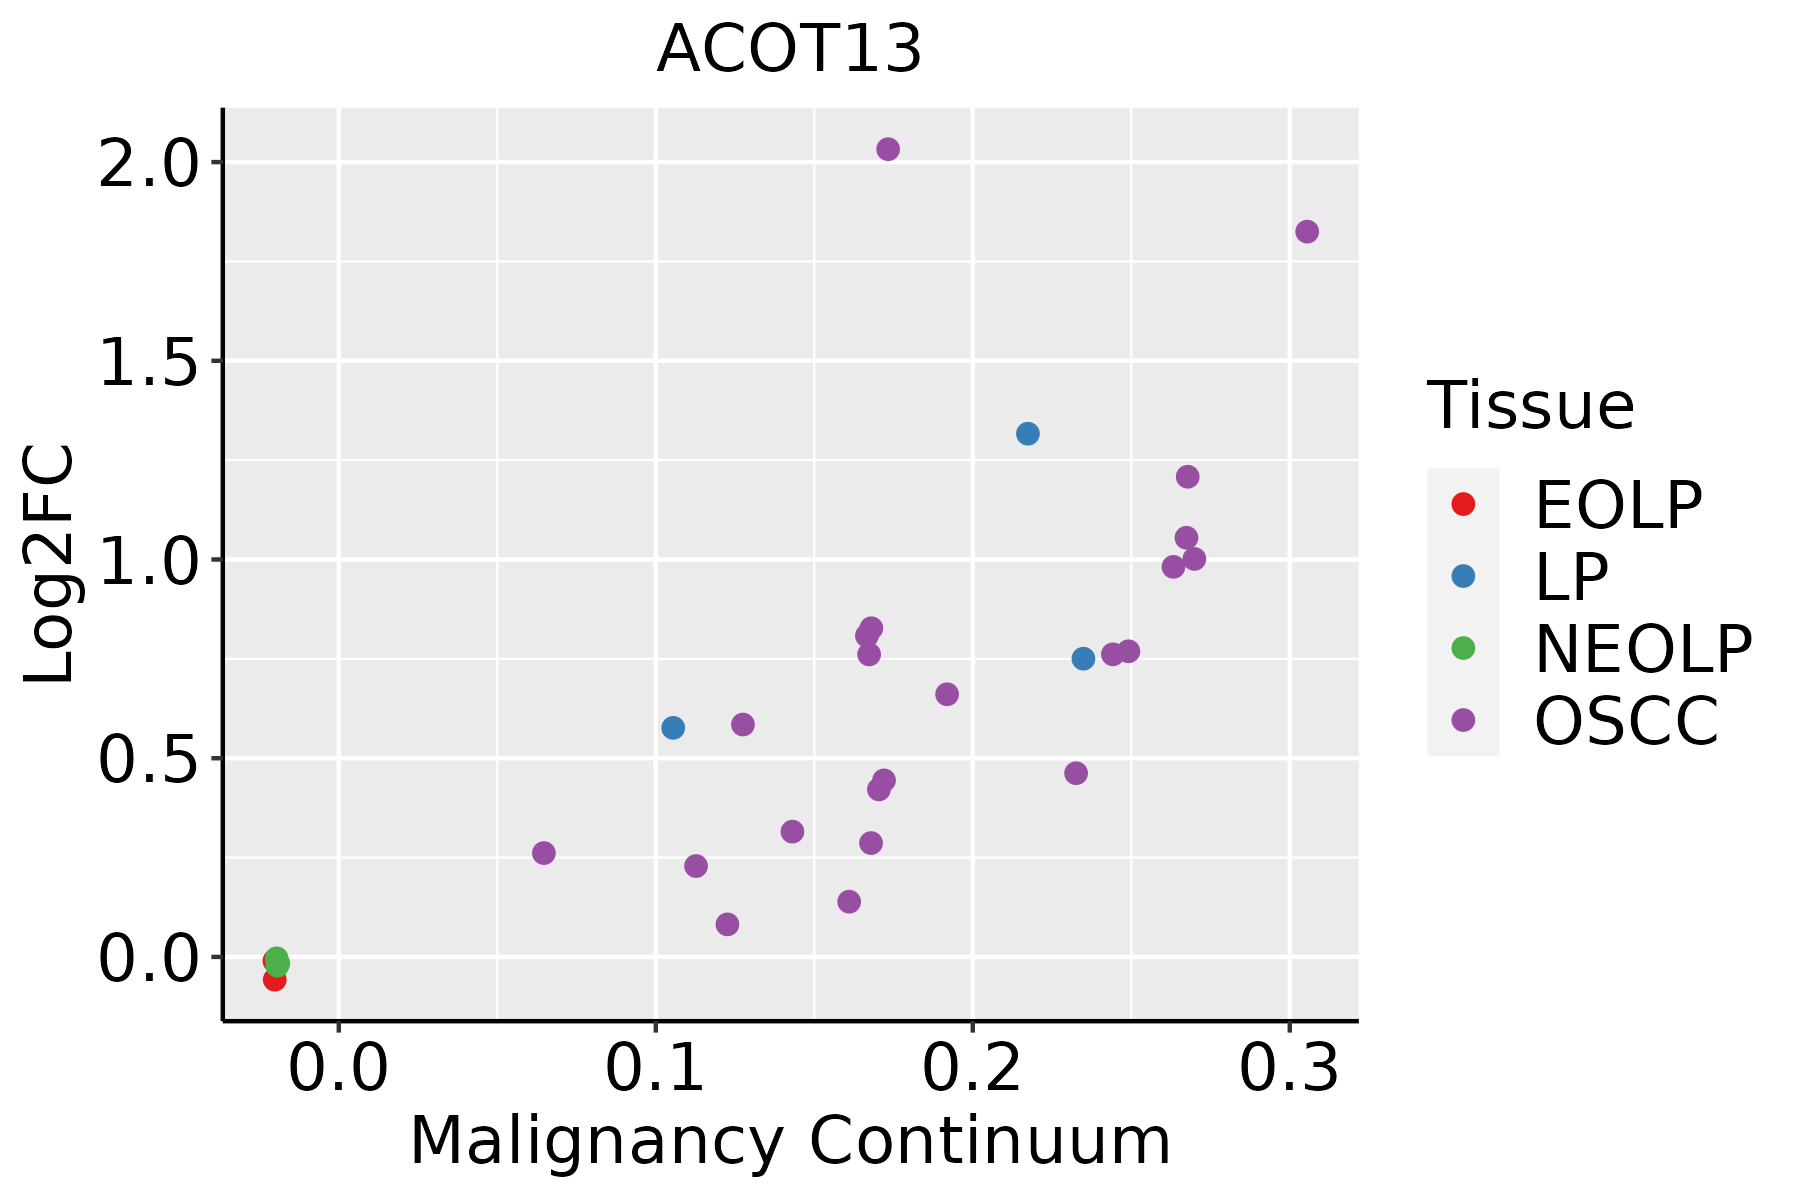 | EOLP: Erosive Oral lichen planus |
| LP: leukoplakia | ||
| NEOLP: Non-erosive oral lichen planus | ||
| OSCC: Oral squamous cell carcinoma | ||
| Skin | 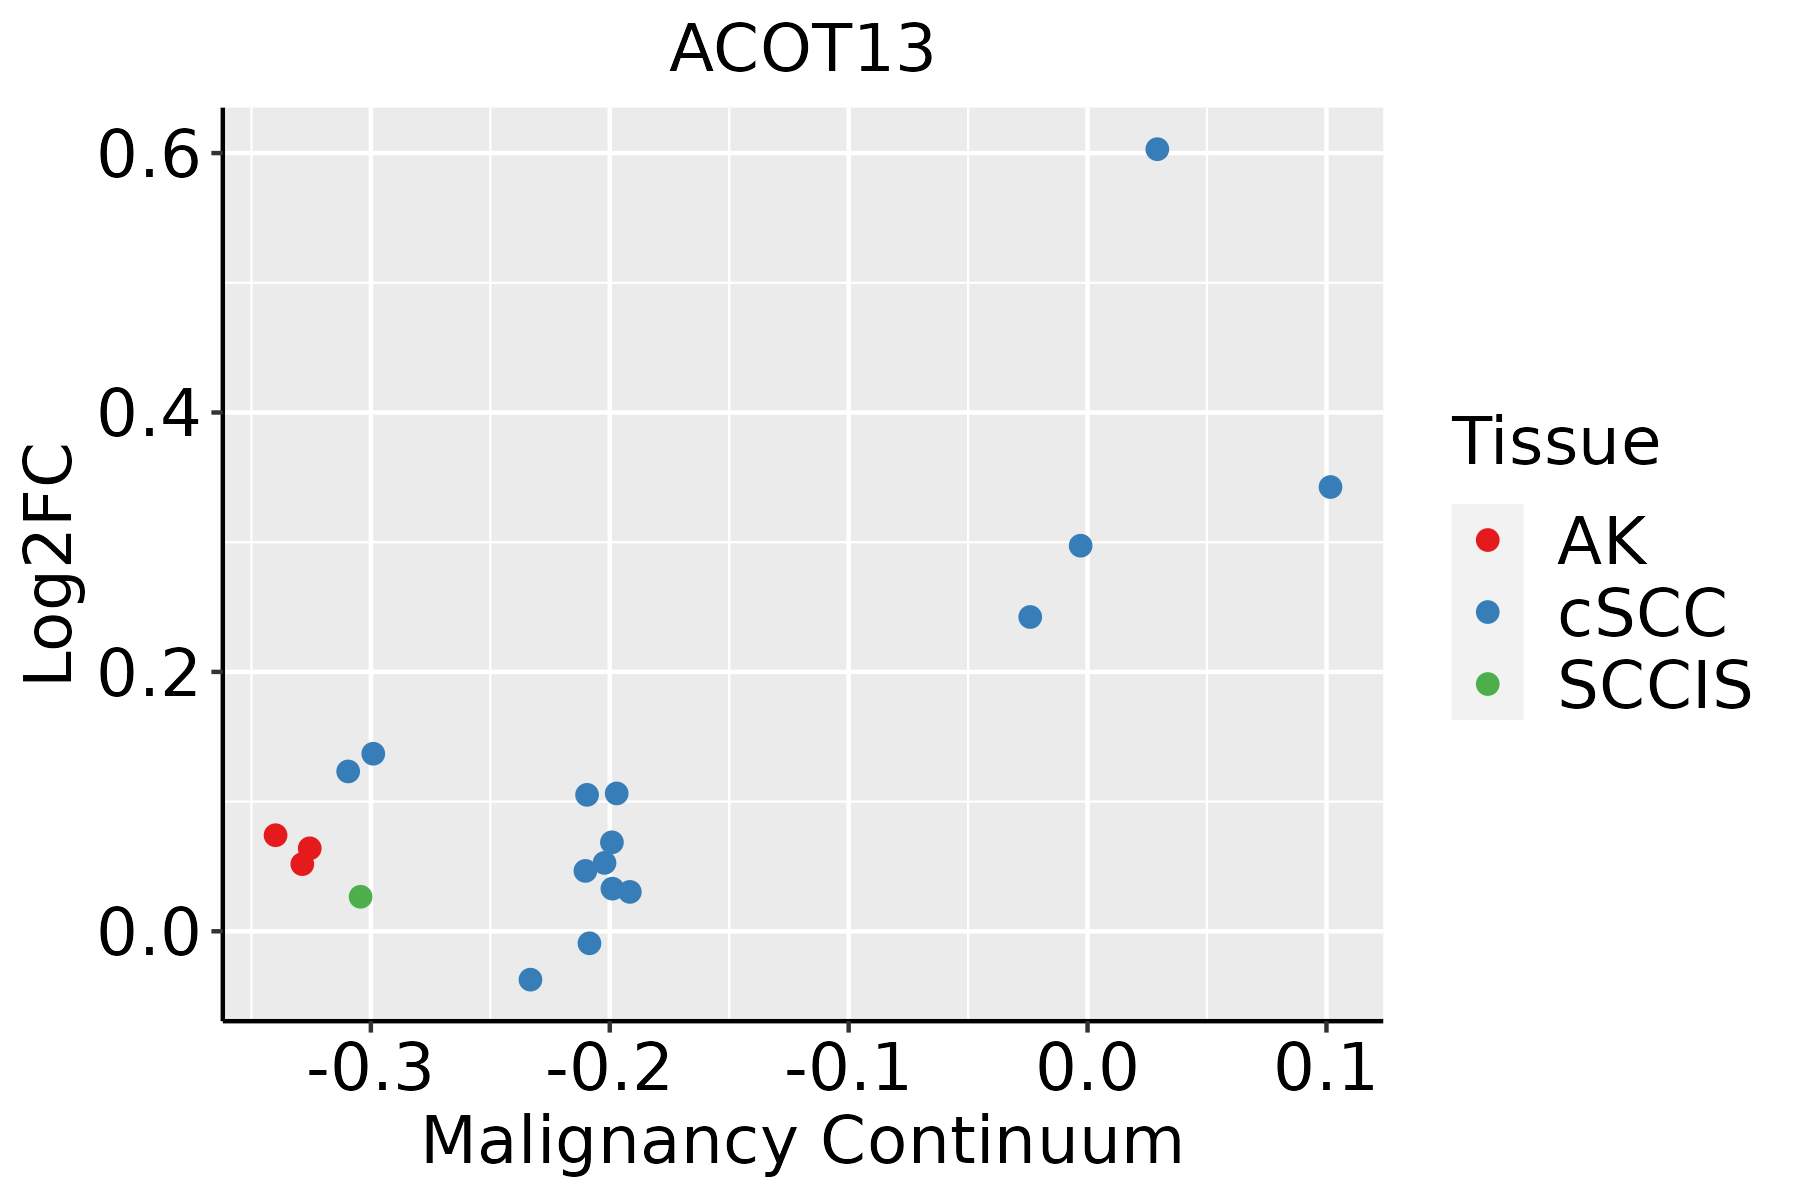 | AK: Actinic keratosis |
| cSCC: Cutaneous squamous cell carcinoma | ||
| SCCIS:squamous cell carcinoma in situ | ||
| Thyroid | 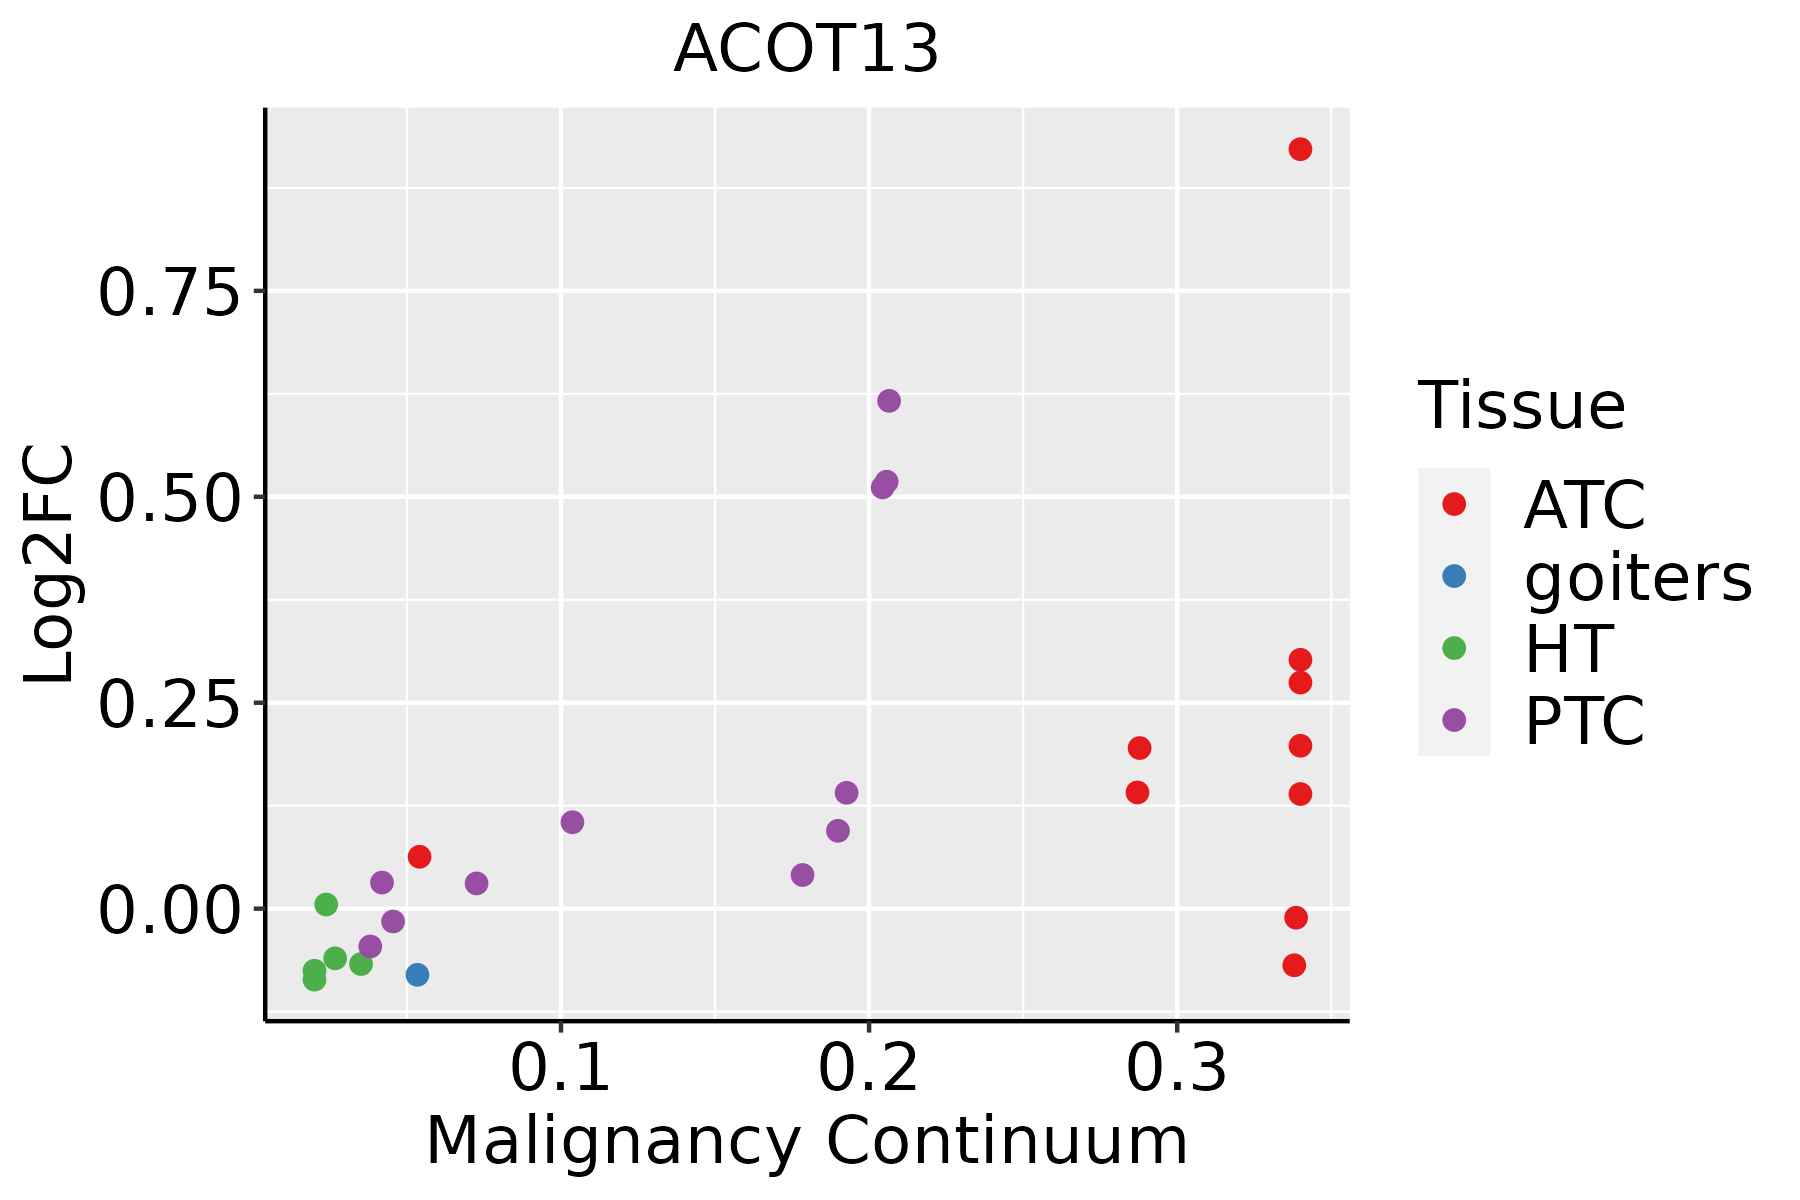 | ATC: Anaplastic thyroid cancer |
| HT: Hashimoto's thyroiditis | ||
| PTC: Papillary thyroid cancer |
| ∗log2FC in expression of this searched gene in stem-like cells from each diseased tissue sample relative to stem-like cells in normal samples in each tissue plotted against the malignancy continuum. Samples are colored based on if they are from different disease stage. |
Top |
Malignant transformation related pathway analysis |
| Find out the enriched GO biological processes and KEGG pathways involved in transition from healthy to precancer to cancer |
| Tissue | Disease Stage | Enriched GO biological Processes |
| Colorectum | AD |  |
| Colorectum | SER |  |
| Colorectum | MSS |  |
| Colorectum | MSI-H |  |
| Colorectum | FAP |  |
| ∗Top 15 enriched GO BP terms are showed in the bar plot of each disease state in each tissue. Each row represents a significant GO biological process which is colored according to the -log10(p.adjust). |
| Page: 1 2 3 4 5 6 7 8 9 |
| GO ID | Tissue | Disease Stage | Description | Gene Ratio | Bg Ratio | pvalue | p.adjust | Count |
| GO:00512623 | Esophagus | ESCC | protein tetramerization | 54/8552 | 87/18723 | 1.50e-03 | 7.06e-03 | 54 |
| GO:00512592 | Esophagus | ESCC | protein complex oligomerization | 130/8552 | 238/18723 | 3.29e-03 | 1.36e-02 | 130 |
| GO:01061066 | Esophagus | ESCC | cold-induced thermogenesis | 80/8552 | 144/18723 | 1.07e-02 | 3.65e-02 | 80 |
| GO:01201616 | Esophagus | ESCC | regulation of cold-induced thermogenesis | 80/8552 | 144/18723 | 1.07e-02 | 3.65e-02 | 80 |
| GO:19908452 | Liver | NAFLD | adaptive thermogenesis | 28/1882 | 157/18723 | 1.91e-03 | 1.93e-02 | 28 |
| GO:00016592 | Liver | NAFLD | temperature homeostasis | 29/1882 | 174/18723 | 4.48e-03 | 3.61e-02 | 29 |
| GO:01061063 | Liver | NAFLD | cold-induced thermogenesis | 25/1882 | 144/18723 | 4.66e-03 | 3.74e-02 | 25 |
| GO:01201613 | Liver | NAFLD | regulation of cold-induced thermogenesis | 25/1882 | 144/18723 | 4.66e-03 | 3.74e-02 | 25 |
| GO:0051262 | Liver | HCC | protein tetramerization | 50/7958 | 87/18723 | 3.42e-03 | 1.55e-02 | 50 |
| GO:010610611 | Liver | HCC | cold-induced thermogenesis | 76/7958 | 144/18723 | 8.07e-03 | 3.18e-02 | 76 |
| GO:012016111 | Liver | HCC | regulation of cold-induced thermogenesis | 76/7958 | 144/18723 | 8.07e-03 | 3.18e-02 | 76 |
| GO:199084511 | Liver | HCC | adaptive thermogenesis | 81/7958 | 157/18723 | 1.32e-02 | 4.72e-02 | 81 |
| GO:0051289 | Liver | HCC | protein homotetramerization | 33/7958 | 57/18723 | 1.37e-02 | 4.86e-02 | 33 |
| GO:0051259 | Oral cavity | OSCC | protein complex oligomerization | 121/7305 | 238/18723 | 1.29e-04 | 9.21e-04 | 121 |
| GO:00512622 | Oral cavity | OSCC | protein tetramerization | 48/7305 | 87/18723 | 1.60e-03 | 7.62e-03 | 48 |
| GO:01061065 | Oral cavity | OSCC | cold-induced thermogenesis | 71/7305 | 144/18723 | 7.51e-03 | 2.75e-02 | 71 |
| GO:01201615 | Oral cavity | OSCC | regulation of cold-induced thermogenesis | 71/7305 | 144/18723 | 7.51e-03 | 2.75e-02 | 71 |
| GO:00016594 | Oral cavity | OSCC | temperature homeostasis | 84/7305 | 174/18723 | 7.84e-03 | 2.87e-02 | 84 |
| GO:19908454 | Oral cavity | OSCC | adaptive thermogenesis | 76/7305 | 157/18723 | 1.02e-02 | 3.52e-02 | 76 |
| GO:00512591 | Oral cavity | LP | protein complex oligomerization | 85/4623 | 238/18723 | 8.81e-05 | 1.11e-03 | 85 |
| Page: 1 2 |
| Pathway ID | Tissue | Disease Stage | Description | Gene Ratio | Bg Ratio | pvalue | p.adjust | qvalue | Count |
| Page: 1 |
Top |
Cell-cell communication analysis |
| Identification of potential cell-cell interactions between two cell types and their ligand-receptor pairs for different disease states |
| Ligand | Receptor | LRpair | Pathway | Tissue | Disease Stage |
| Page: 1 |
Top |
Single-cell gene regulatory network inference analysis |
| Find out the significant the regulons (TFs) and the target genes of each regulon across cell types for different disease states |
| TF | Cell Type | Tissue | Disease Stage | Target Gene | RSS | Regulon Activity |
| ∗The dot plots of a searched regulon are shown for all cell subpopulations in each disease state of each tissue based on the regulon specific score inferred using pySCENIC and by calculating the average expression. |
| Page: 1 |
Top |
Somatic mutation of malignant transformation related genes |
| Annotation of somatic variants for genes involved in malignant transformation |
| Hugo Symbol | Variant Class | Variant Classification | dbSNP RS | HGVSc | HGVSp | HGVSp Short | SWISSPROT | BIOTYPE | SIFT | PolyPhen | Tumor Sample Barcode | Tissue | Histology | Sex | Age | Stage | Therapy Types | Drugs | Outcome |
| ACOT13 | SNV | Missense_Mutation | novel | c.226N>A | p.Glu76Lys | p.E76K | Q9NPJ3 | protein_coding | tolerated(0.27) | benign(0.044) | TCGA-AC-A5XS-01 | Breast | breast invasive carcinoma | Female | >=65 | I/II | Hormone Therapy | femara | SD |
| ACOT13 | SNV | Missense_Mutation | novel | c.274T>C | p.Ser92Pro | p.S92P | Q9NPJ3 | protein_coding | deleterious(0.03) | possibly_damaging(0.816) | TCGA-2W-A8YY-01 | Cervix | cervical & endocervical cancer | Female | <65 | I/II | Chemotherapy | cisplatin | CR |
| ACOT13 | SNV | Missense_Mutation | c.344N>C | p.Phe115Ser | p.F115S | Q9NPJ3 | protein_coding | deleterious(0) | probably_damaging(0.995) | TCGA-CA-6718-01 | Colorectum | colon adenocarcinoma | Male | <65 | I/II | Unknown | Unknown | PD | |
| ACOT13 | SNV | Missense_Mutation | c.83N>A | p.Ile28Asn | p.I28N | Q9NPJ3 | protein_coding | deleterious(0) | benign(0.235) | TCGA-CL-5918-01 | Colorectum | rectum adenocarcinoma | Female | >=65 | I/II | Unknown | Unknown | SD | |
| ACOT13 | SNV | Missense_Mutation | c.286N>A | p.Leu96Ile | p.L96I | Q9NPJ3 | protein_coding | tolerated(1) | benign(0) | TCGA-AP-A056-01 | Endometrium | uterine corpus endometrioid carcinoma | Female | <65 | I/II | Unknown | Unknown | SD | |
| ACOT13 | SNV | Missense_Mutation | novel | c.212C>A | p.Ala71Asp | p.A71D | Q9NPJ3 | protein_coding | deleterious(0) | probably_damaging(1) | TCGA-AX-A0J1-01 | Endometrium | uterine corpus endometrioid carcinoma | Female | >=65 | I/II | Unknown | Unknown | SD |
| ACOT13 | SNV | Missense_Mutation | rs148153546 | c.169N>A | p.Gly57Ser | p.G57S | Q9NPJ3 | protein_coding | deleterious(0) | probably_damaging(1) | TCGA-AX-A1CE-01 | Endometrium | uterine corpus endometrioid carcinoma | Female | <65 | I/II | Unspecific | Paclitaxel | SD |
| ACOT13 | SNV | Missense_Mutation | novel | c.269N>G | p.Tyr90Cys | p.Y90C | Q9NPJ3 | protein_coding | deleterious(0) | probably_damaging(0.997) | TCGA-AX-A1CE-01 | Endometrium | uterine corpus endometrioid carcinoma | Female | <65 | I/II | Unspecific | Paclitaxel | SD |
| ACOT13 | SNV | Missense_Mutation | novel | c.397A>G | p.Arg133Gly | p.R133G | Q9NPJ3 | protein_coding | tolerated(0.11) | probably_damaging(0.995) | TCGA-B5-A3FA-01 | Endometrium | uterine corpus endometrioid carcinoma | Female | >=65 | I/II | Unknown | Unknown | SD |
| ACOT13 | SNV | Missense_Mutation | c.395N>T | p.Gly132Val | p.G132V | Q9NPJ3 | protein_coding | deleterious(0) | probably_damaging(0.998) | TCGA-BS-A0UV-01 | Endometrium | uterine corpus endometrioid carcinoma | Female | <65 | III/IV | Unknown | Unknown | SD |
| Page: 1 2 |
Top |
Related drugs of malignant transformation related genes |
| Identification of chemicals and drugs interact with genes involved in malignant transfromation |
| (DGIdb 4.0) |
| Entrez ID | Symbol | Category | Interaction Types | Drug Claim Name | Drug Name | PMIDs |
| Page: 1 |

Copyright 2023-Present -The University of Texas Health Science Center at Houston |