
|
|||||
|
 | |
| |
| |
| |
| |
| |
|
Gene: ACOT12 |
Gene summary for ACOT12 |
| Gene information | Species | Human | Gene symbol | ACOT12 | Gene ID | 134526 |
| Gene name | acyl-CoA thioesterase 12 | |
| Gene Alias | CACH-1 | |
| Cytomap | 5q14.1 | |
| Gene Type | protein-coding | GO ID | GO:0006082 | UniProtAcc | Q8WYK0 |
Top |
Malignant transformation analysis |
| Identification of the aberrant gene expression in precancerous and cancerous lesions by comparing the gene expression of stem-like cells in diseased tissues with normal stem cells |
| Entrez ID | Symbol | Replicates | Species | Organ | Tissue | Adj P-value | Log2FC | Malignancy |
| 134526 | ACOT12 | NAFLD1 | Human | Liver | NAFLD | 3.75e-08 | 9.78e-01 | -0.04 |
| 134526 | ACOT12 | S43 | Human | Liver | Cirrhotic | 3.96e-04 | -5.25e-02 | -0.0187 |
| 134526 | ACOT12 | HCC1_Meng | Human | Liver | HCC | 1.47e-08 | -1.42e-01 | 0.0246 |
| 134526 | ACOT12 | HCC2_Meng | Human | Liver | HCC | 1.07e-06 | -1.63e-01 | 0.0107 |
| 134526 | ACOT12 | cirrhotic1 | Human | Liver | Cirrhotic | 1.07e-06 | -1.62e-01 | 0.0202 |
| 134526 | ACOT12 | cirrhotic2 | Human | Liver | Cirrhotic | 1.07e-06 | -1.60e-01 | 0.0201 |
| 134526 | ACOT12 | HCC2 | Human | Liver | HCC | 1.69e-06 | 3.24e+00 | 0.5341 |
| 134526 | ACOT12 | Pt13.a | Human | Liver | HCC | 6.85e-03 | -1.45e-01 | 0.021 |
| Page: 1 |
| Tissue | Expression Dynamics | Abbreviation |
| Liver | 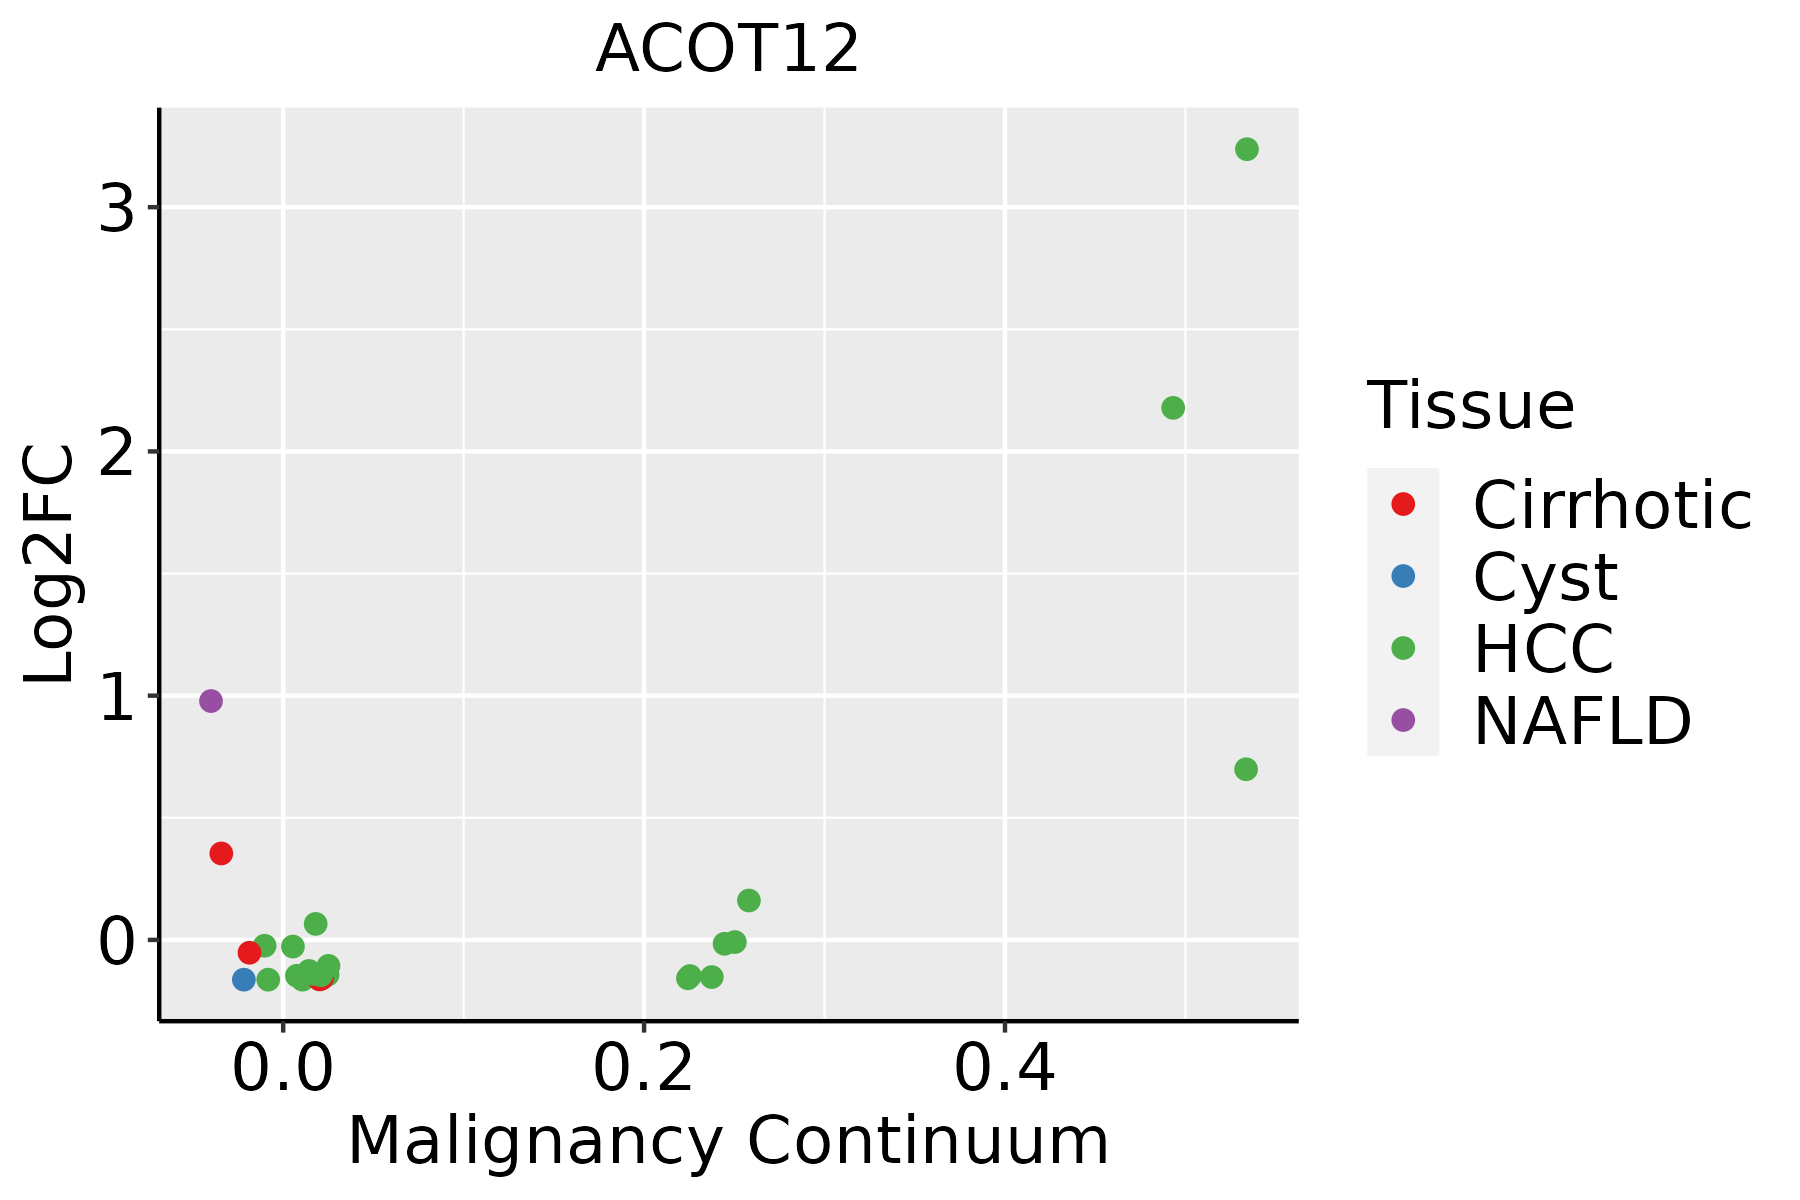 | HCC: Hepatocellular carcinoma |
| NAFLD: Non-alcoholic fatty liver disease |
| ∗log2FC in expression of this searched gene in stem-like cells from each diseased tissue sample relative to stem-like cells in normal samples in each tissue plotted against the malignancy continuum. Samples are colored based on if they are from different disease stage. |
Top |
Malignant transformation related pathway analysis |
| Find out the enriched GO biological processes and KEGG pathways involved in transition from healthy to precancer to cancer |
| Tissue | Disease Stage | Enriched GO biological Processes |
| Colorectum | AD |  |
| Colorectum | SER |  |
| Colorectum | MSS |  |
| Colorectum | MSI-H |  |
| Colorectum | FAP |  |
| ∗Top 15 enriched GO BP terms are showed in the bar plot of each disease state in each tissue. Each row represents a significant GO biological process which is colored according to the -log10(p.adjust). |
| Page: 1 2 3 4 5 6 7 8 9 |
| GO ID | Tissue | Disease Stage | Description | Gene Ratio | Bg Ratio | pvalue | p.adjust | Count |
| GO:00066316 | Liver | NAFLD | fatty acid metabolic process | 92/1882 | 390/18723 | 3.38e-15 | 3.29e-12 | 92 |
| GO:00092596 | Liver | NAFLD | ribonucleotide metabolic process | 72/1882 | 385/18723 | 1.51e-07 | 1.09e-05 | 72 |
| GO:00196936 | Liver | NAFLD | ribose phosphate metabolic process | 73/1882 | 396/18723 | 2.23e-07 | 1.53e-05 | 73 |
| GO:00091177 | Liver | NAFLD | nucleotide metabolic process | 85/1882 | 489/18723 | 3.31e-07 | 2.18e-05 | 85 |
| GO:00067537 | Liver | NAFLD | nucleoside phosphate metabolic process | 85/1882 | 497/18723 | 6.69e-07 | 3.83e-05 | 85 |
| GO:00725217 | Liver | NAFLD | purine-containing compound metabolic process | 74/1882 | 416/18723 | 7.73e-07 | 4.27e-05 | 74 |
| GO:00091507 | Liver | NAFLD | purine ribonucleotide metabolic process | 67/1882 | 368/18723 | 1.10e-06 | 5.44e-05 | 67 |
| GO:00061637 | Liver | NAFLD | purine nucleotide metabolic process | 70/1882 | 396/18723 | 1.93e-06 | 8.23e-05 | 70 |
| GO:00067904 | Liver | NAFLD | sulfur compound metabolic process | 58/1882 | 339/18723 | 3.79e-05 | 9.38e-04 | 58 |
| GO:00338653 | Liver | NAFLD | nucleoside bisphosphate metabolic process | 28/1882 | 128/18723 | 5.89e-05 | 1.30e-03 | 28 |
| GO:00338753 | Liver | NAFLD | ribonucleoside bisphosphate metabolic process | 28/1882 | 128/18723 | 5.89e-05 | 1.30e-03 | 28 |
| GO:00340323 | Liver | NAFLD | purine nucleoside bisphosphate metabolic process | 28/1882 | 128/18723 | 5.89e-05 | 1.30e-03 | 28 |
| GO:0006637 | Liver | NAFLD | acyl-CoA metabolic process | 21/1882 | 96/18723 | 4.72e-04 | 6.74e-03 | 21 |
| GO:0035383 | Liver | NAFLD | thioester metabolic process | 21/1882 | 96/18723 | 4.72e-04 | 6.74e-03 | 21 |
| GO:000663112 | Liver | Cirrhotic | fatty acid metabolic process | 165/4634 | 390/18723 | 1.29e-14 | 1.26e-12 | 165 |
| GO:000675312 | Liver | Cirrhotic | nucleoside phosphate metabolic process | 190/4634 | 497/18723 | 1.10e-11 | 6.96e-10 | 190 |
| GO:000911712 | Liver | Cirrhotic | nucleotide metabolic process | 187/4634 | 489/18723 | 1.55e-11 | 9.63e-10 | 187 |
| GO:001969312 | Liver | Cirrhotic | ribose phosphate metabolic process | 156/4634 | 396/18723 | 5.83e-11 | 3.23e-09 | 156 |
| GO:000925912 | Liver | Cirrhotic | ribonucleotide metabolic process | 151/4634 | 385/18723 | 1.72e-10 | 8.70e-09 | 151 |
| GO:007252112 | Liver | Cirrhotic | purine-containing compound metabolic process | 156/4634 | 416/18723 | 3.74e-09 | 1.52e-07 | 156 |
| Page: 1 2 3 |
| Pathway ID | Tissue | Disease Stage | Description | Gene Ratio | Bg Ratio | pvalue | p.adjust | qvalue | Count |
| hsa006208 | Liver | Cirrhotic | Pyruvate metabolism | 29/2530 | 47/8465 | 5.90e-06 | 5.95e-05 | 3.67e-05 | 29 |
| hsa0062011 | Liver | Cirrhotic | Pyruvate metabolism | 29/2530 | 47/8465 | 5.90e-06 | 5.95e-05 | 3.67e-05 | 29 |
| hsa0062021 | Liver | HCC | Pyruvate metabolism | 37/4020 | 47/8465 | 1.10e-05 | 8.03e-05 | 4.46e-05 | 37 |
| hsa0062031 | Liver | HCC | Pyruvate metabolism | 37/4020 | 47/8465 | 1.10e-05 | 8.03e-05 | 4.46e-05 | 37 |
| Page: 1 |
Top |
Cell-cell communication analysis |
| Identification of potential cell-cell interactions between two cell types and their ligand-receptor pairs for different disease states |
| Ligand | Receptor | LRpair | Pathway | Tissue | Disease Stage |
| Page: 1 |
Top |
Single-cell gene regulatory network inference analysis |
| Find out the significant the regulons (TFs) and the target genes of each regulon across cell types for different disease states |
| TF | Cell Type | Tissue | Disease Stage | Target Gene | RSS | Regulon Activity |
| ∗The dot plots of a searched regulon are shown for all cell subpopulations in each disease state of each tissue based on the regulon specific score inferred using pySCENIC and by calculating the average expression. |
| Page: 1 |
Top |
Somatic mutation of malignant transformation related genes |
| Annotation of somatic variants for genes involved in malignant transformation |
| Hugo Symbol | Variant Class | Variant Classification | dbSNP RS | HGVSc | HGVSp | HGVSp Short | SWISSPROT | BIOTYPE | SIFT | PolyPhen | Tumor Sample Barcode | Tissue | Histology | Sex | Age | Stage | Therapy Types | Drugs | Outcome |
| ACOT12 | SNV | Missense_Mutation | novel | c.859N>C | p.Ile287Leu | p.I287L | Q8WYK0 | protein_coding | tolerated(0.18) | benign(0.334) | TCGA-A2-A0CU-01 | Breast | breast invasive carcinoma | Female | >=65 | I/II | Hormone Therapy | tamoxiphen | SD |
| ACOT12 | SNV | Missense_Mutation | rs769986706 | c.440N>A | p.Arg147Gln | p.R147Q | Q8WYK0 | protein_coding | deleterious(0.02) | probably_damaging(0.995) | TCGA-D8-A1J8-01 | Breast | breast invasive carcinoma | Female | >=65 | I/II | Hormone Therapy | nolvadex | SD |
| ACOT12 | SNV | Missense_Mutation | novel | c.889C>T | p.Leu297Phe | p.L297F | Q8WYK0 | protein_coding | tolerated(0.7) | benign(0.009) | TCGA-2W-A8YY-01 | Cervix | cervical & endocervical cancer | Female | <65 | I/II | Chemotherapy | cisplatin | CR |
| ACOT12 | SNV | Missense_Mutation | c.1573N>G | p.Leu525Val | p.L525V | Q8WYK0 | protein_coding | tolerated(0.55) | benign(0.062) | TCGA-DR-A0ZM-01 | Cervix | cervical & endocervical cancer | Female | <65 | III/IV | Unspecific | Cisplatin | SD | |
| ACOT12 | SNV | Missense_Mutation | novel | c.1384A>G | p.Lys462Glu | p.K462E | Q8WYK0 | protein_coding | tolerated(0.33) | benign(0.007) | TCGA-5M-AAT6-01 | Colorectum | colon adenocarcinoma | Female | <65 | III/IV | Unknown | Unknown | PD |
| ACOT12 | SNV | Missense_Mutation | novel | c.1377N>C | p.Lys459Asn | p.K459N | Q8WYK0 | protein_coding | deleterious(0.01) | possibly_damaging(0.493) | TCGA-A6-2672-01 | Colorectum | colon adenocarcinoma | Female | >=65 | III/IV | Unknown | Unknown | SD |
| ACOT12 | SNV | Missense_Mutation | rs759543309 | c.1079N>C | p.Lys360Thr | p.K360T | Q8WYK0 | protein_coding | tolerated(0.52) | benign(0.091) | TCGA-AA-3510-01 | Colorectum | colon adenocarcinoma | Male | >=65 | I/II | Unknown | Unknown | SD |
| ACOT12 | SNV | Missense_Mutation | rs766228561 | c.965N>A | p.Arg322Gln | p.R322Q | Q8WYK0 | protein_coding | tolerated(0.06) | possibly_damaging(0.666) | TCGA-AA-3510-01 | Colorectum | colon adenocarcinoma | Male | >=65 | I/II | Unknown | Unknown | SD |
| ACOT12 | SNV | Missense_Mutation | rs753320206 | c.485G>A | p.Ser162Asn | p.S162N | Q8WYK0 | protein_coding | tolerated(0.35) | benign(0) | TCGA-AA-3821-01 | Colorectum | colon adenocarcinoma | Female | >=65 | I/II | Unknown | Unknown | SD |
| ACOT12 | SNV | Missense_Mutation | novel | c.1136N>G | p.Ile379Arg | p.I379R | Q8WYK0 | protein_coding | deleterious(0.03) | possibly_damaging(0.616) | TCGA-AA-3984-01 | Colorectum | colon adenocarcinoma | Female | <65 | I/II | Unknown | Unknown | SD |
| Page: 1 2 3 4 5 6 7 8 |
Top |
Related drugs of malignant transformation related genes |
| Identification of chemicals and drugs interact with genes involved in malignant transfromation |
| (DGIdb 4.0) |
| Entrez ID | Symbol | Category | Interaction Types | Drug Claim Name | Drug Name | PMIDs |
| Page: 1 |

Copyright 2023-Present -The University of Texas Health Science Center at Houston |