
|
|||||
|
 | |
| |
| |
| |
| |
| |
|
Gene: ACO1 |
Gene summary for ACO1 |
| Gene information | Species | Human | Gene symbol | ACO1 | Gene ID | 48 |
| Gene name | aconitase 1 | |
| Gene Alias | ACONS | |
| Cytomap | 9p21.1 | |
| Gene Type | protein-coding | GO ID | GO:0003008 | UniProtAcc | P21399 |
Top |
Malignant transformation analysis |
| Identification of the aberrant gene expression in precancerous and cancerous lesions by comparing the gene expression of stem-like cells in diseased tissues with normal stem cells |
| Entrez ID | Symbol | Replicates | Species | Organ | Tissue | Adj P-value | Log2FC | Malignancy |
| 48 | ACO1 | LZE4T | Human | Esophagus | ESCC | 8.70e-09 | 1.38e-01 | 0.0811 |
| 48 | ACO1 | LZE24T | Human | Esophagus | ESCC | 5.06e-03 | 1.33e-01 | 0.0596 |
| 48 | ACO1 | P2T-E | Human | Esophagus | ESCC | 8.25e-12 | 2.35e-01 | 0.1177 |
| 48 | ACO1 | P4T-E | Human | Esophagus | ESCC | 4.11e-08 | 1.25e-01 | 0.1323 |
| 48 | ACO1 | P8T-E | Human | Esophagus | ESCC | 1.12e-10 | 9.03e-02 | 0.0889 |
| 48 | ACO1 | P9T-E | Human | Esophagus | ESCC | 6.94e-04 | 1.31e-01 | 0.1131 |
| 48 | ACO1 | P10T-E | Human | Esophagus | ESCC | 1.95e-08 | 9.20e-02 | 0.116 |
| 48 | ACO1 | P11T-E | Human | Esophagus | ESCC | 2.39e-07 | 3.44e-01 | 0.1426 |
| 48 | ACO1 | P12T-E | Human | Esophagus | ESCC | 4.09e-10 | 1.05e-01 | 0.1122 |
| 48 | ACO1 | P15T-E | Human | Esophagus | ESCC | 1.85e-07 | 1.58e-01 | 0.1149 |
| 48 | ACO1 | P16T-E | Human | Esophagus | ESCC | 3.86e-04 | 5.76e-02 | 0.1153 |
| 48 | ACO1 | P21T-E | Human | Esophagus | ESCC | 1.47e-13 | 1.62e-01 | 0.1617 |
| 48 | ACO1 | P22T-E | Human | Esophagus | ESCC | 4.99e-05 | 7.86e-02 | 0.1236 |
| 48 | ACO1 | P23T-E | Human | Esophagus | ESCC | 4.25e-18 | 2.59e-01 | 0.108 |
| 48 | ACO1 | P24T-E | Human | Esophagus | ESCC | 6.98e-03 | 9.12e-02 | 0.1287 |
| 48 | ACO1 | P26T-E | Human | Esophagus | ESCC | 4.92e-08 | 1.65e-01 | 0.1276 |
| 48 | ACO1 | P27T-E | Human | Esophagus | ESCC | 3.03e-11 | 1.50e-01 | 0.1055 |
| 48 | ACO1 | P28T-E | Human | Esophagus | ESCC | 7.99e-06 | 7.11e-02 | 0.1149 |
| 48 | ACO1 | P30T-E | Human | Esophagus | ESCC | 2.16e-04 | 2.23e-01 | 0.137 |
| 48 | ACO1 | P32T-E | Human | Esophagus | ESCC | 2.89e-09 | 1.58e-01 | 0.1666 |
| Page: 1 2 3 4 |
| Tissue | Expression Dynamics | Abbreviation |
| Esophagus |  | ESCC: Esophageal squamous cell carcinoma |
| HGIN: High-grade intraepithelial neoplasias | ||
| LGIN: Low-grade intraepithelial neoplasias | ||
| Thyroid | 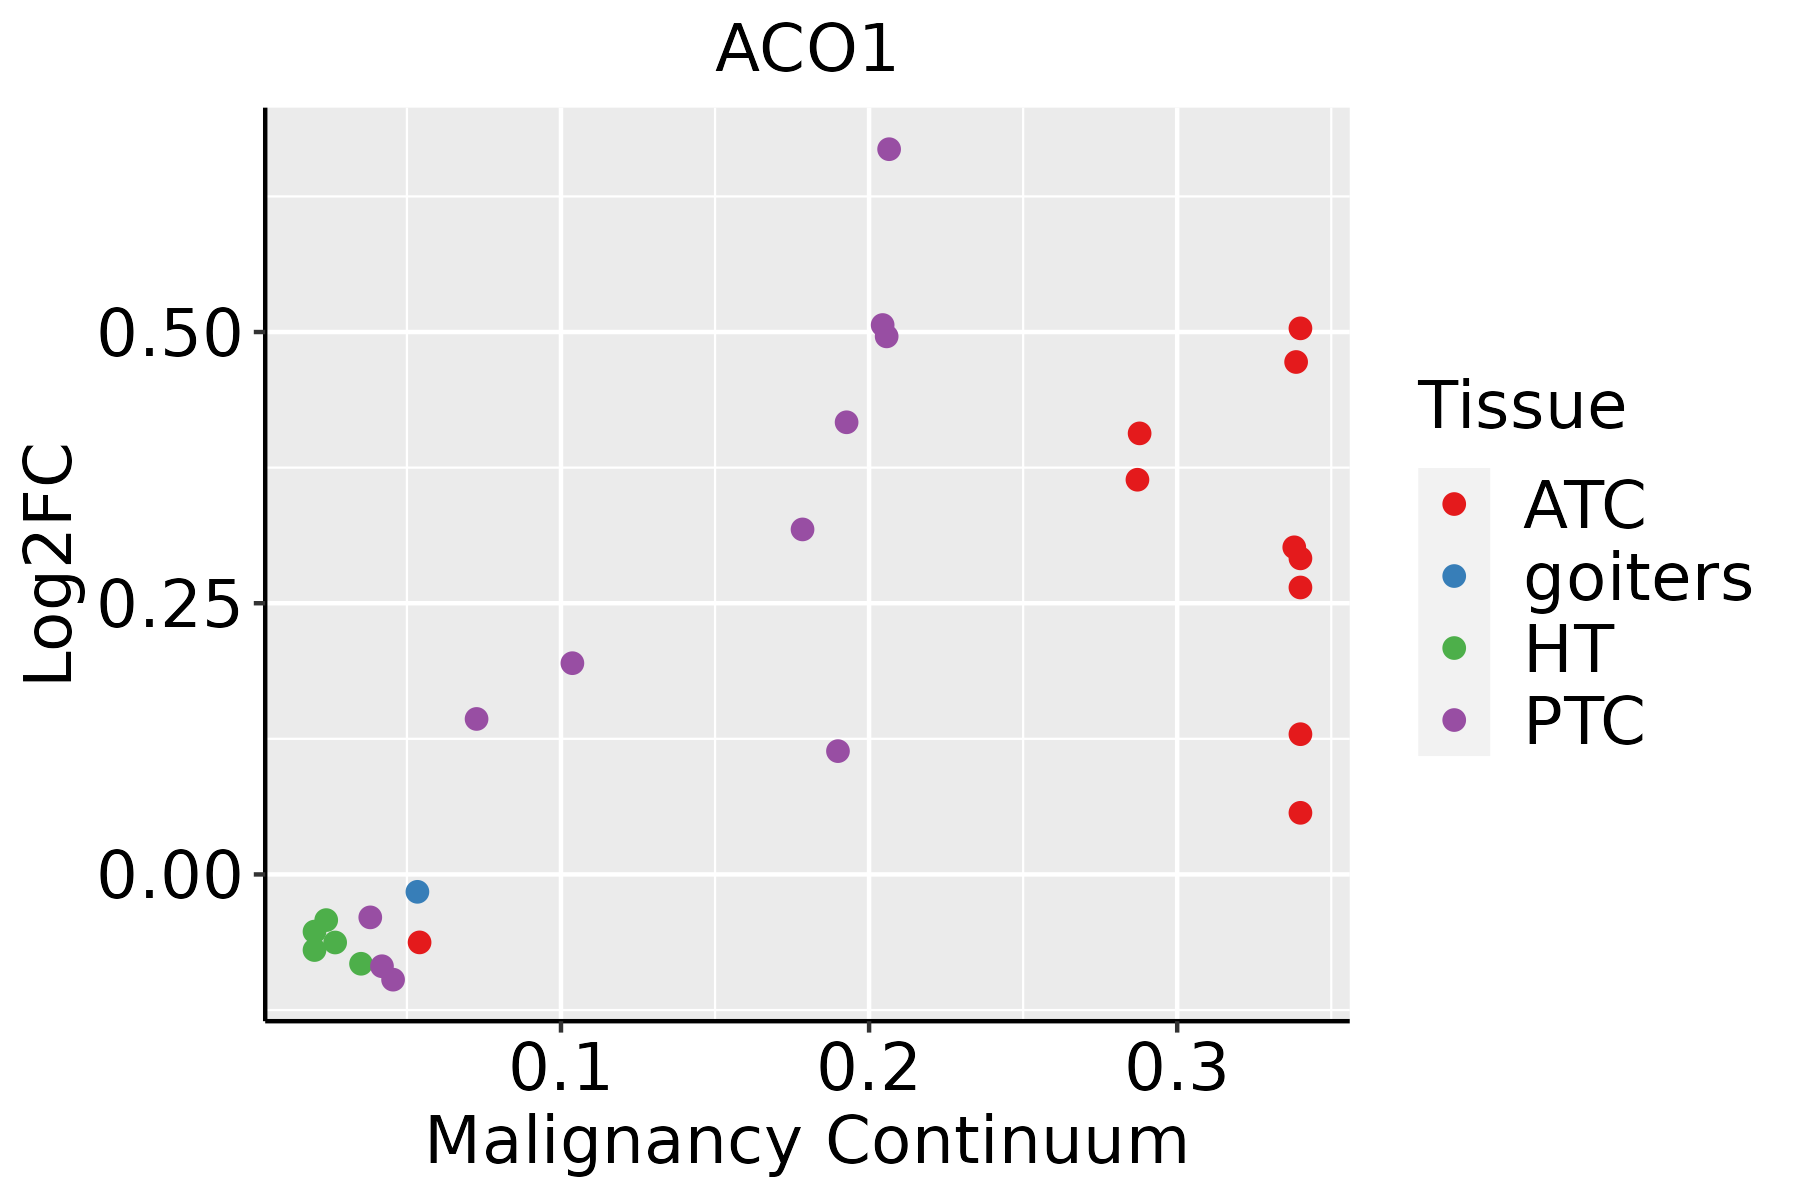 | ATC: Anaplastic thyroid cancer |
| HT: Hashimoto's thyroiditis | ||
| PTC: Papillary thyroid cancer |
| ∗log2FC in expression of this searched gene in stem-like cells from each diseased tissue sample relative to stem-like cells in normal samples in each tissue plotted against the malignancy continuum. Samples are colored based on if they are from different disease stage. |
Top |
Malignant transformation related pathway analysis |
| Find out the enriched GO biological processes and KEGG pathways involved in transition from healthy to precancer to cancer |
| Tissue | Disease Stage | Enriched GO biological Processes |
| Colorectum | AD |  |
| Colorectum | SER |  |
| Colorectum | MSS |  |
| Colorectum | MSI-H |  |
| Colorectum | FAP |  |
| ∗Top 15 enriched GO BP terms are showed in the bar plot of each disease state in each tissue. Each row represents a significant GO biological process which is colored according to the -log10(p.adjust). |
| Page: 1 2 3 4 5 6 7 8 9 |
| GO ID | Tissue | Disease Stage | Description | Gene Ratio | Bg Ratio | pvalue | p.adjust | Count |
| GO:0006091110 | Esophagus | ESCC | generation of precursor metabolites and energy | 331/8552 | 490/18723 | 3.86e-23 | 8.45e-21 | 331 |
| GO:0045333110 | Esophagus | ESCC | cellular respiration | 173/8552 | 230/18723 | 4.53e-20 | 5.99e-18 | 173 |
| GO:0033108110 | Esophagus | ESCC | mitochondrial respiratory chain complex assembly | 83/8552 | 93/18723 | 9.56e-19 | 1.05e-16 | 83 |
| GO:014005313 | Esophagus | ESCC | mitochondrial gene expression | 93/8552 | 108/18723 | 1.96e-18 | 2.03e-16 | 93 |
| GO:0009060110 | Esophagus | ESCC | aerobic respiration | 145/8552 | 189/18723 | 2.16e-18 | 2.21e-16 | 145 |
| GO:0015980110 | Esophagus | ESCC | energy derivation by oxidation of organic compounds | 220/8552 | 318/18723 | 1.20e-17 | 1.09e-15 | 220 |
| GO:0006417111 | Esophagus | ESCC | regulation of translation | 304/8552 | 468/18723 | 1.53e-17 | 1.33e-15 | 304 |
| GO:003254314 | Esophagus | ESCC | mitochondrial translation | 68/8552 | 76/18723 | 1.02e-15 | 6.86e-14 | 68 |
| GO:001700413 | Esophagus | ESCC | cytochrome complex assembly | 34/8552 | 36/18723 | 5.08e-10 | 1.31e-08 | 34 |
| GO:00060997 | Esophagus | ESCC | tricarboxylic acid cycle | 27/8552 | 30/18723 | 4.54e-07 | 6.15e-06 | 27 |
| GO:000853512 | Esophagus | ESCC | respiratory chain complex IV assembly | 24/8552 | 26/18723 | 6.87e-07 | 8.99e-06 | 24 |
| GO:003361712 | Esophagus | ESCC | mitochondrial cytochrome c oxidase assembly | 21/8552 | 22/18723 | 8.75e-07 | 1.13e-05 | 21 |
| GO:00701292 | Esophagus | ESCC | regulation of mitochondrial translation | 22/8552 | 24/18723 | 2.82e-06 | 3.21e-05 | 22 |
| GO:00097919 | Esophagus | ESCC | post-embryonic development | 56/8552 | 80/18723 | 9.08e-06 | 8.71e-05 | 56 |
| GO:00621252 | Esophagus | ESCC | regulation of mitochondrial gene expression | 24/8552 | 28/18723 | 1.37e-05 | 1.25e-04 | 24 |
| GO:005507617 | Esophagus | ESCC | transition metal ion homeostasis | 87/8552 | 138/18723 | 2.85e-05 | 2.37e-04 | 87 |
| GO:001003827 | Esophagus | ESCC | response to metal ion | 208/8552 | 373/18723 | 5.02e-05 | 3.90e-04 | 208 |
| GO:004346719 | Esophagus | ESCC | regulation of generation of precursor metabolites and energy | 81/8552 | 130/18723 | 9.58e-05 | 6.81e-04 | 81 |
| GO:00469169 | Esophagus | ESCC | cellular transition metal ion homeostasis | 70/8552 | 115/18723 | 7.28e-04 | 3.79e-03 | 70 |
| GO:00723503 | Esophagus | ESCC | tricarboxylic acid metabolic process | 12/8552 | 14/18723 | 2.51e-03 | 1.08e-02 | 12 |
| Page: 1 2 3 4 |
| Pathway ID | Tissue | Disease Stage | Description | Gene Ratio | Bg Ratio | pvalue | p.adjust | qvalue | Count |
| hsa0002014 | Esophagus | ESCC | Citrate cycle (TCA cycle) | 27/4205 | 30/8465 | 3.48e-06 | 1.94e-05 | 9.95e-06 | 27 |
| hsa0120023 | Esophagus | ESCC | Carbon metabolism | 79/4205 | 115/8465 | 2.50e-05 | 1.21e-04 | 6.22e-05 | 79 |
| hsa0123023 | Esophagus | ESCC | Biosynthesis of amino acids | 49/4205 | 75/8465 | 4.35e-03 | 1.12e-02 | 5.74e-03 | 49 |
| hsa006306 | Esophagus | ESCC | Glyoxylate and dicarboxylate metabolism | 21/4205 | 30/8465 | 1.95e-02 | 4.35e-02 | 2.23e-02 | 21 |
| hsa0002015 | Esophagus | ESCC | Citrate cycle (TCA cycle) | 27/4205 | 30/8465 | 3.48e-06 | 1.94e-05 | 9.95e-06 | 27 |
| hsa0120033 | Esophagus | ESCC | Carbon metabolism | 79/4205 | 115/8465 | 2.50e-05 | 1.21e-04 | 6.22e-05 | 79 |
| hsa0123033 | Esophagus | ESCC | Biosynthesis of amino acids | 49/4205 | 75/8465 | 4.35e-03 | 1.12e-02 | 5.74e-03 | 49 |
| hsa0063013 | Esophagus | ESCC | Glyoxylate and dicarboxylate metabolism | 21/4205 | 30/8465 | 1.95e-02 | 4.35e-02 | 2.23e-02 | 21 |
| Page: 1 |
Top |
Cell-cell communication analysis |
| Identification of potential cell-cell interactions between two cell types and their ligand-receptor pairs for different disease states |
| Ligand | Receptor | LRpair | Pathway | Tissue | Disease Stage |
| Page: 1 |
Top |
Single-cell gene regulatory network inference analysis |
| Find out the significant the regulons (TFs) and the target genes of each regulon across cell types for different disease states |
| TF | Cell Type | Tissue | Disease Stage | Target Gene | RSS | Regulon Activity |
| ∗The dot plots of a searched regulon are shown for all cell subpopulations in each disease state of each tissue based on the regulon specific score inferred using pySCENIC and by calculating the average expression. |
| Page: 1 |
Top |
Somatic mutation of malignant transformation related genes |
| Annotation of somatic variants for genes involved in malignant transformation |
| Hugo Symbol | Variant Class | Variant Classification | dbSNP RS | HGVSc | HGVSp | HGVSp Short | SWISSPROT | BIOTYPE | SIFT | PolyPhen | Tumor Sample Barcode | Tissue | Histology | Sex | Age | Stage | Therapy Types | Drugs | Outcome |
| ACO1 | SNV | Missense_Mutation | c.2255T>A | p.Val752Glu | p.V752E | P21399 | protein_coding | deleterious(0) | probably_damaging(0.996) | TCGA-A8-A07R-01 | Breast | breast invasive carcinoma | Female | >=65 | III/IV | Ancillary | zoledronic | SD | |
| ACO1 | SNV | Missense_Mutation | c.715N>T | p.Leu239Phe | p.L239F | P21399 | protein_coding | deleterious(0) | probably_damaging(0.915) | TCGA-BH-A0HF-01 | Breast | breast invasive carcinoma | Female | >=65 | I/II | Hormone Therapy | arimidex | SD | |
| ACO1 | insertion | In_Frame_Ins | novel | c.1566_1567insGCACTTTGGGAGGCTGAGGCAGGCAGATCACGAGAT | p.Thr522_Gln523insAlaLeuTrpGluAlaGluAlaGlyArgSerArgAsp | p.T522_Q523insALWEAEAGRSRD | P21399 | protein_coding | TCGA-AO-A03R-01 | Breast | breast invasive carcinoma | Female | <65 | I/II | Chemotherapy | doxorubicin | SD | ||
| ACO1 | SNV | Missense_Mutation | novel | c.1064N>C | p.Phe355Ser | p.F355S | P21399 | protein_coding | deleterious(0) | probably_damaging(0.982) | TCGA-2W-A8YY-01 | Cervix | cervical & endocervical cancer | Female | <65 | I/II | Chemotherapy | cisplatin | CR |
| ACO1 | SNV | Missense_Mutation | c.760C>G | p.Leu254Val | p.L254V | P21399 | protein_coding | tolerated(0.49) | benign(0.043) | TCGA-C5-A1BJ-01 | Cervix | cervical & endocervical cancer | Female | <65 | I/II | Unknown | Unknown | SD | |
| ACO1 | SNV | Missense_Mutation | c.482N>T | p.Ser161Phe | p.S161F | P21399 | protein_coding | deleterious(0) | probably_damaging(0.939) | TCGA-IR-A3LL-01 | Cervix | cervical & endocervical cancer | Female | <65 | I/II | Chemotherapy | cisplatin | CR | |
| ACO1 | SNV | Missense_Mutation | novel | c.1051N>G | p.Gln351Glu | p.Q351E | P21399 | protein_coding | tolerated(0.99) | benign(0.005) | TCGA-VS-A8EL-01 | Cervix | cervical & endocervical cancer | Female | <65 | I/II | Chemotherapy | cisplatin | CR |
| ACO1 | SNV | Missense_Mutation | c.1001N>C | p.Lys334Thr | p.K334T | P21399 | protein_coding | deleterious(0.03) | benign(0.001) | TCGA-AA-3510-01 | Colorectum | colon adenocarcinoma | Male | >=65 | I/II | Unknown | Unknown | SD | |
| ACO1 | SNV | Missense_Mutation | rs376599072 | c.57G>T | p.Lys19Asn | p.K19N | P21399 | protein_coding | tolerated(0.22) | benign(0.201) | TCGA-AA-3984-01 | Colorectum | colon adenocarcinoma | Female | <65 | I/II | Unknown | Unknown | SD |
| ACO1 | SNV | Missense_Mutation | novel | c.469T>G | p.Leu157Val | p.L157V | P21399 | protein_coding | deleterious(0) | probably_damaging(0.923) | TCGA-AA-A00N-01 | Colorectum | colon adenocarcinoma | Male | >=65 | I/II | Unknown | Unknown | PD |
| Page: 1 2 3 4 5 6 7 8 9 |
Top |
Related drugs of malignant transformation related genes |
| Identification of chemicals and drugs interact with genes involved in malignant transfromation |
| (DGIdb 4.0) |
| Entrez ID | Symbol | Category | Interaction Types | Drug Claim Name | Drug Name | PMIDs |
| 48 | ACO1 | ENZYME | ANTISERUM | 8764614 | ||
| 48 | ACO1 | ENZYME | ANTIOXIDANT | 10037708 | ||
| 48 | ACO1 | ENZYME | N-ACETYLCYSTEINE | ACETYLCYSTEINE | 10037708 |
| Page: 1 |

Copyright 2023-Present -The University of Texas Health Science Center at Houston |