
|
|||||
|
 | |
| |
| |
| |
| |
| |
|
Gene: ACKR3 |
Gene summary for ACKR3 |
| Gene information | Species | Human | Gene symbol | ACKR3 | Gene ID | 57007 |
| Gene name | atypical chemokine receptor 3 | |
| Gene Alias | CMKOR1 | |
| Cytomap | 2q37.3 | |
| Gene Type | protein-coding | GO ID | GO:0000165 | UniProtAcc | P25106 |
Top |
Malignant transformation analysis |
| Identification of the aberrant gene expression in precancerous and cancerous lesions by comparing the gene expression of stem-like cells in diseased tissues with normal stem cells |
| Entrez ID | Symbol | Replicates | Species | Organ | Tissue | Adj P-value | Log2FC | Malignancy |
| 57007 | ACKR3 | CCI_3 | Human | Cervix | CC | 1.46e-06 | 5.92e-01 | 0.516 |
| 57007 | ACKR3 | Tumor | Human | Cervix | CC | 5.37e-39 | 7.64e-01 | 0.1241 |
| 57007 | ACKR3 | sample3 | Human | Cervix | CC | 2.09e-54 | 9.60e-01 | 0.1387 |
| 57007 | ACKR3 | T3 | Human | Cervix | CC | 1.02e-54 | 9.84e-01 | 0.1389 |
| 57007 | ACKR3 | LZE4T | Human | Esophagus | ESCC | 1.40e-13 | 5.45e-01 | 0.0811 |
| 57007 | ACKR3 | LZE8T | Human | Esophagus | ESCC | 1.34e-02 | 5.11e-02 | 0.067 |
| 57007 | ACKR3 | LZE24T | Human | Esophagus | ESCC | 2.75e-08 | 2.04e-02 | 0.0596 |
| 57007 | ACKR3 | LZE21T | Human | Esophagus | ESCC | 1.18e-04 | 1.73e-01 | 0.0655 |
| 57007 | ACKR3 | P5T-E | Human | Esophagus | ESCC | 8.89e-22 | 4.03e-01 | 0.1327 |
| 57007 | ACKR3 | P8T-E | Human | Esophagus | ESCC | 4.10e-36 | 8.15e-01 | 0.0889 |
| 57007 | ACKR3 | P9T-E | Human | Esophagus | ESCC | 2.54e-04 | 2.64e-01 | 0.1131 |
| 57007 | ACKR3 | P10T-E | Human | Esophagus | ESCC | 3.02e-09 | 1.73e-01 | 0.116 |
| 57007 | ACKR3 | P11T-E | Human | Esophagus | ESCC | 1.88e-06 | 3.91e-01 | 0.1426 |
| 57007 | ACKR3 | P12T-E | Human | Esophagus | ESCC | 6.09e-23 | 5.59e-01 | 0.1122 |
| 57007 | ACKR3 | P15T-E | Human | Esophagus | ESCC | 3.79e-15 | 3.59e-01 | 0.1149 |
| 57007 | ACKR3 | P21T-E | Human | Esophagus | ESCC | 2.41e-10 | 3.10e-02 | 0.1617 |
| 57007 | ACKR3 | P22T-E | Human | Esophagus | ESCC | 2.89e-10 | -2.66e-02 | 0.1236 |
| 57007 | ACKR3 | P23T-E | Human | Esophagus | ESCC | 1.56e-02 | 3.02e-01 | 0.108 |
| 57007 | ACKR3 | P26T-E | Human | Esophagus | ESCC | 1.41e-12 | 1.54e-01 | 0.1276 |
| 57007 | ACKR3 | P28T-E | Human | Esophagus | ESCC | 2.46e-07 | -5.11e-02 | 0.1149 |
| Page: 1 2 3 |
| Tissue | Expression Dynamics | Abbreviation |
| Cervix | 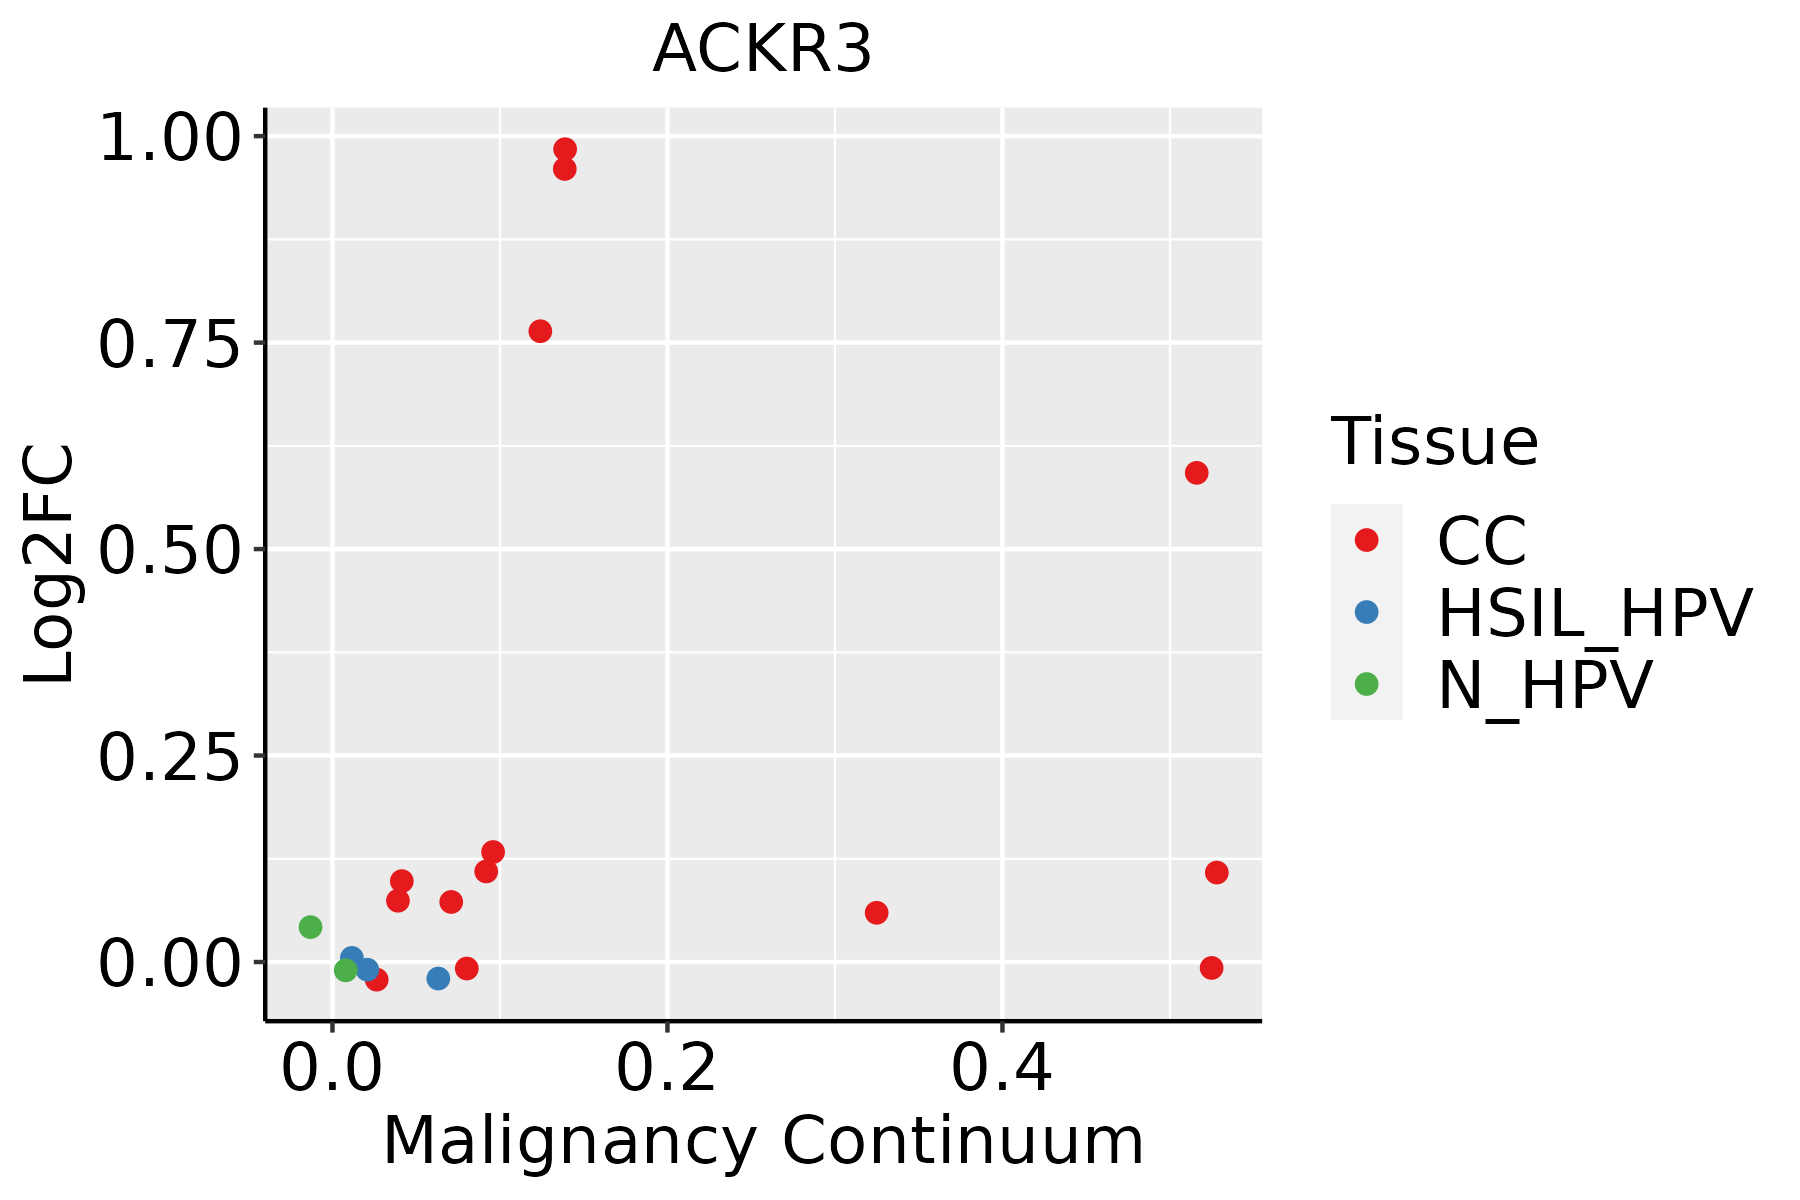 | CC: Cervix cancer |
| HSIL_HPV: HPV-infected high-grade squamous intraepithelial lesions | ||
| N_HPV: HPV-infected normal cervix | ||
| Esophagus |  | ESCC: Esophageal squamous cell carcinoma |
| HGIN: High-grade intraepithelial neoplasias | ||
| LGIN: Low-grade intraepithelial neoplasias | ||
| Oral Cavity | 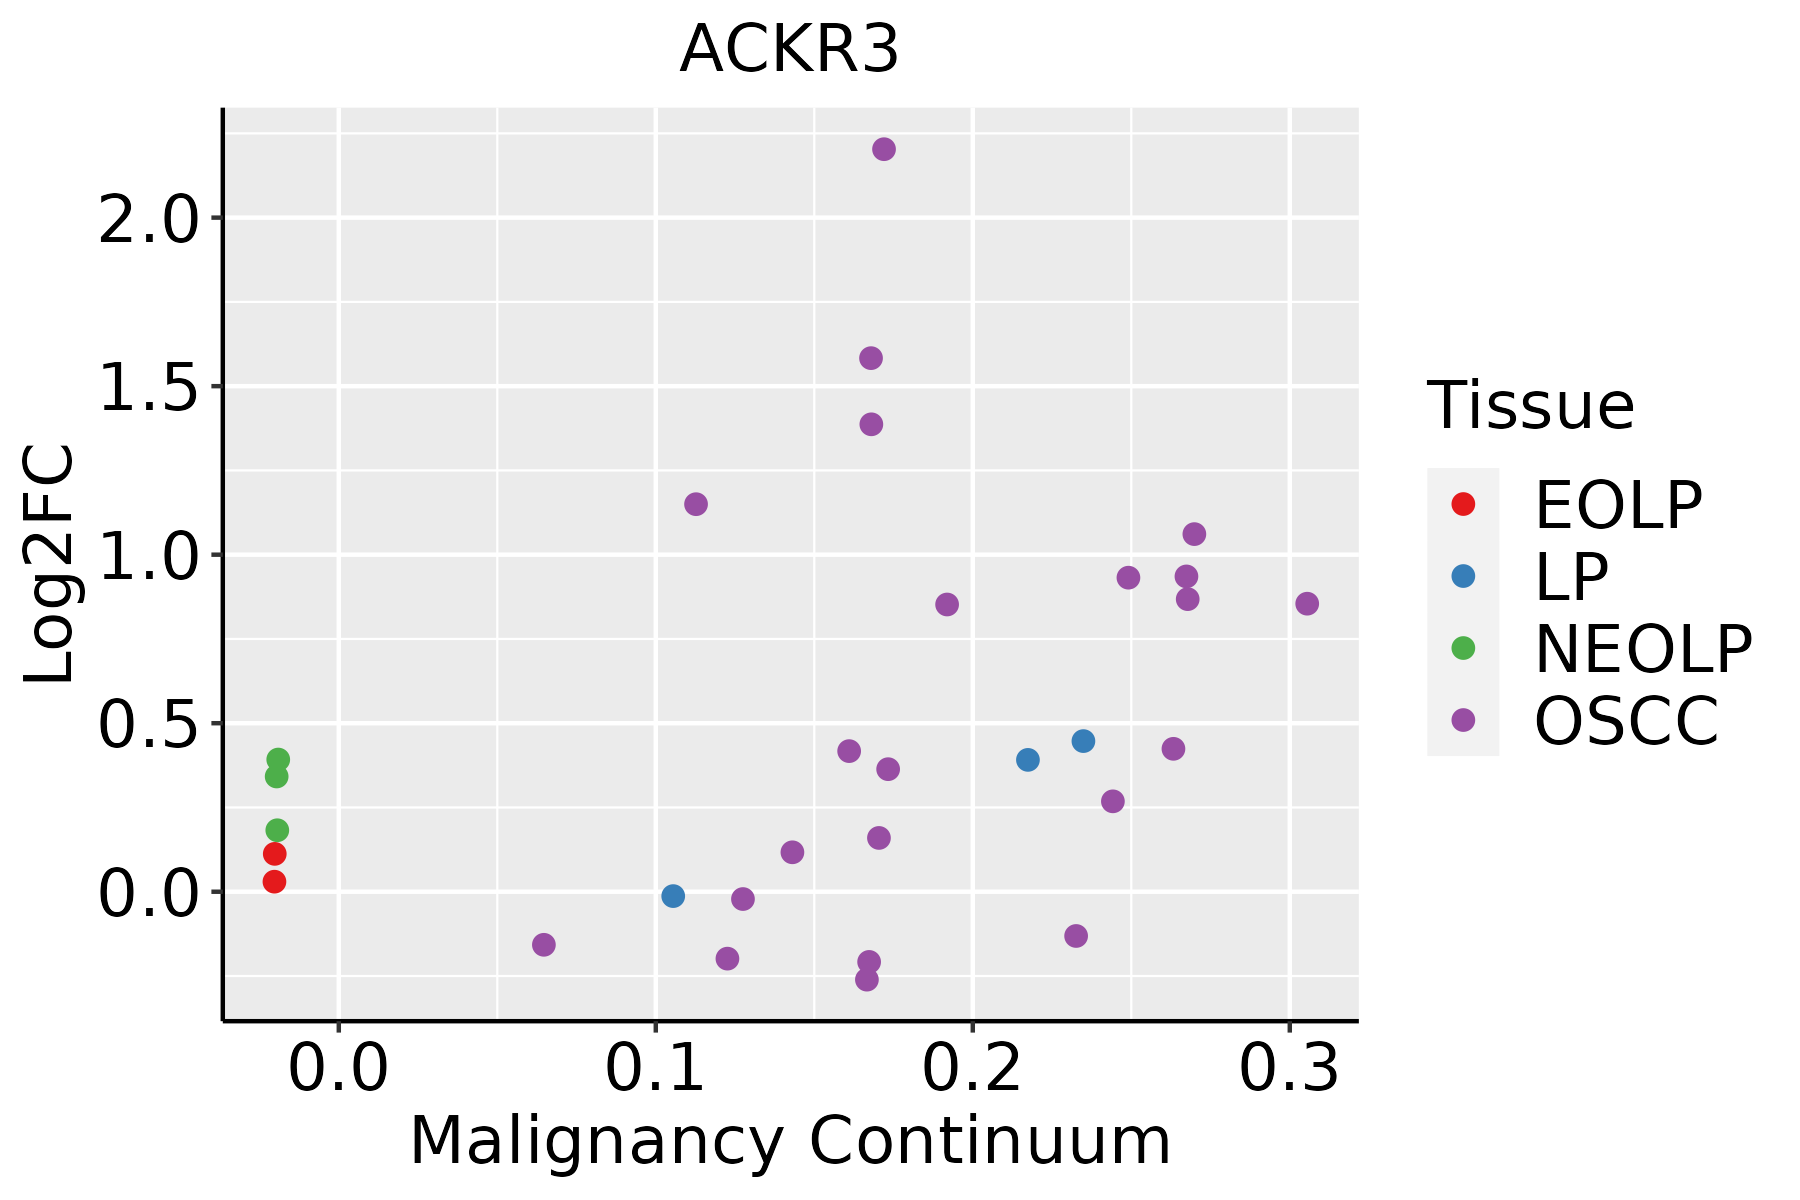 | EOLP: Erosive Oral lichen planus |
| LP: leukoplakia | ||
| NEOLP: Non-erosive oral lichen planus | ||
| OSCC: Oral squamous cell carcinoma |
| ∗log2FC in expression of this searched gene in stem-like cells from each diseased tissue sample relative to stem-like cells in normal samples in each tissue plotted against the malignancy continuum. Samples are colored based on if they are from different disease stage. |
Top |
Malignant transformation related pathway analysis |
| Find out the enriched GO biological processes and KEGG pathways involved in transition from healthy to precancer to cancer |
| Tissue | Disease Stage | Enriched GO biological Processes |
| Colorectum | AD |  |
| Colorectum | SER |  |
| Colorectum | MSS |  |
| Colorectum | MSI-H |  |
| Colorectum | FAP |  |
| ∗Top 15 enriched GO BP terms are showed in the bar plot of each disease state in each tissue. Each row represents a significant GO biological process which is colored according to the -log10(p.adjust). |
| Page: 1 2 3 4 5 6 7 8 9 |
| GO ID | Tissue | Disease Stage | Description | Gene Ratio | Bg Ratio | pvalue | p.adjust | Count |
| GO:009719310 | Cervix | CC | intrinsic apoptotic signaling pathway | 85/2311 | 288/18723 | 4.56e-15 | 6.46e-12 | 85 |
| GO:200123310 | Cervix | CC | regulation of apoptotic signaling pathway | 96/2311 | 356/18723 | 4.08e-14 | 3.05e-11 | 96 |
| GO:200124210 | Cervix | CC | regulation of intrinsic apoptotic signaling pathway | 52/2311 | 164/18723 | 5.06e-11 | 1.01e-08 | 52 |
| GO:00603267 | Cervix | CC | cell chemotaxis | 73/2311 | 310/18723 | 2.82e-08 | 1.96e-06 | 73 |
| GO:200123410 | Cervix | CC | negative regulation of apoptotic signaling pathway | 56/2311 | 224/18723 | 1.39e-07 | 6.70e-06 | 56 |
| GO:200124310 | Cervix | CC | negative regulation of intrinsic apoptotic signaling pathway | 28/2311 | 98/18723 | 1.31e-05 | 2.66e-04 | 28 |
| GO:00068987 | Cervix | CC | receptor-mediated endocytosis | 53/2311 | 244/18723 | 2.52e-05 | 4.29e-04 | 53 |
| GO:00434104 | Cervix | CC | positive regulation of MAPK cascade | 90/2311 | 480/18723 | 2.92e-05 | 4.83e-04 | 90 |
| GO:20010209 | Cervix | CC | regulation of response to DNA damage stimulus | 46/2311 | 219/18723 | 1.92e-04 | 2.23e-03 | 46 |
| GO:00015704 | Cervix | CC | vasculogenesis | 22/2311 | 80/18723 | 1.97e-04 | 2.26e-03 | 22 |
| GO:00431127 | Cervix | CC | receptor metabolic process | 37/2311 | 166/18723 | 2.31e-04 | 2.58e-03 | 37 |
| GO:00192213 | Cervix | CC | cytokine-mediated signaling pathway | 84/2311 | 472/18723 | 3.25e-04 | 3.44e-03 | 84 |
| GO:00086309 | Cervix | CC | intrinsic apoptotic signaling pathway in response to DNA damage | 24/2311 | 99/18723 | 7.93e-04 | 6.99e-03 | 24 |
| GO:19022294 | Cervix | CC | regulation of intrinsic apoptotic signaling pathway in response to DNA damage | 12/2311 | 36/18723 | 8.74e-04 | 7.58e-03 | 12 |
| GO:00703714 | Cervix | CC | ERK1 and ERK2 cascade | 60/2311 | 330/18723 | 1.28e-03 | 1.02e-02 | 60 |
| GO:00703723 | Cervix | CC | regulation of ERK1 and ERK2 cascade | 54/2311 | 309/18723 | 5.11e-03 | 3.02e-02 | 54 |
| GO:00316236 | Cervix | CC | receptor internalization | 24/2311 | 113/18723 | 5.18e-03 | 3.05e-02 | 24 |
| GO:0097193111 | Esophagus | ESCC | intrinsic apoptotic signaling pathway | 222/8552 | 288/18723 | 5.87e-28 | 2.02e-25 | 222 |
| GO:2001233111 | Esophagus | ESCC | regulation of apoptotic signaling pathway | 256/8552 | 356/18723 | 4.11e-24 | 1.04e-21 | 256 |
| GO:2001242111 | Esophagus | ESCC | regulation of intrinsic apoptotic signaling pathway | 128/8552 | 164/18723 | 1.75e-17 | 1.50e-15 | 128 |
| Page: 1 2 3 4 |
| Pathway ID | Tissue | Disease Stage | Description | Gene Ratio | Bg Ratio | pvalue | p.adjust | qvalue | Count |
| Page: 1 |
Top |
Cell-cell communication analysis |
| Identification of potential cell-cell interactions between two cell types and their ligand-receptor pairs for different disease states |
| Ligand | Receptor | LRpair | Pathway | Tissue | Disease Stage |
| MIF | ACKR3 | MIF_ACKR3 | MIF | Breast | ADJ |
| CXCL12 | ACKR3 | CXCL12_ACKR3 | CXCL | Breast | ADJ |
| MIF | ACKR3 | MIF_ACKR3 | MIF | Breast | DCIS |
| CXCL12 | ACKR3 | CXCL12_ACKR3 | CXCL | Breast | DCIS |
| MIF | ACKR3 | MIF_ACKR3 | MIF | Breast | Healthy |
| CXCL12 | ACKR3 | CXCL12_ACKR3 | CXCL | Breast | Healthy |
| CXCL12 | ACKR3 | CXCL12_ACKR3 | CXCL | Cervix | ADJ |
| MIF | ACKR3 | MIF_ACKR3 | MIF | Cervix | ADJ |
| MIF | ACKR3 | MIF_ACKR3 | MIF | Cervix | CC |
| CXCL12 | ACKR3 | CXCL12_ACKR3 | CXCL | Cervix | CC |
| CXCL12 | ACKR3 | CXCL12_ACKR3 | CXCL | CRC | AD |
| CXCL12 | ACKR3 | CXCL12_ACKR3 | CXCL | CRC | ADJ |
| CXCL12 | ACKR3 | CXCL12_ACKR3 | CXCL | CRC | MSI-H |
| CXCL12 | ACKR3 | CXCL12_ACKR3 | CXCL | CRC | SER |
| MIF | ACKR3 | MIF_ACKR3 | MIF | Endometrium | AEH |
| CXCL12 | ACKR3 | CXCL12_ACKR3 | CXCL | Endometrium | AEH |
| MIF | ACKR3 | MIF_ACKR3 | MIF | Endometrium | EEC |
| CXCL12 | ACKR3 | CXCL12_ACKR3 | CXCL | Endometrium | EEC |
| MIF | ACKR3 | MIF_ACKR3 | MIF | Esophagus | ESCC |
| CXCL11 | ACKR3 | CXCL11_ACKR3 | CXCL | Esophagus | ESCC |
| Page: 1 |
Top |
Single-cell gene regulatory network inference analysis |
| Find out the significant the regulons (TFs) and the target genes of each regulon across cell types for different disease states |
| TF | Cell Type | Tissue | Disease Stage | Target Gene | RSS | Regulon Activity |
| ∗The dot plots of a searched regulon are shown for all cell subpopulations in each disease state of each tissue based on the regulon specific score inferred using pySCENIC and by calculating the average expression. |
| Page: 1 |
Top |
Somatic mutation of malignant transformation related genes |
| Annotation of somatic variants for genes involved in malignant transformation |
| Hugo Symbol | Variant Class | Variant Classification | dbSNP RS | HGVSc | HGVSp | HGVSp Short | SWISSPROT | BIOTYPE | SIFT | PolyPhen | Tumor Sample Barcode | Tissue | Histology | Sex | Age | Stage | Therapy Types | Drugs | Outcome |
| ACKR3 | SNV | Missense_Mutation | c.414G>T | p.Met138Ile | p.M138I | P25106 | protein_coding | tolerated(0.05) | probably_damaging(0.992) | TCGA-5L-AAT1-01 | Breast | breast invasive carcinoma | Female | <65 | III/IV | Hormone Therapy | letrozol | SD | |
| ACKR3 | SNV | Missense_Mutation | c.99N>T | p.Met33Ile | p.M33I | P25106 | protein_coding | tolerated(0.44) | benign(0) | TCGA-AC-A23H-01 | Breast | breast invasive carcinoma | Female | >=65 | I/II | Unknown | Unknown | PD | |
| ACKR3 | SNV | Missense_Mutation | c.577G>A | p.Glu193Lys | p.E193K | P25106 | protein_coding | tolerated(0.39) | possibly_damaging(0.6) | TCGA-AN-A0XW-01 | Breast | breast invasive carcinoma | Female | <65 | III/IV | Unknown | Unknown | SD | |
| ACKR3 | deletion | Frame_Shift_Del | novel | c.637delG | p.Glu213SerfsTer114 | p.E213Sfs*114 | P25106 | protein_coding | TCGA-D8-A27V-01 | Breast | breast invasive carcinoma | Female | <65 | I/II | Hormone Therapy | tamoxiphen | SD | ||
| ACKR3 | SNV | Missense_Mutation | c.252N>C | p.Leu84Phe | p.L84F | P25106 | protein_coding | tolerated(0.21) | benign(0.019) | TCGA-JW-A5VL-01 | Cervix | cervical & endocervical cancer | Female | <65 | I/II | Unknown | Unknown | SD | |
| ACKR3 | SNV | Missense_Mutation | novel | c.954N>G | p.Ile318Met | p.I318M | P25106 | protein_coding | deleterious(0.02) | benign(0.278) | TCGA-VS-A958-01 | Cervix | cervical & endocervical cancer | Female | <65 | I/II | Chemotherapy | cisplatin | CR |
| ACKR3 | SNV | Missense_Mutation | rs200114828 | c.137N>T | p.Thr46Met | p.T46M | P25106 | protein_coding | deleterious(0.02) | benign(0.212) | TCGA-A6-6780-01 | Colorectum | colon adenocarcinoma | Male | >=65 | I/II | Unknown | Unknown | SD |
| ACKR3 | SNV | Missense_Mutation | rs747331262 | c.485N>A | p.Arg162His | p.R162H | P25106 | protein_coding | tolerated(0.07) | possibly_damaging(0.873) | TCGA-A6-6780-01 | Colorectum | colon adenocarcinoma | Male | >=65 | I/II | Unknown | Unknown | SD |
| ACKR3 | SNV | Missense_Mutation | c.482N>A | p.Arg161His | p.R161H | P25106 | protein_coding | deleterious(0) | possibly_damaging(0.873) | TCGA-A6-6781-01 | Colorectum | colon adenocarcinoma | Male | <65 | III/IV | Chemotherapy | oxaliplatin | SD | |
| ACKR3 | SNV | Missense_Mutation | rs200095631 | c.236C>T | p.Thr79Met | p.T79M | P25106 | protein_coding | tolerated(0.06) | benign(0.04) | TCGA-AA-3692-01 | Colorectum | colon adenocarcinoma | Female | <65 | III/IV | Chemotherapy | folinic | PD |
| Page: 1 2 3 4 5 6 7 |
Top |
Related drugs of malignant transformation related genes |
| Identification of chemicals and drugs interact with genes involved in malignant transfromation |
| (DGIdb 4.0) |
| Entrez ID | Symbol | Category | Interaction Types | Drug Claim Name | Drug Name | PMIDs |
| 57007 | ACKR3 | G PROTEIN COUPLED RECEPTOR, DRUGGABLE GENOME, CLINICALLY ACTIONABLE, CELL SURFACE, EXTERNAL SIDE OF PLASMA MEMBRANE | agonist | 135652600 | ||
| 57007 | ACKR3 | G PROTEIN COUPLED RECEPTOR, DRUGGABLE GENOME, CLINICALLY ACTIONABLE, CELL SURFACE, EXTERNAL SIDE OF PLASMA MEMBRANE | agonist | 135651708 | ||
| 57007 | ACKR3 | G PROTEIN COUPLED RECEPTOR, DRUGGABLE GENOME, CLINICALLY ACTIONABLE, CELL SURFACE, EXTERNAL SIDE OF PLASMA MEMBRANE | agonist | 135649932 | PLERIXAFOR | |
| 57007 | ACKR3 | G PROTEIN COUPLED RECEPTOR, DRUGGABLE GENOME, CLINICALLY ACTIONABLE, CELL SURFACE, EXTERNAL SIDE OF PLASMA MEMBRANE | agonist | 135651881 |
| Page: 1 |

Copyright 2023-Present -The University of Texas Health Science Center at Houston |